Last version published: 11/05/2017 13:38
Publication number: ELQ-21700-2
View all versions & Certificate

Cohort Analysis Calculation Excel Model
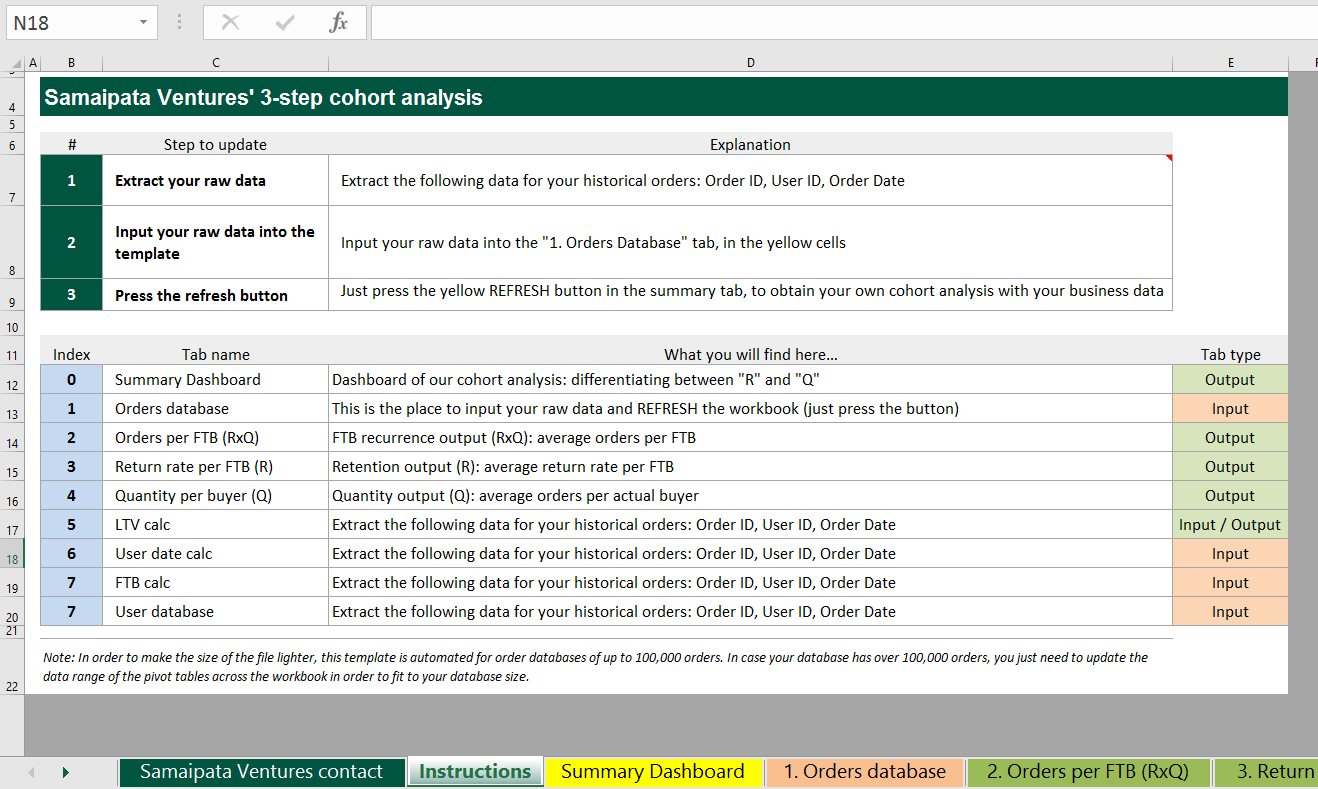
Perform an in depth cohort analysis, in 5 minutes, in 3 simple steps.
Further information
Why carry out a deep cohort analysis?
Average values given by a typical cohort analysis sometimes fail to take into account some key elements, that seem to make the story easier than it actually is.
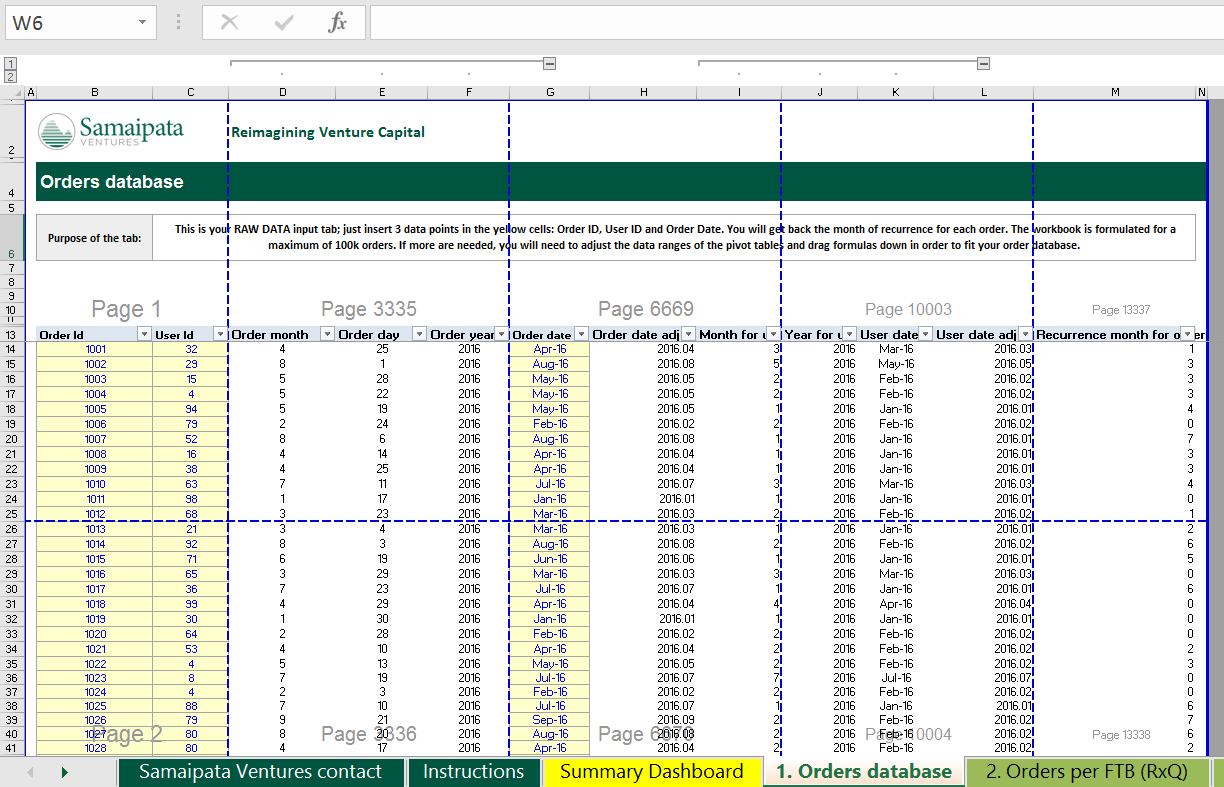
Put simply, if you have 10 clients and 100 orders for that group of clients, the traditional cohort analysis will assume (as an average) that a customer makes 10 orders.
With these conclusive values, many other possible scenarios are discarded and ultimately, you don’t have access to the essentials needed to understand how your clients are behaving.
Perhaps a few users decide to stay but become very loyal customers. Perhaps, many decide to stay but are not as active. As you may see, both scenarios are completely different.
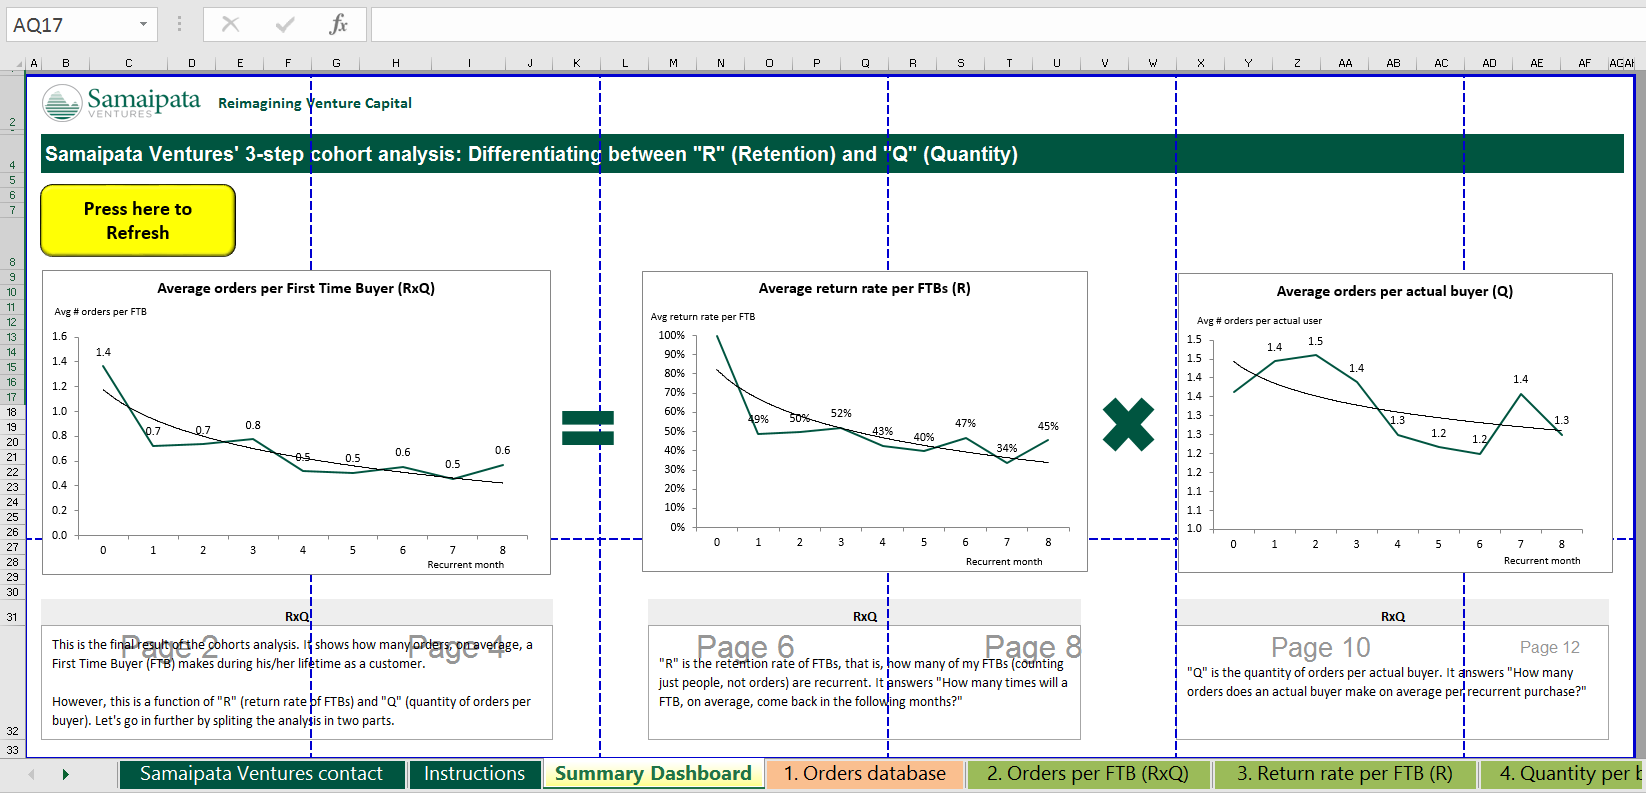
But why do we do it? At Samaipata we have the preference to separate the recurrence analysis into its two main variables.
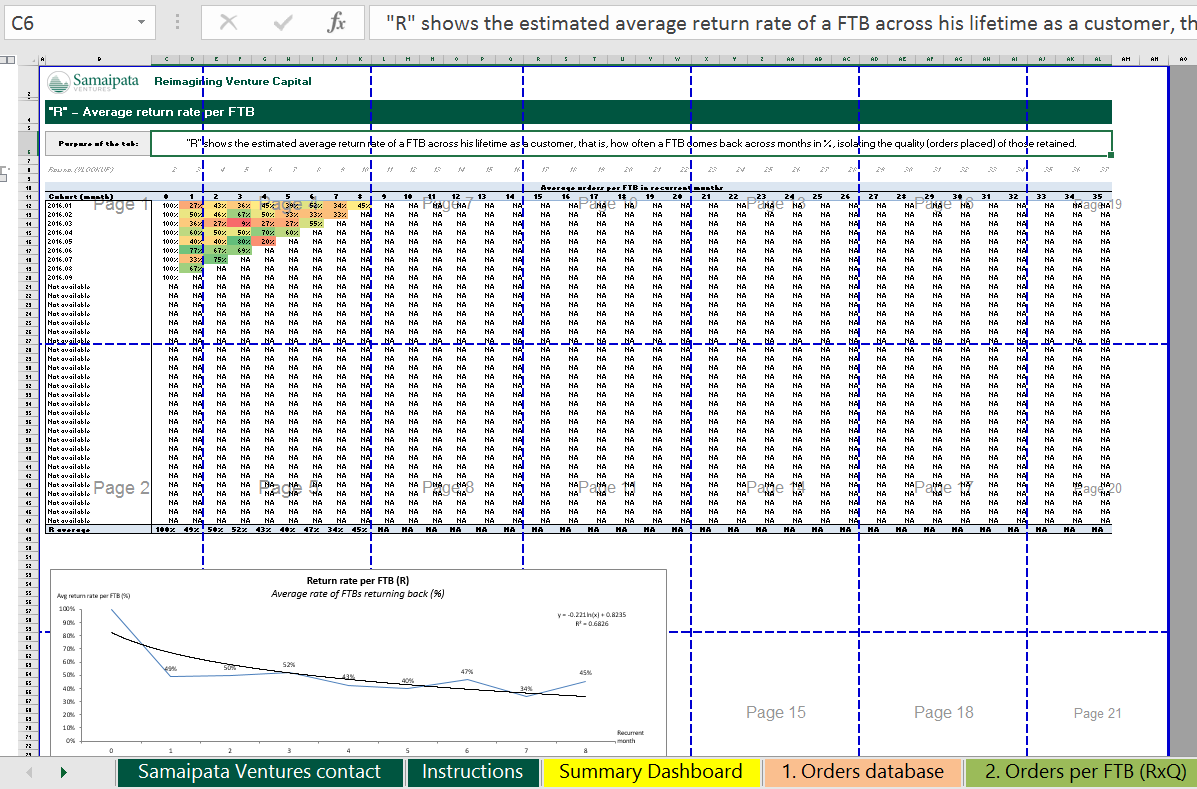
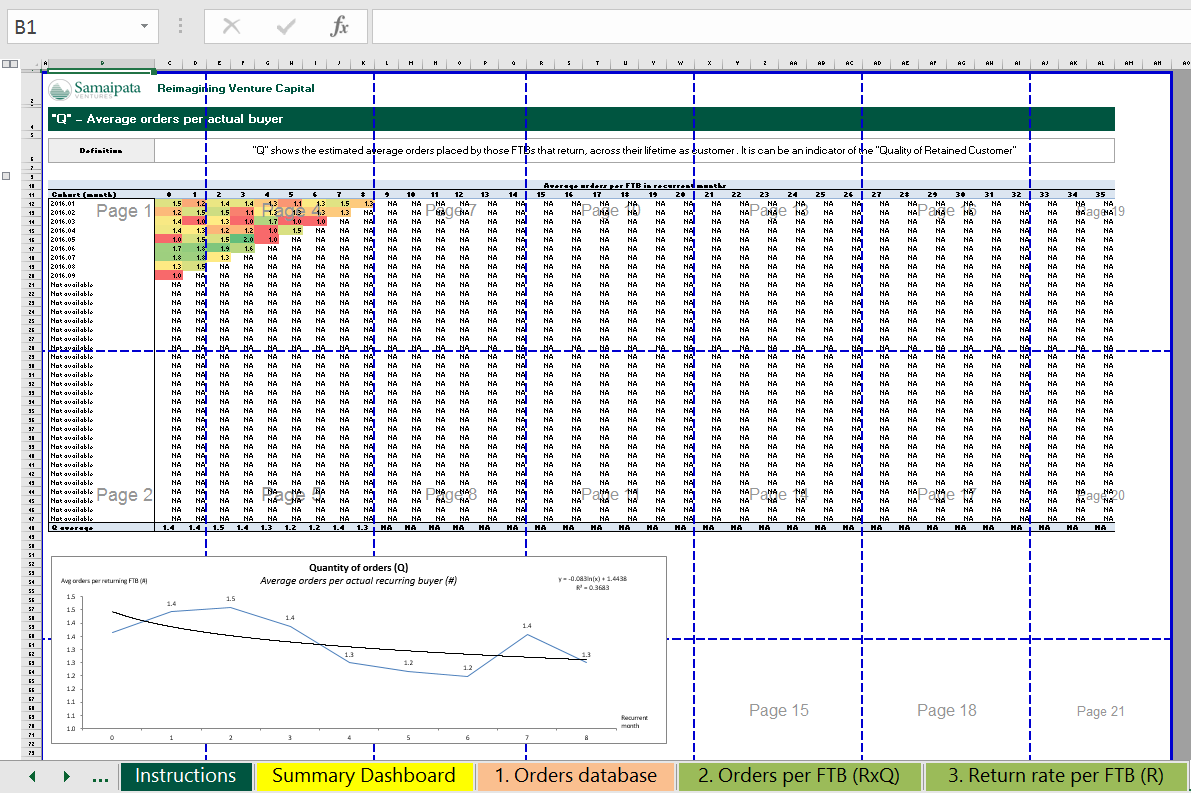
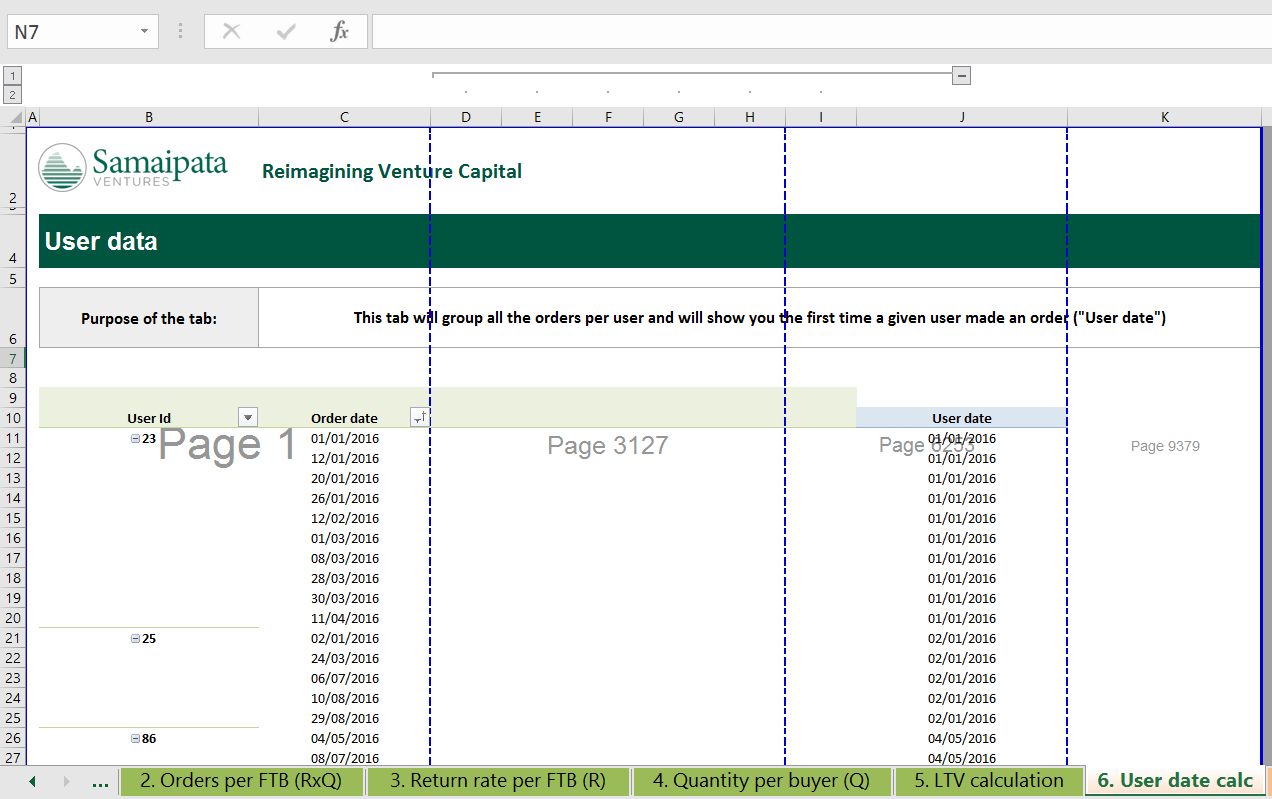
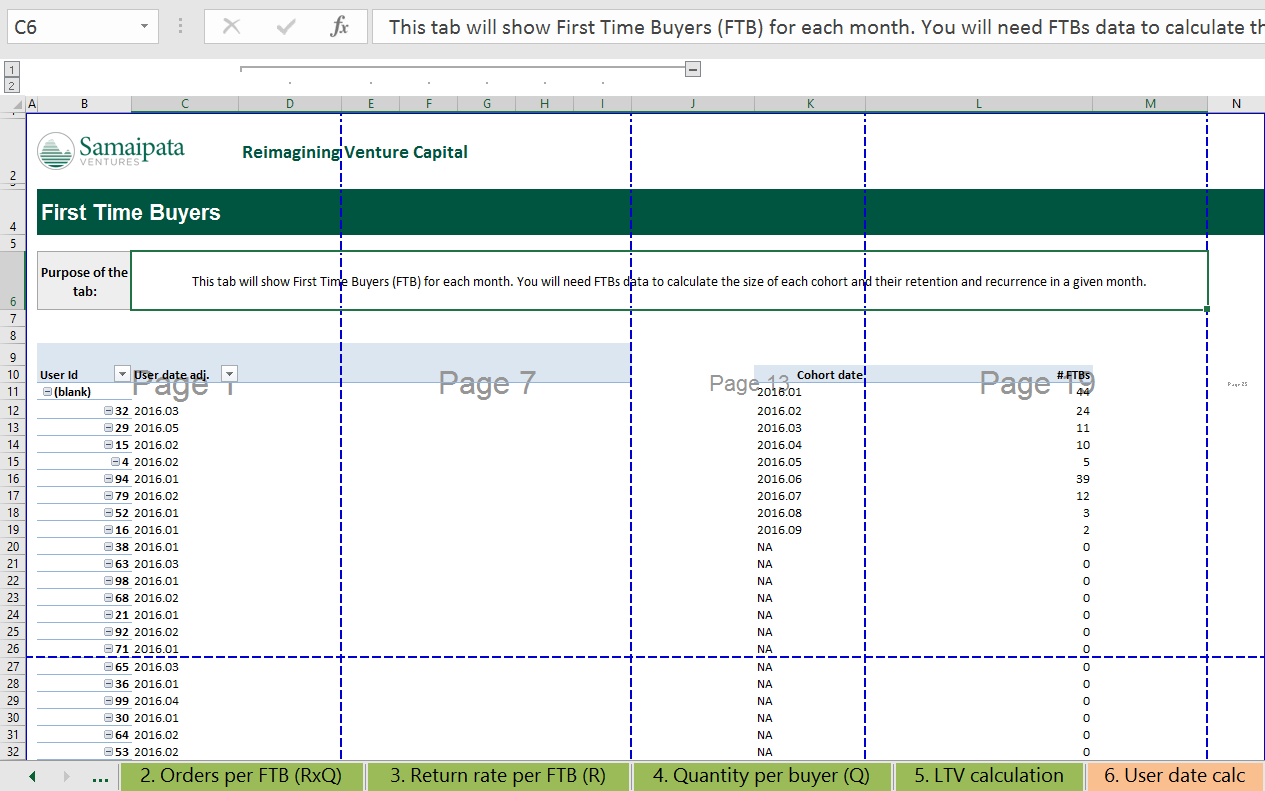
One is that we analyse user retention (meaning how many FTB remain as users, after the first month); The second one being the quantity ordered by actual buyers (how many orders an actual buyer makes in the subsequent months).
As said in the previous example, we can have two extreme cases at hand. On one hand, 1 single client could have done 100 orders, on the other, each client could have done 10 orders. But as you can see, behind the “10 average orders per new client” there can exist two very disparate scenarios. And- most importantly- two scenarios that may, in many cases, require specific and diverging business and marketing strategies.
In the first example, the problem may be the retention of users. In this case, the retention rate is only 10%- maybe the cause could be the acquiring of the wrong type of customers. Though, the FTBs which remain appear to be hooked on your product (as 1 user (10%) has stayed, and 100 order are his.). The second example, you seem to be great a customer retention (You managed to retain 100% of your users, thanks to targeted and smart acquisition strategy), nevertheless, the quantity bought by each buyer shows that they are not as hooked. (Each returning buyer only makes 10 orders, instead of the 100 orders firstly made).
Neither scenarios are better or worse, especially given that the cost of acquiring such customers does vary. But certainly, the decisions being taken for each scenario are completely different. They may appear as similar, but they are not the same.
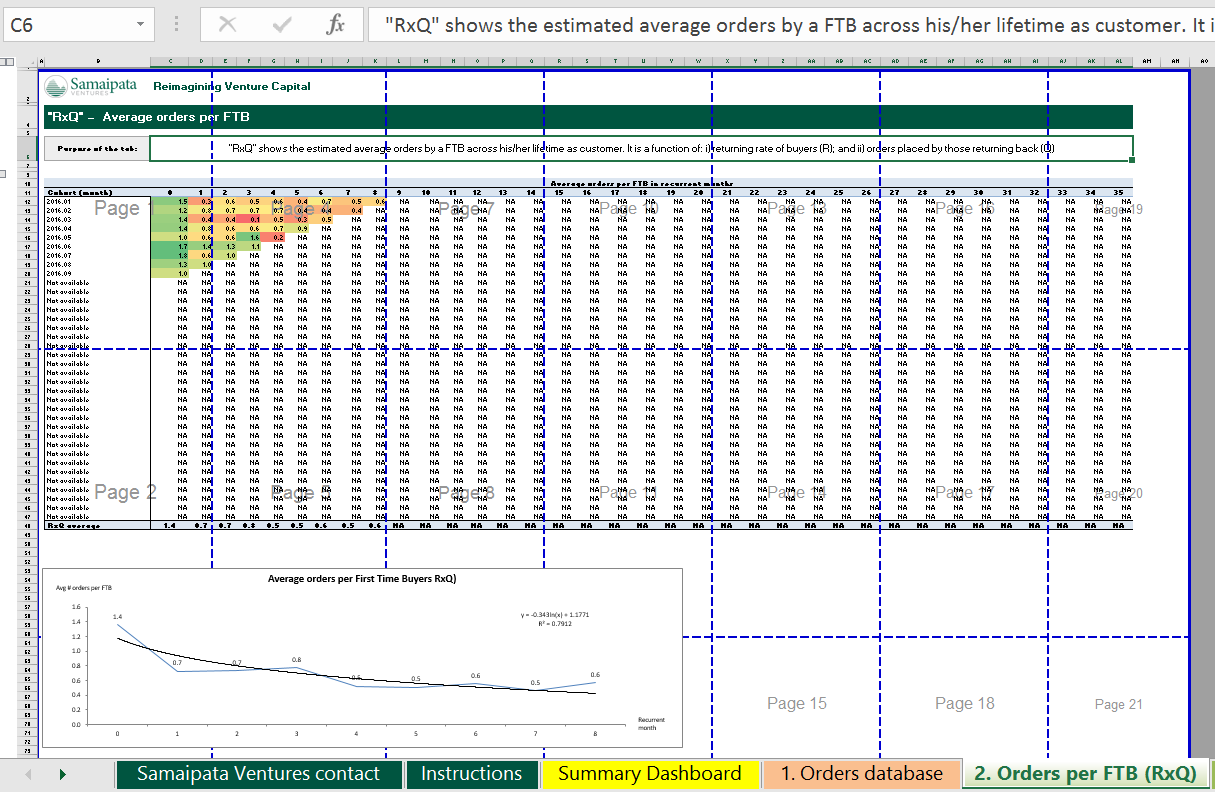
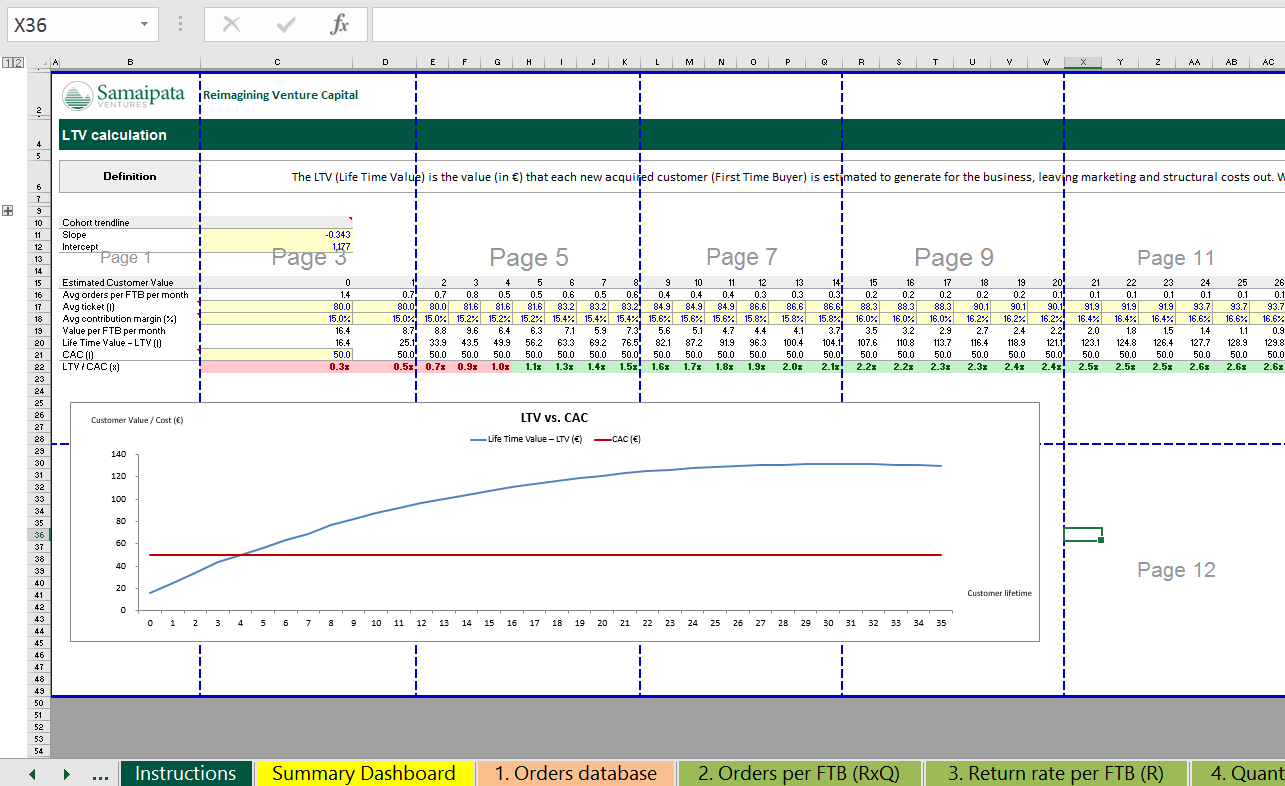
At Samaipata, we like to work in the following way: firstly, we run the traditional cohort analysis- that way we can obtain the average orders by first time buyers (FTB). Then, we search for average retention and average quantity bought by actual customers. Ultimately, we dissagregate the analysis into two parts. If the average orders by FTB can be obtained by multiplying R (AVG retention rate of FTB) x Q (AVG orders per actual buyers), then why not calculate each separately and analyse each of the variables in further depth. Would you say that you are successful at targeting and retaining the right customers? Or is it that you manage to hook them to your product, to the extent they need it to live? Or even better than that, are succeeding at both?
In either case, in order to optimize your strategy- the more you’re aware of your customer’s behaviour, the better it will be. For that reason is why we share our internal cohort analysis with you.
