
Originally published: 22/07/2016 12:06
Last version published: 22/10/2016 14:41
Publication number: ELQ-11545-2
View all versions & Certificate
Last version published: 22/10/2016 14:41
Publication number: ELQ-11545-2
View all versions & Certificate

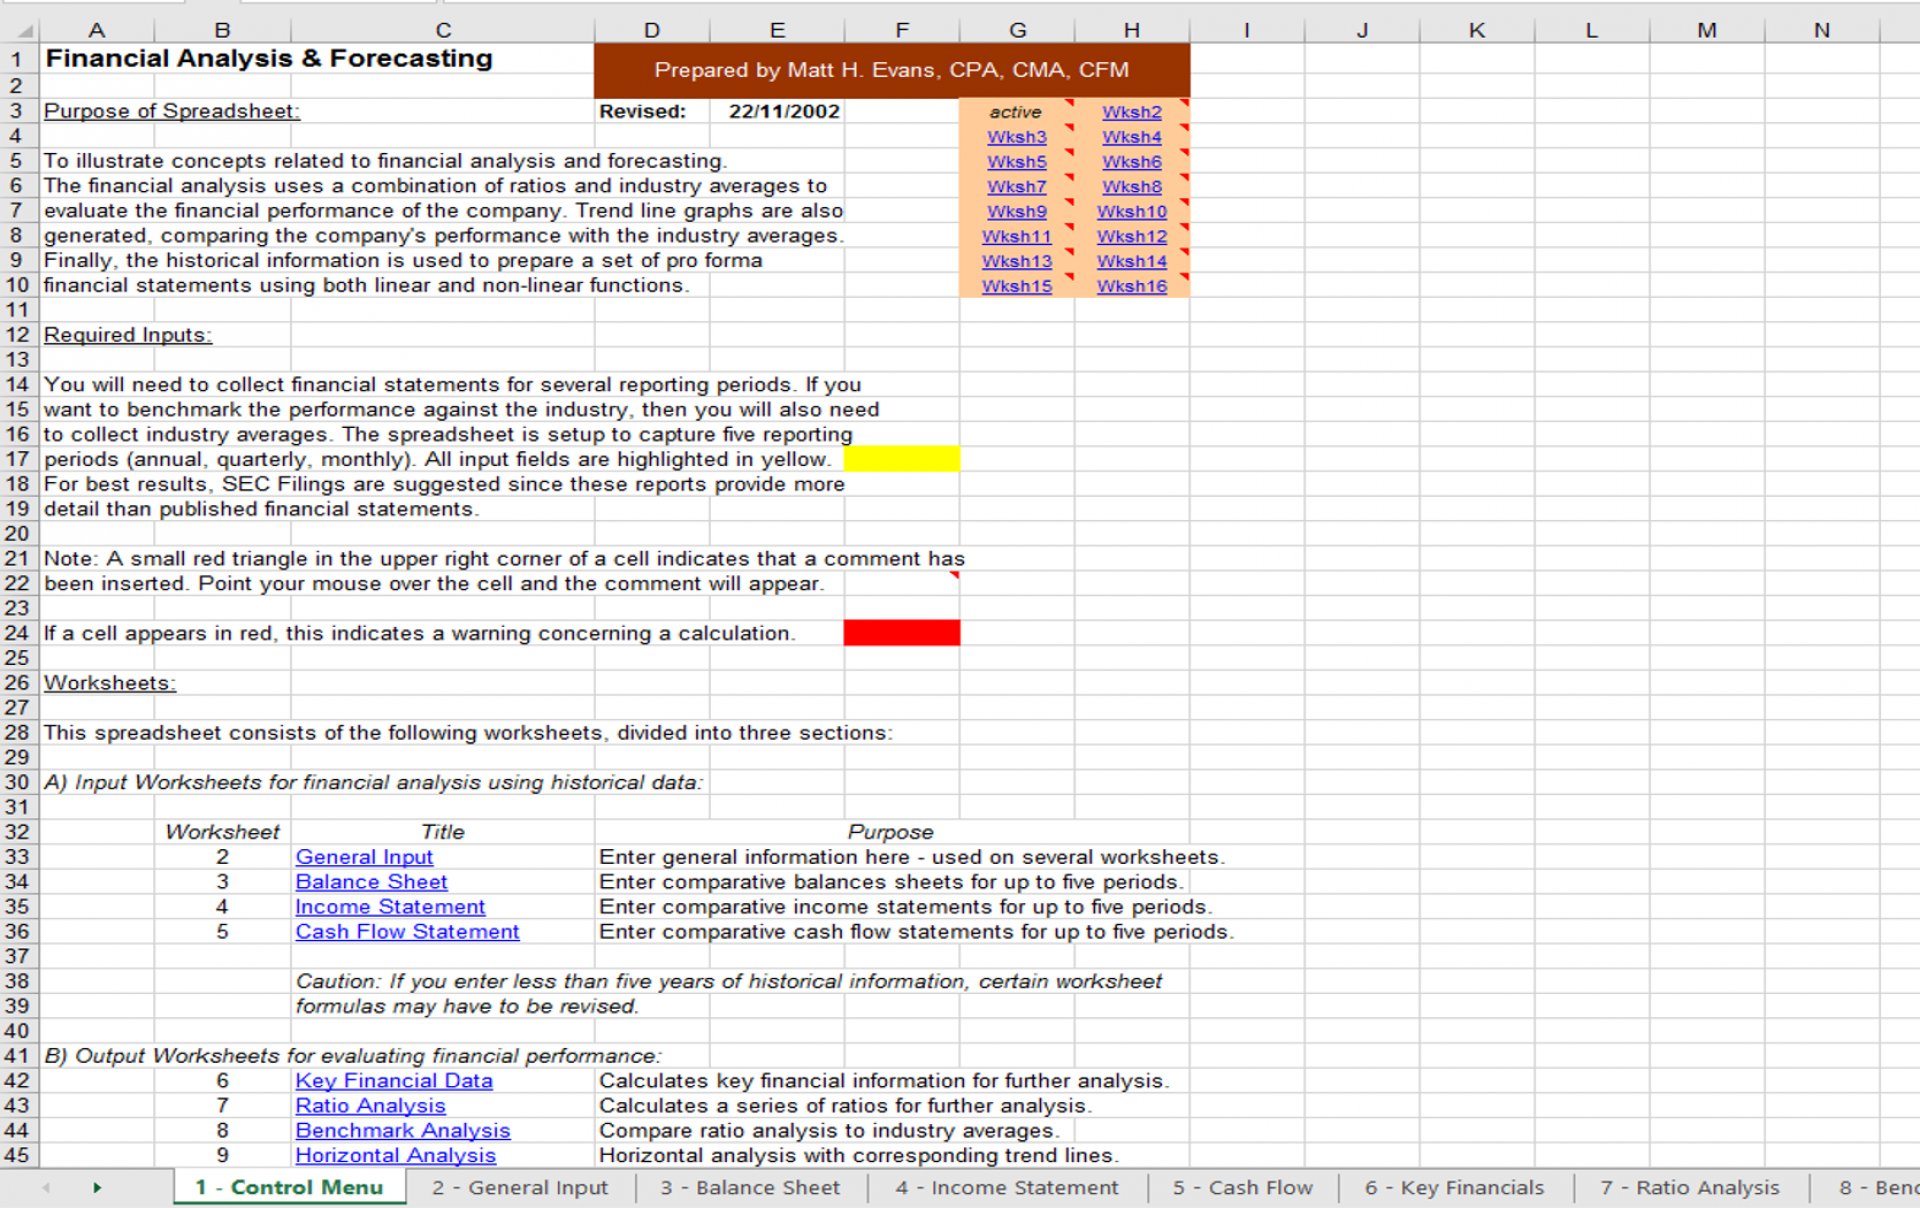
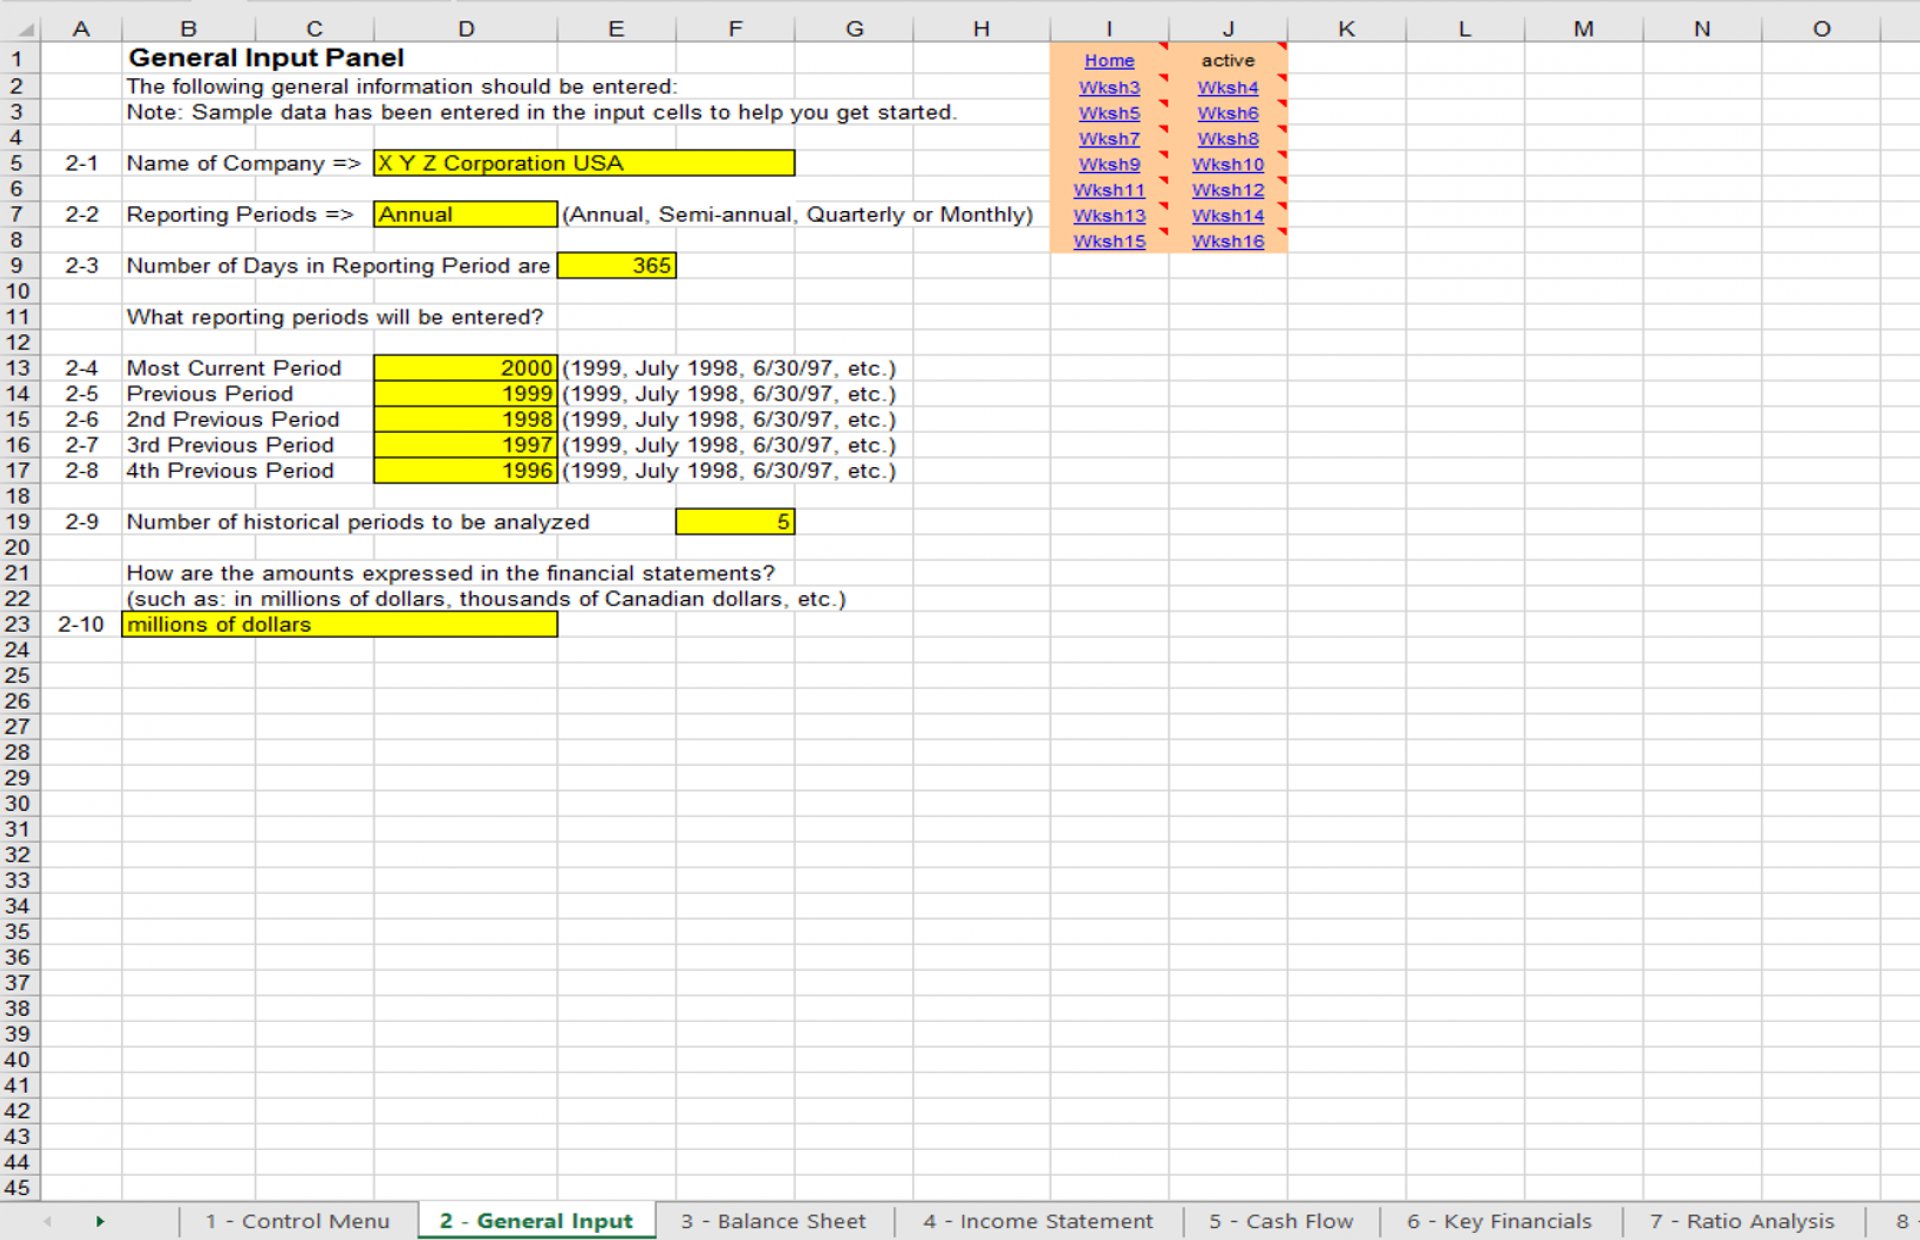
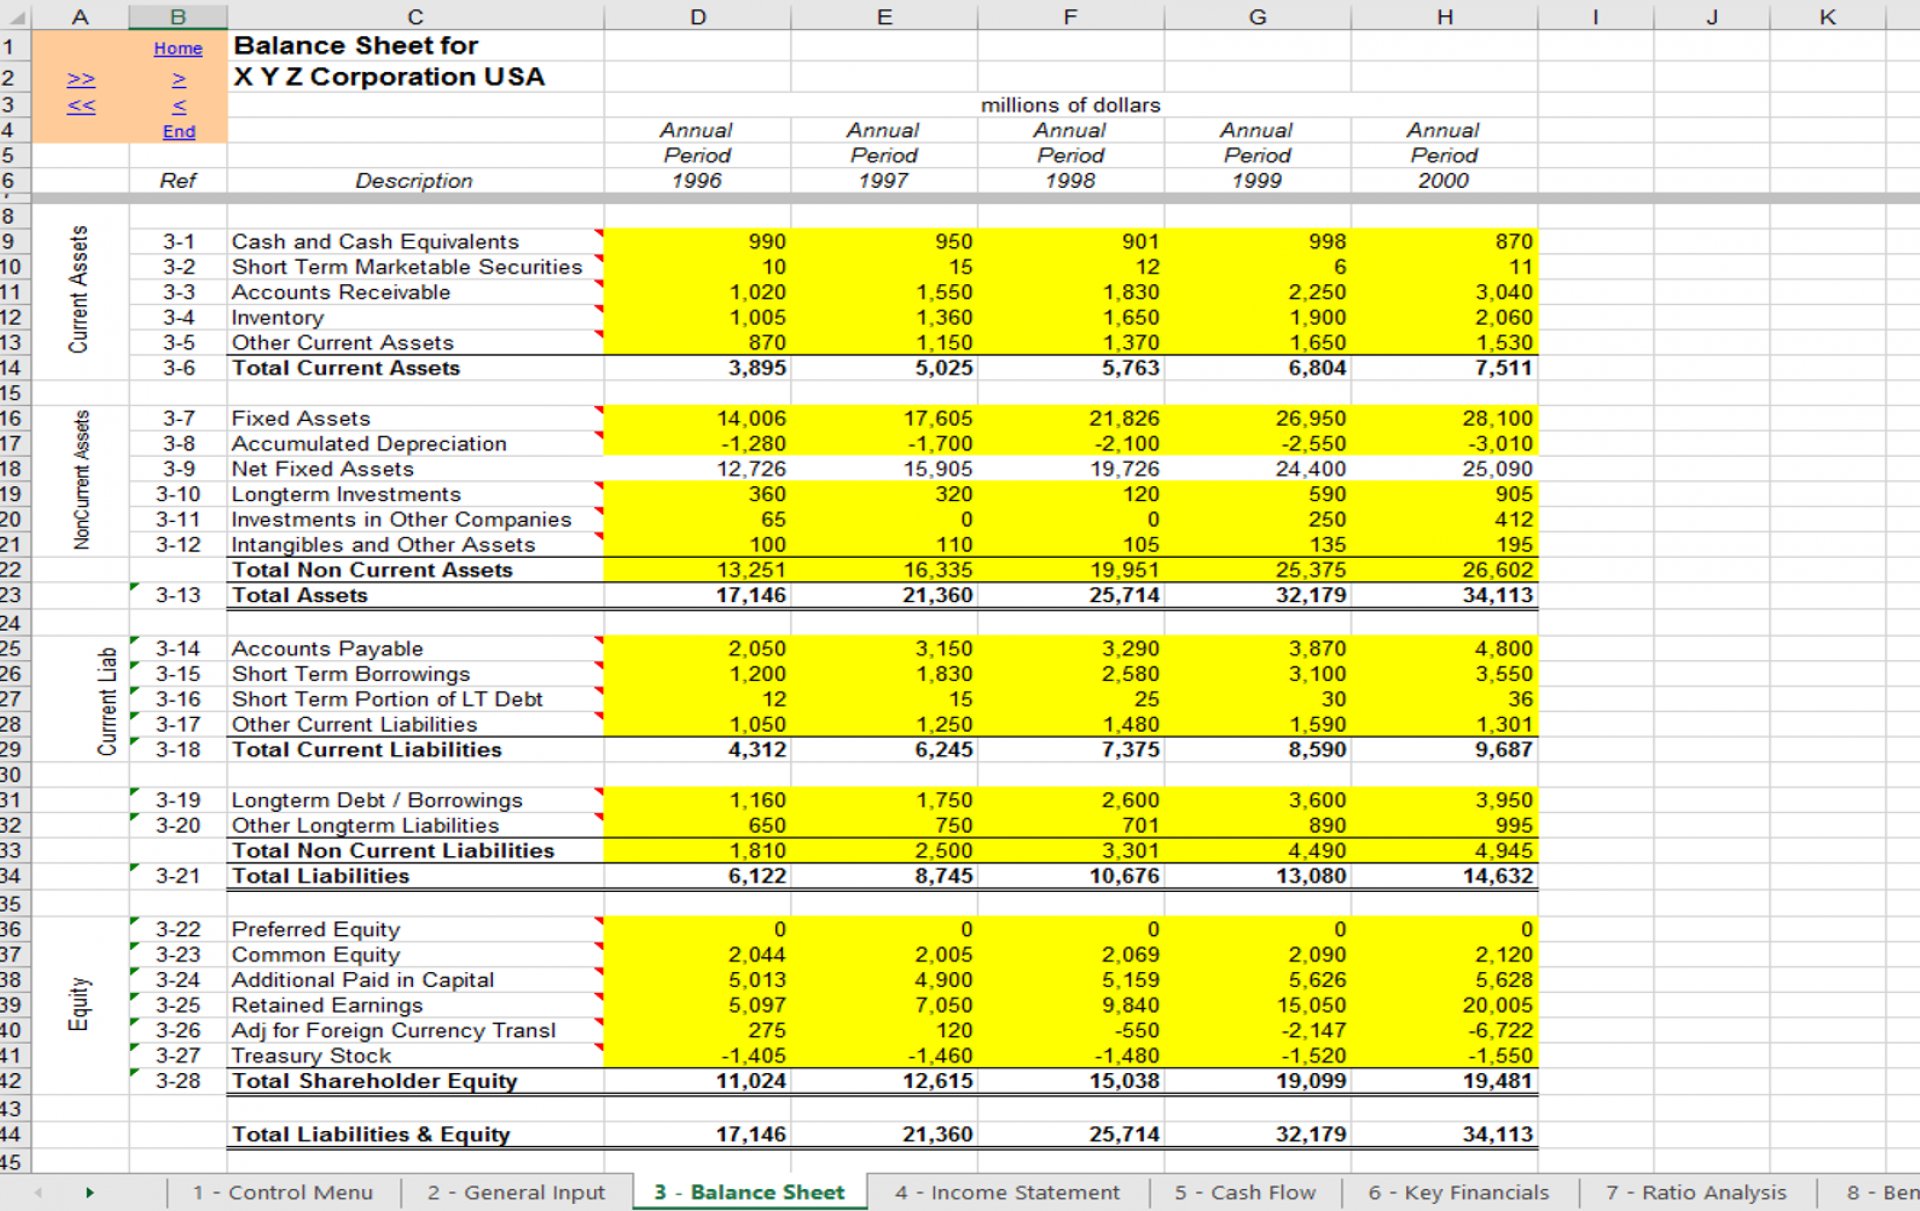
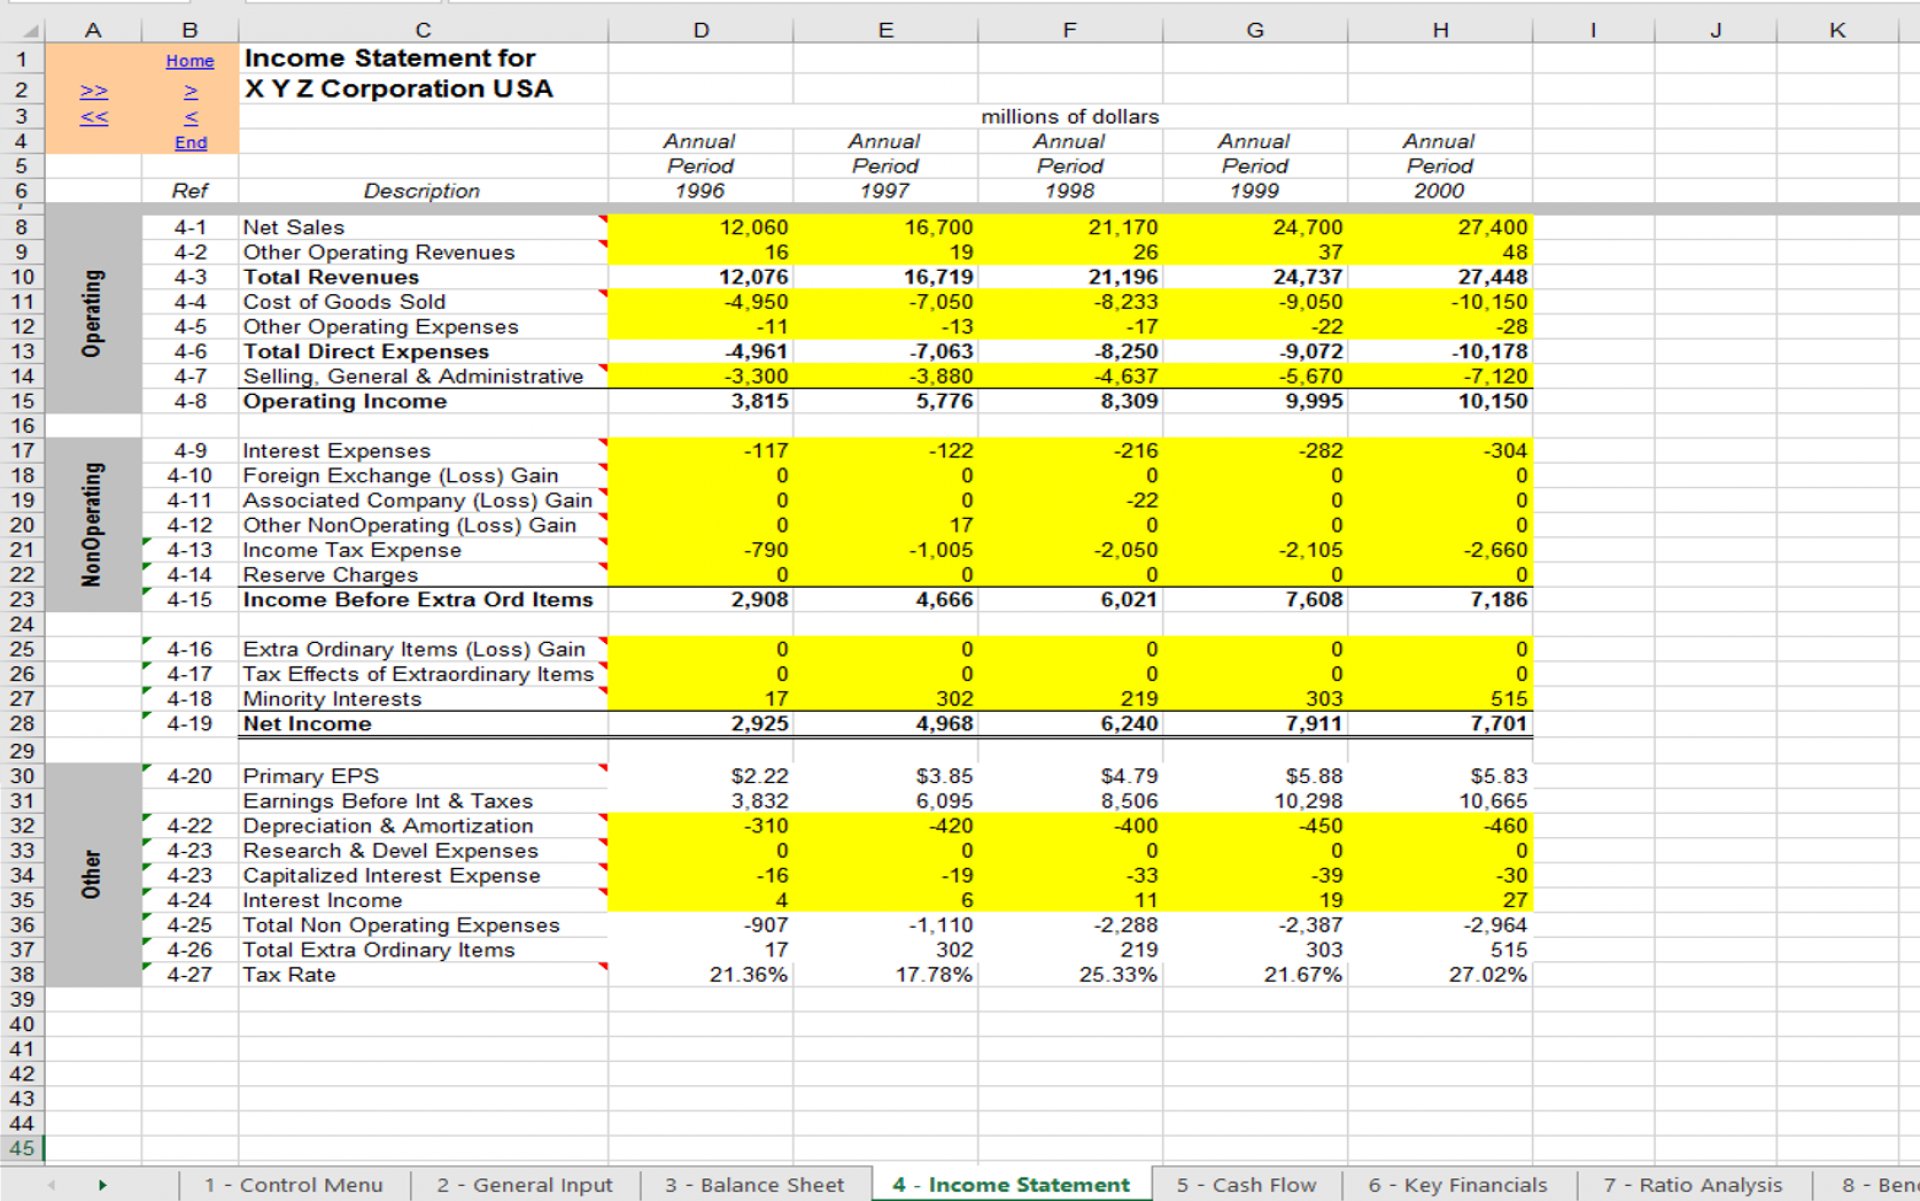
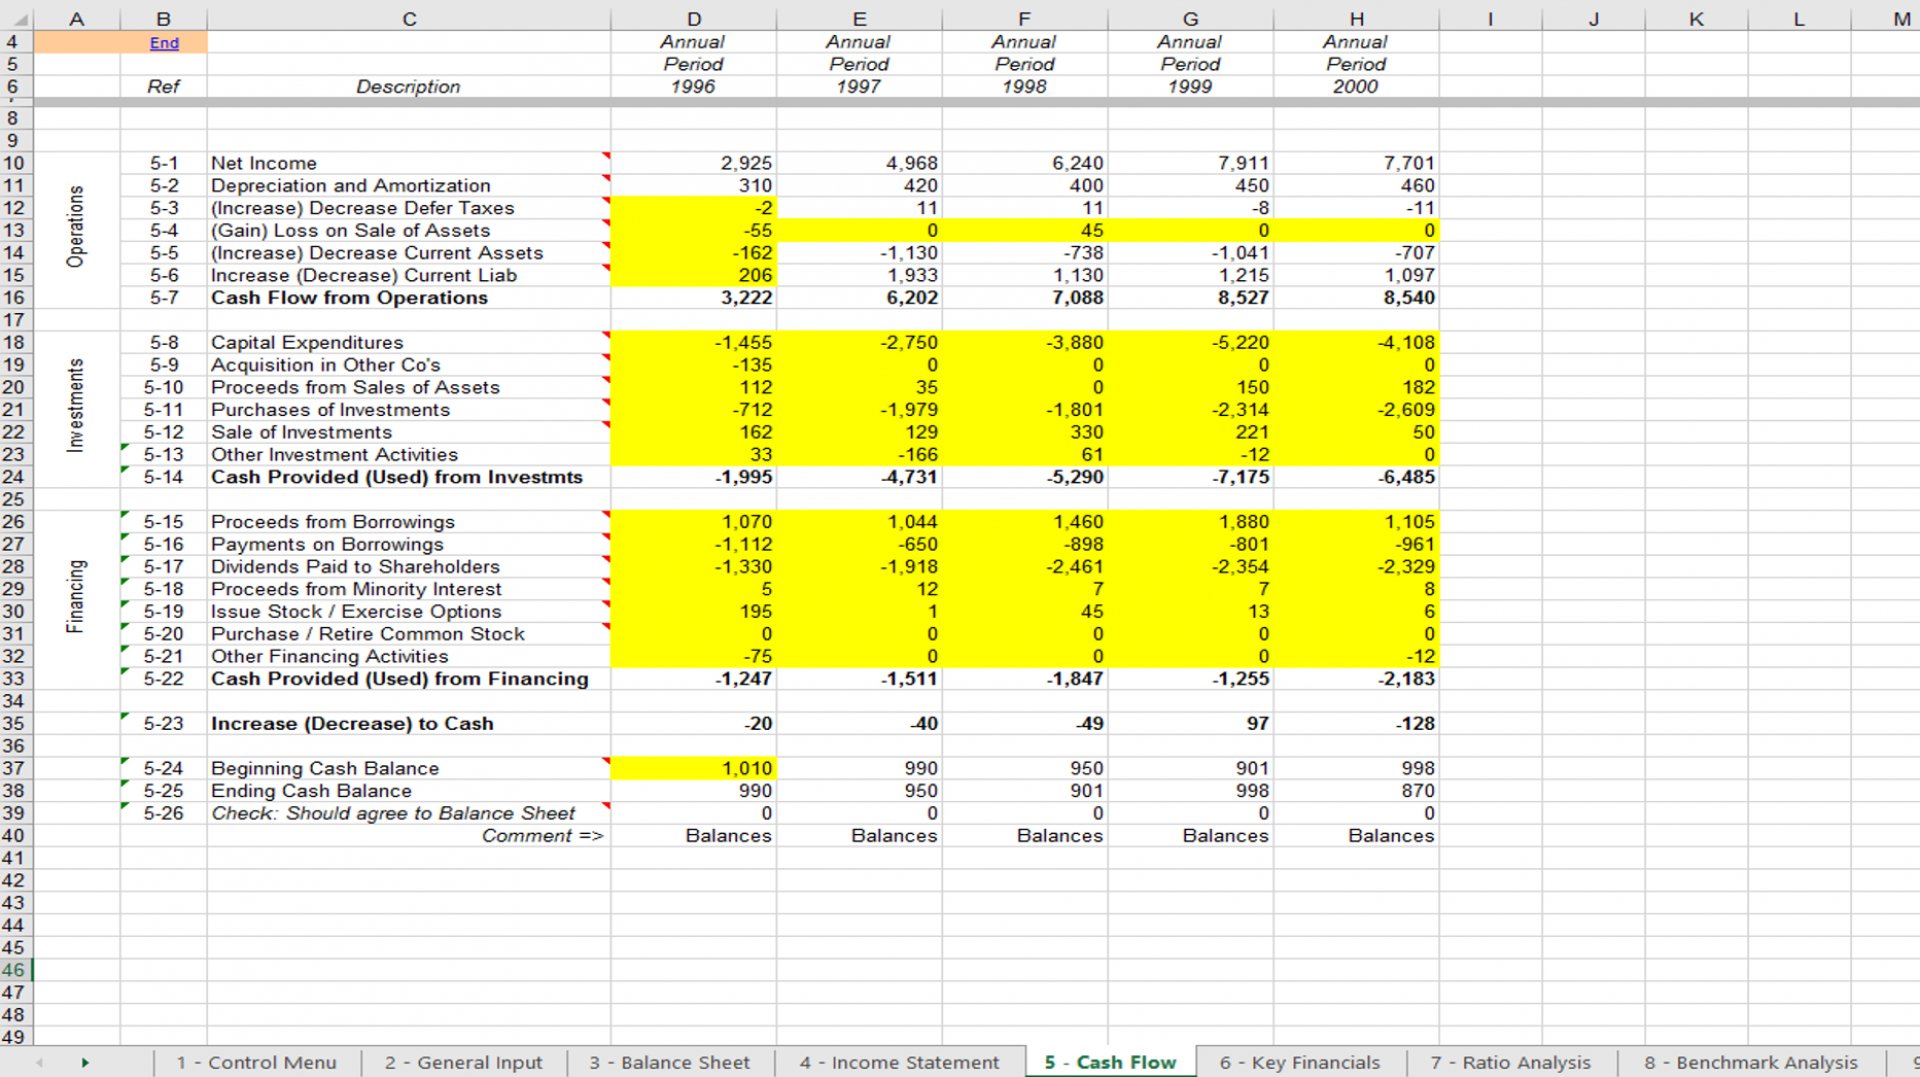
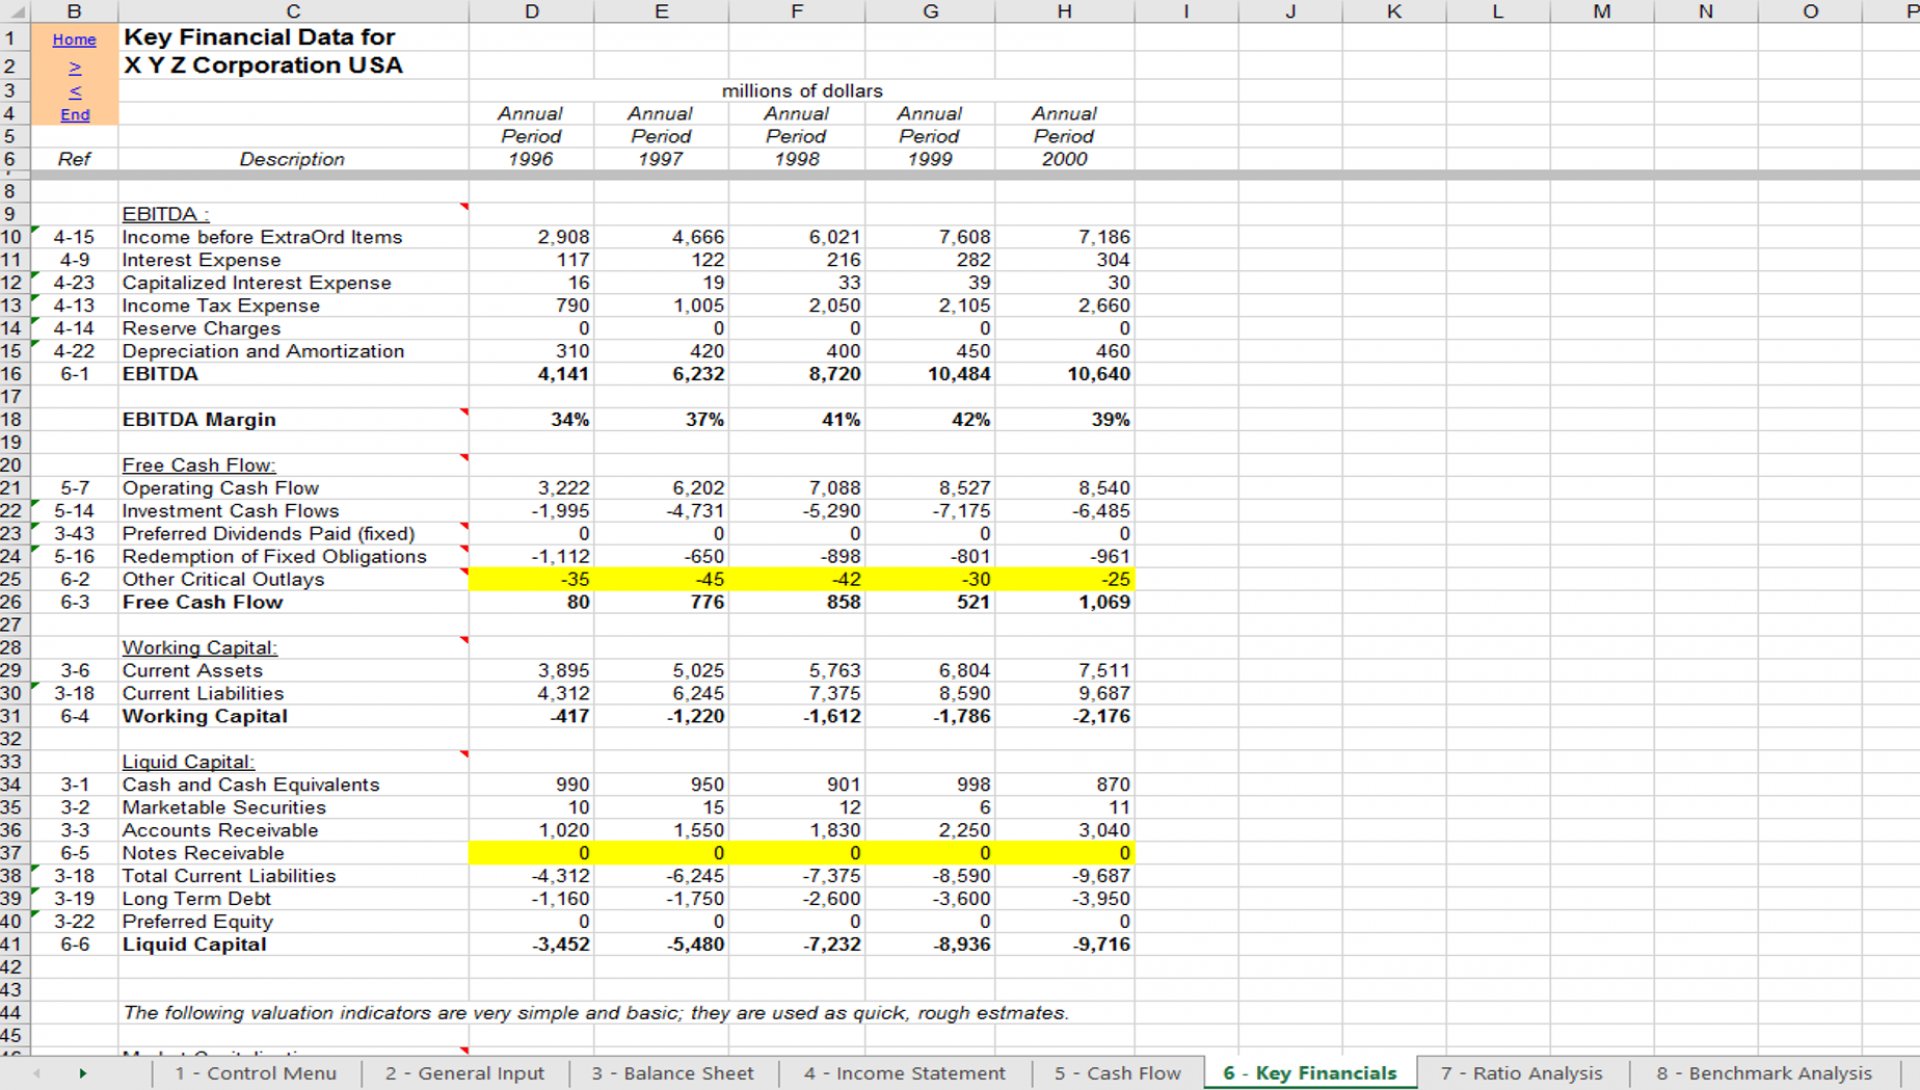
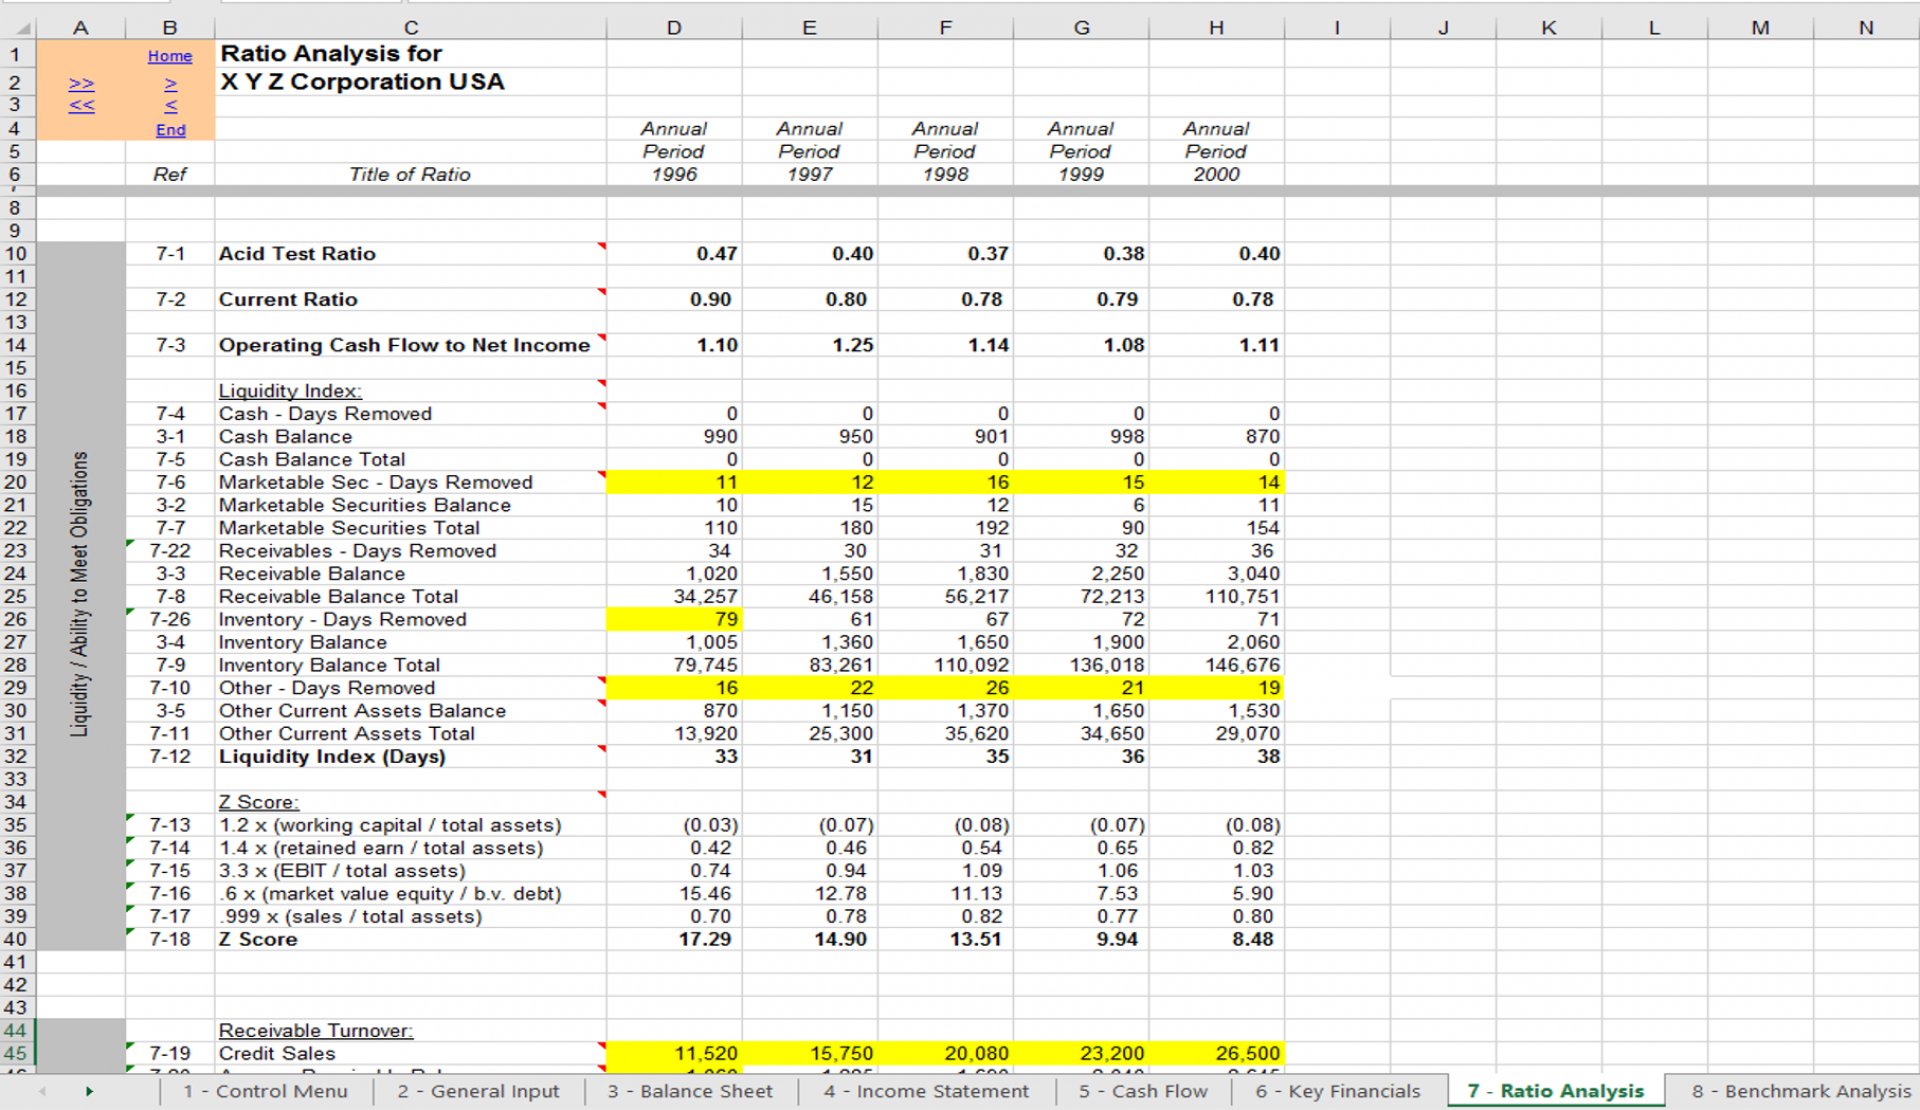
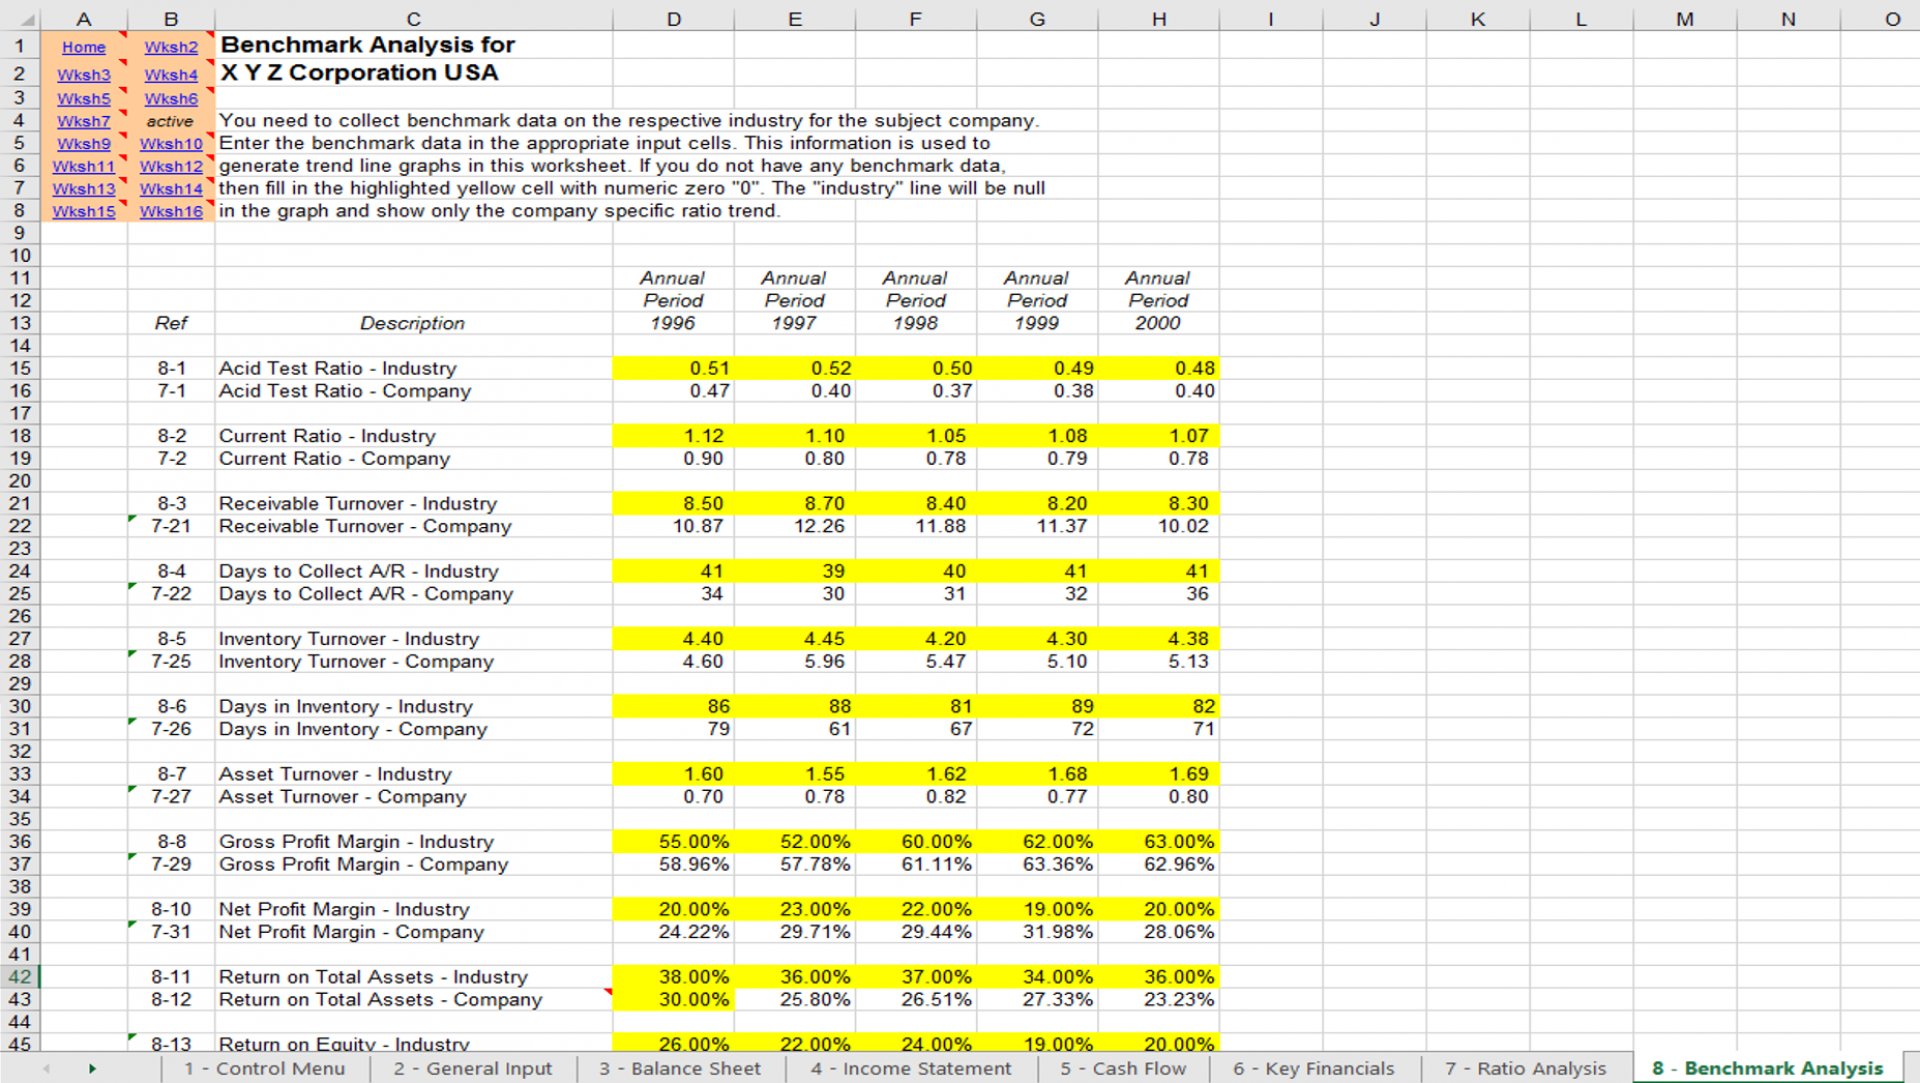
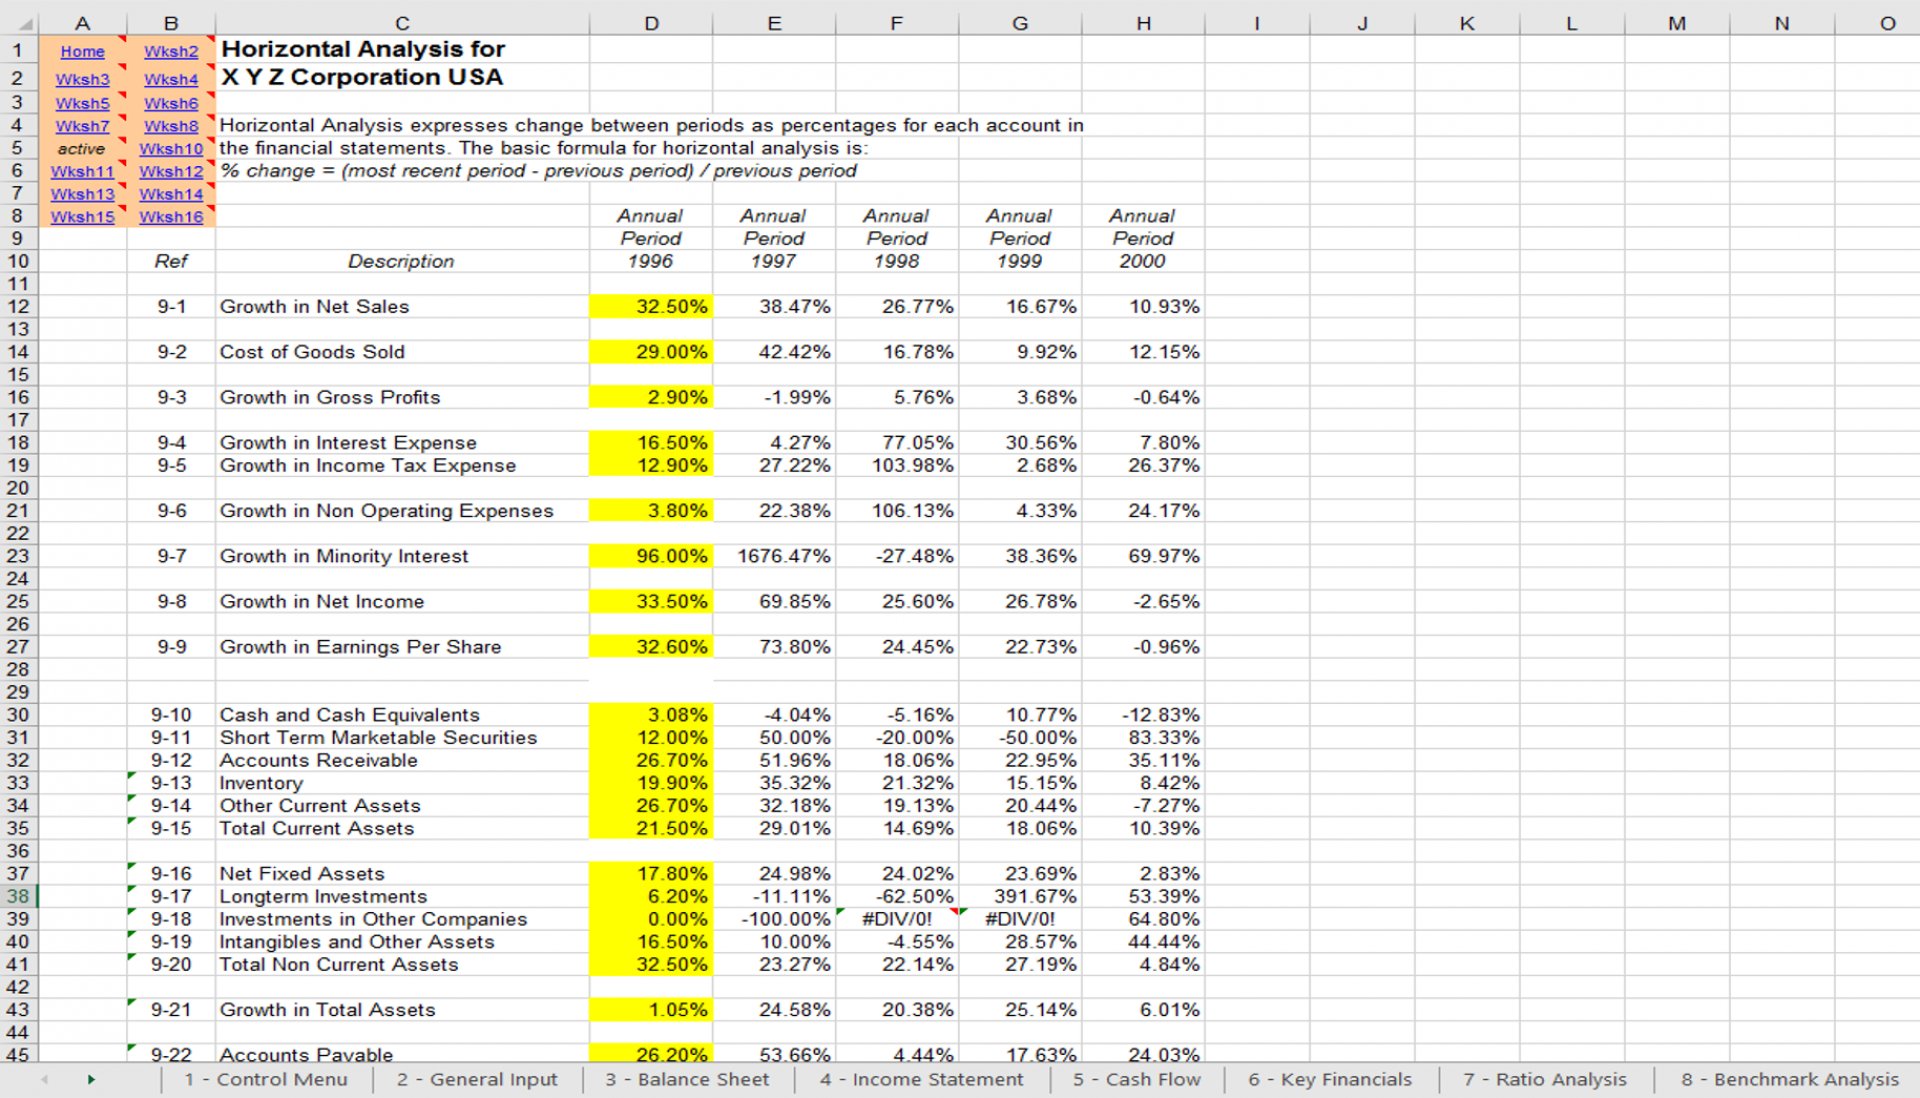
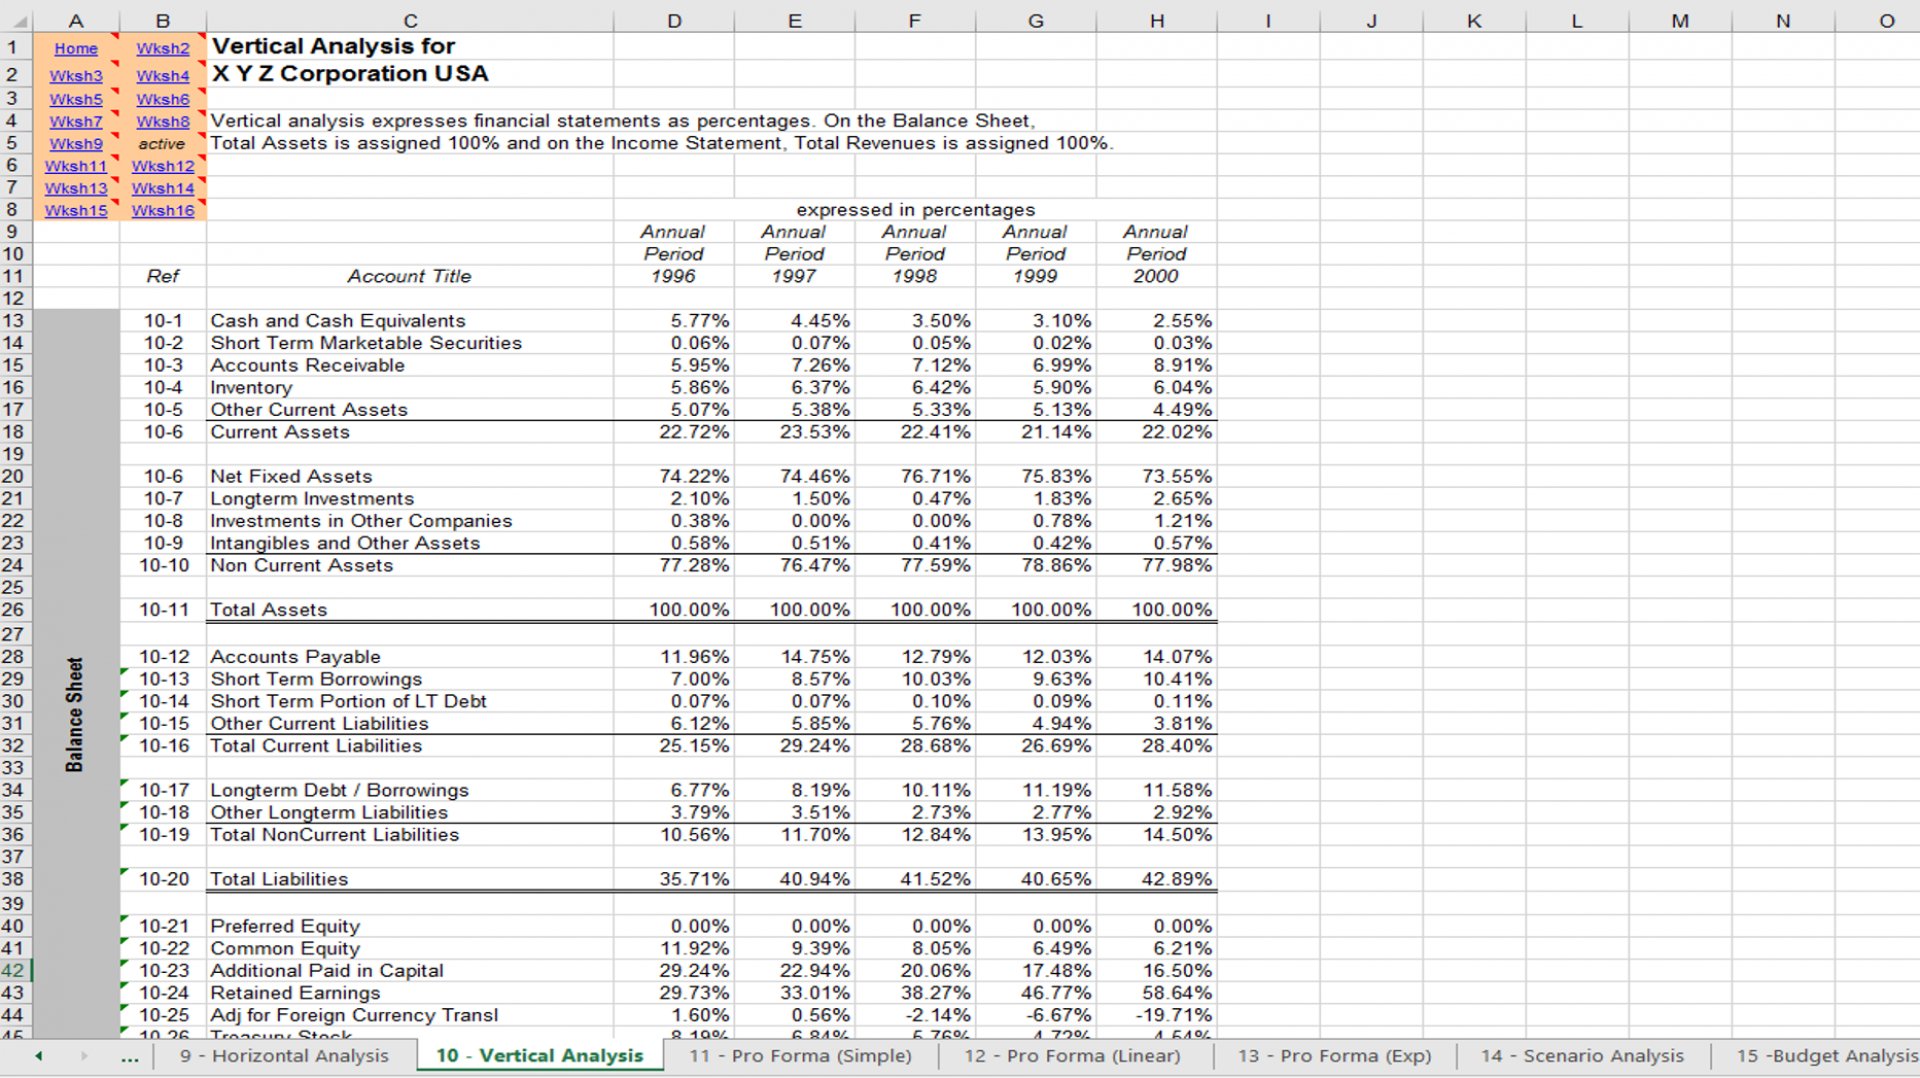
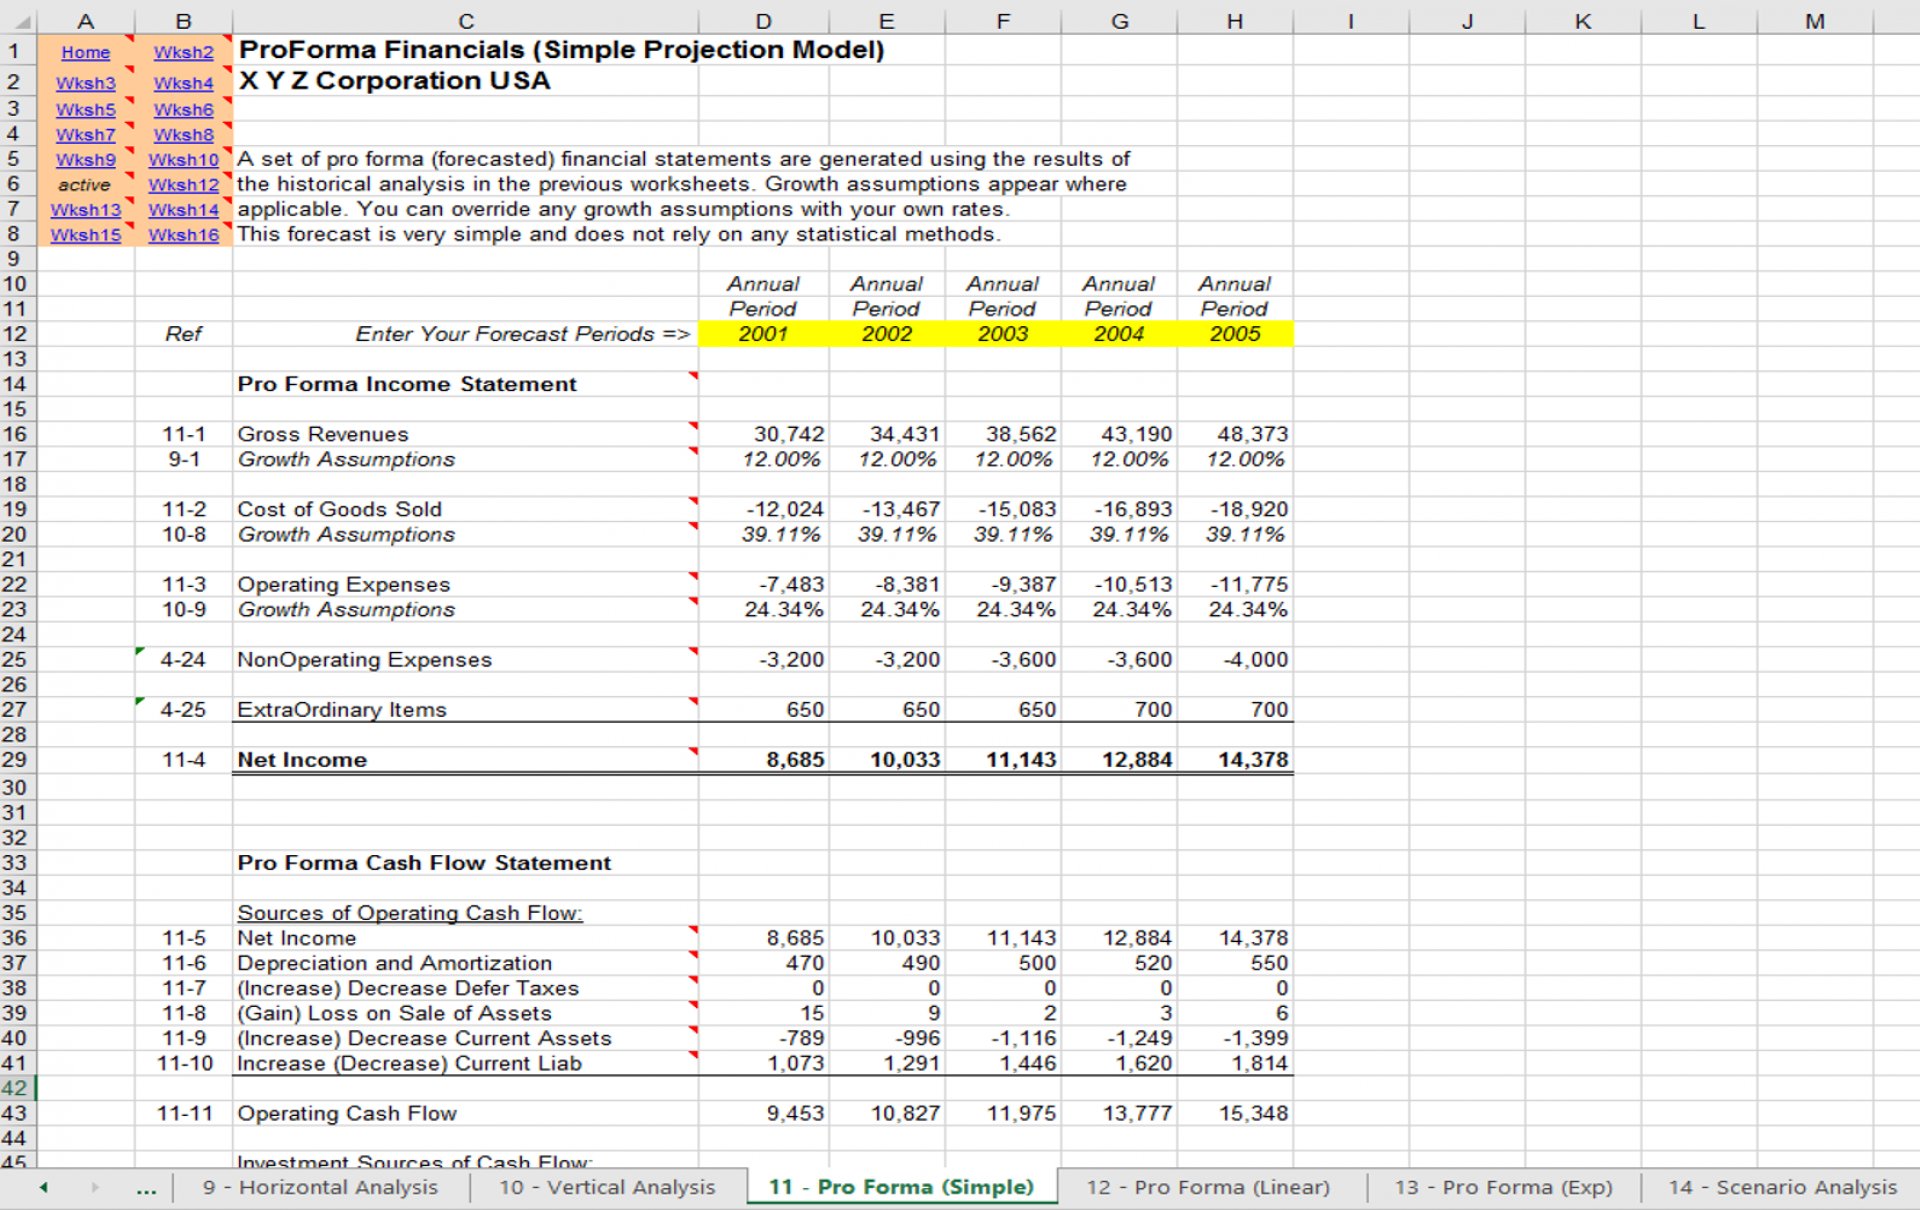
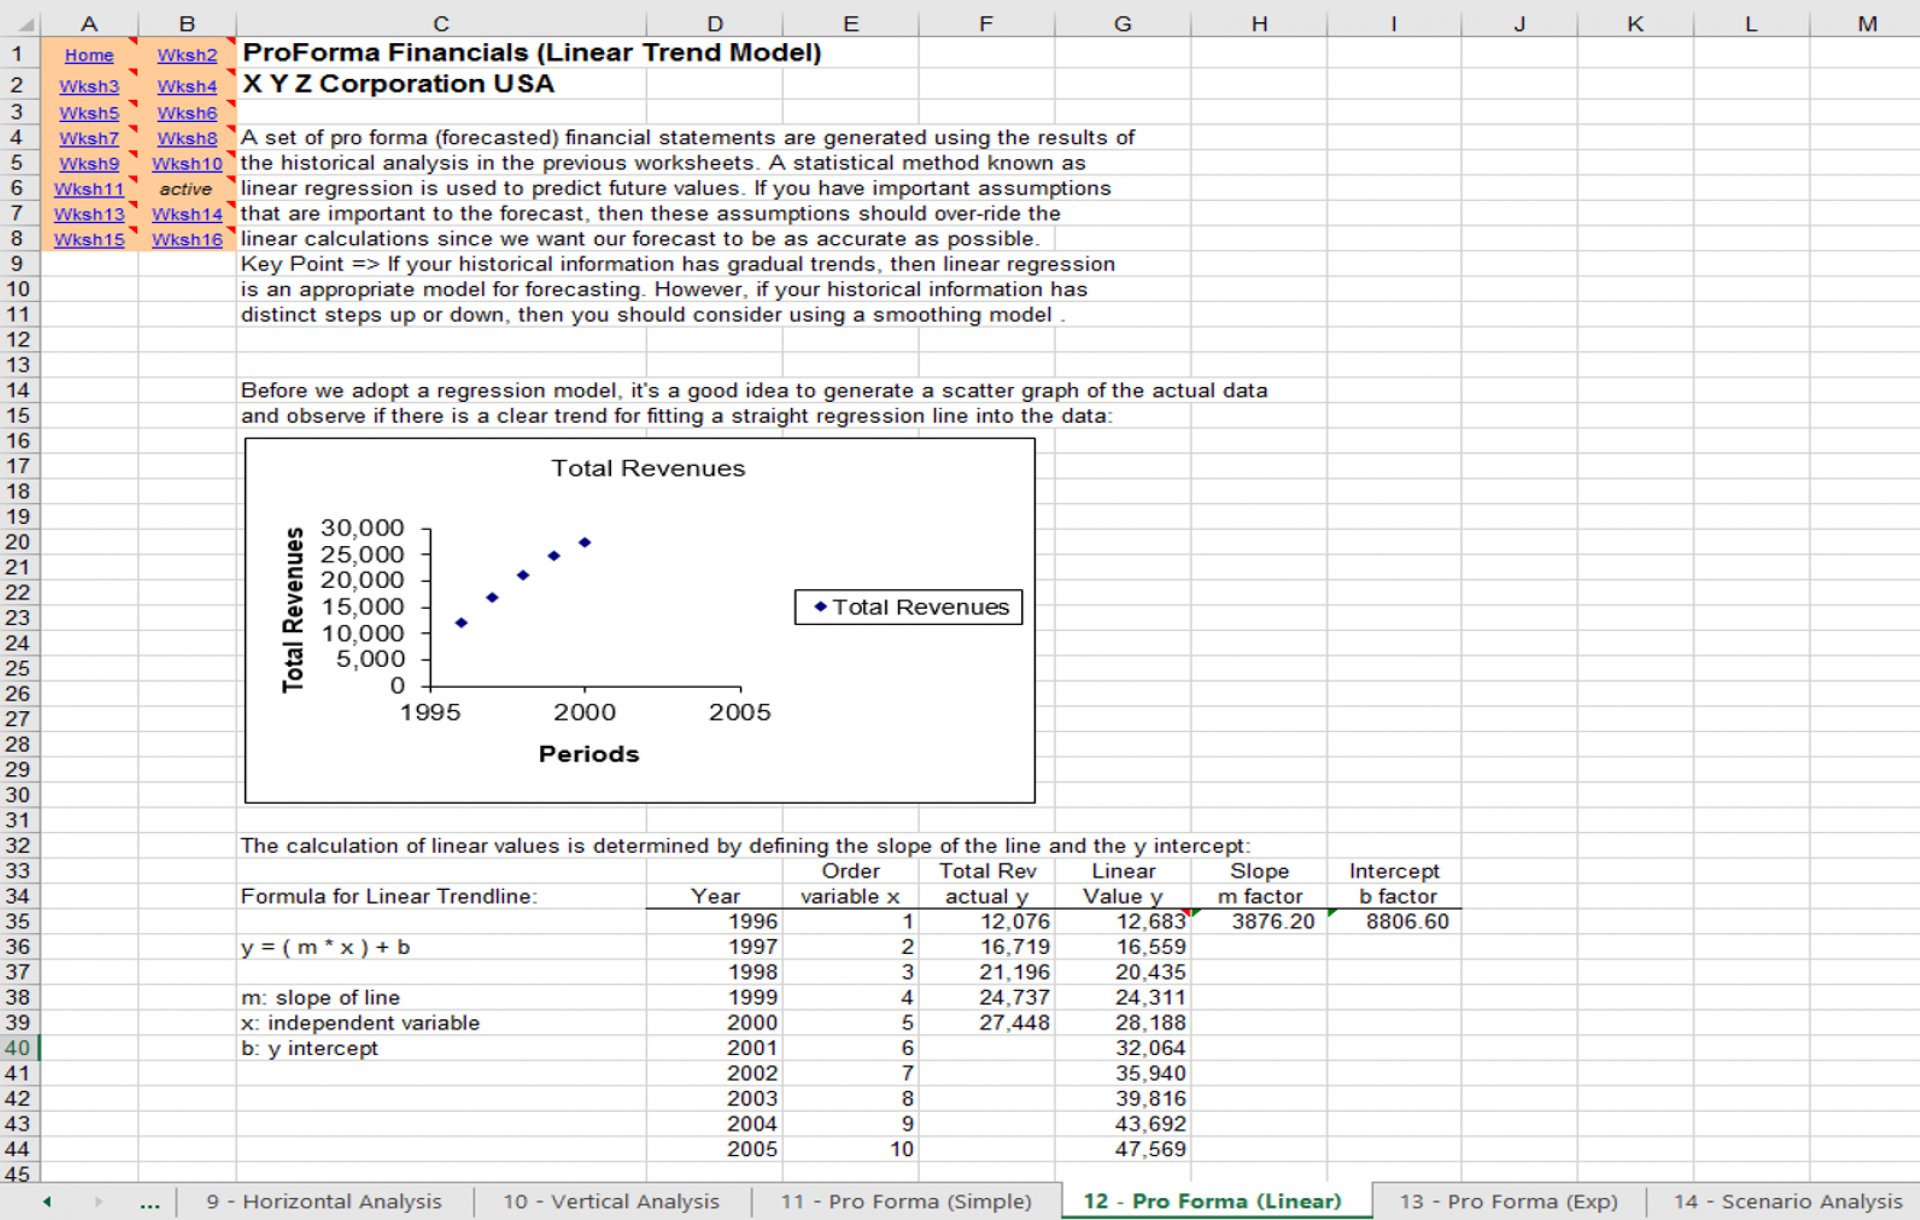
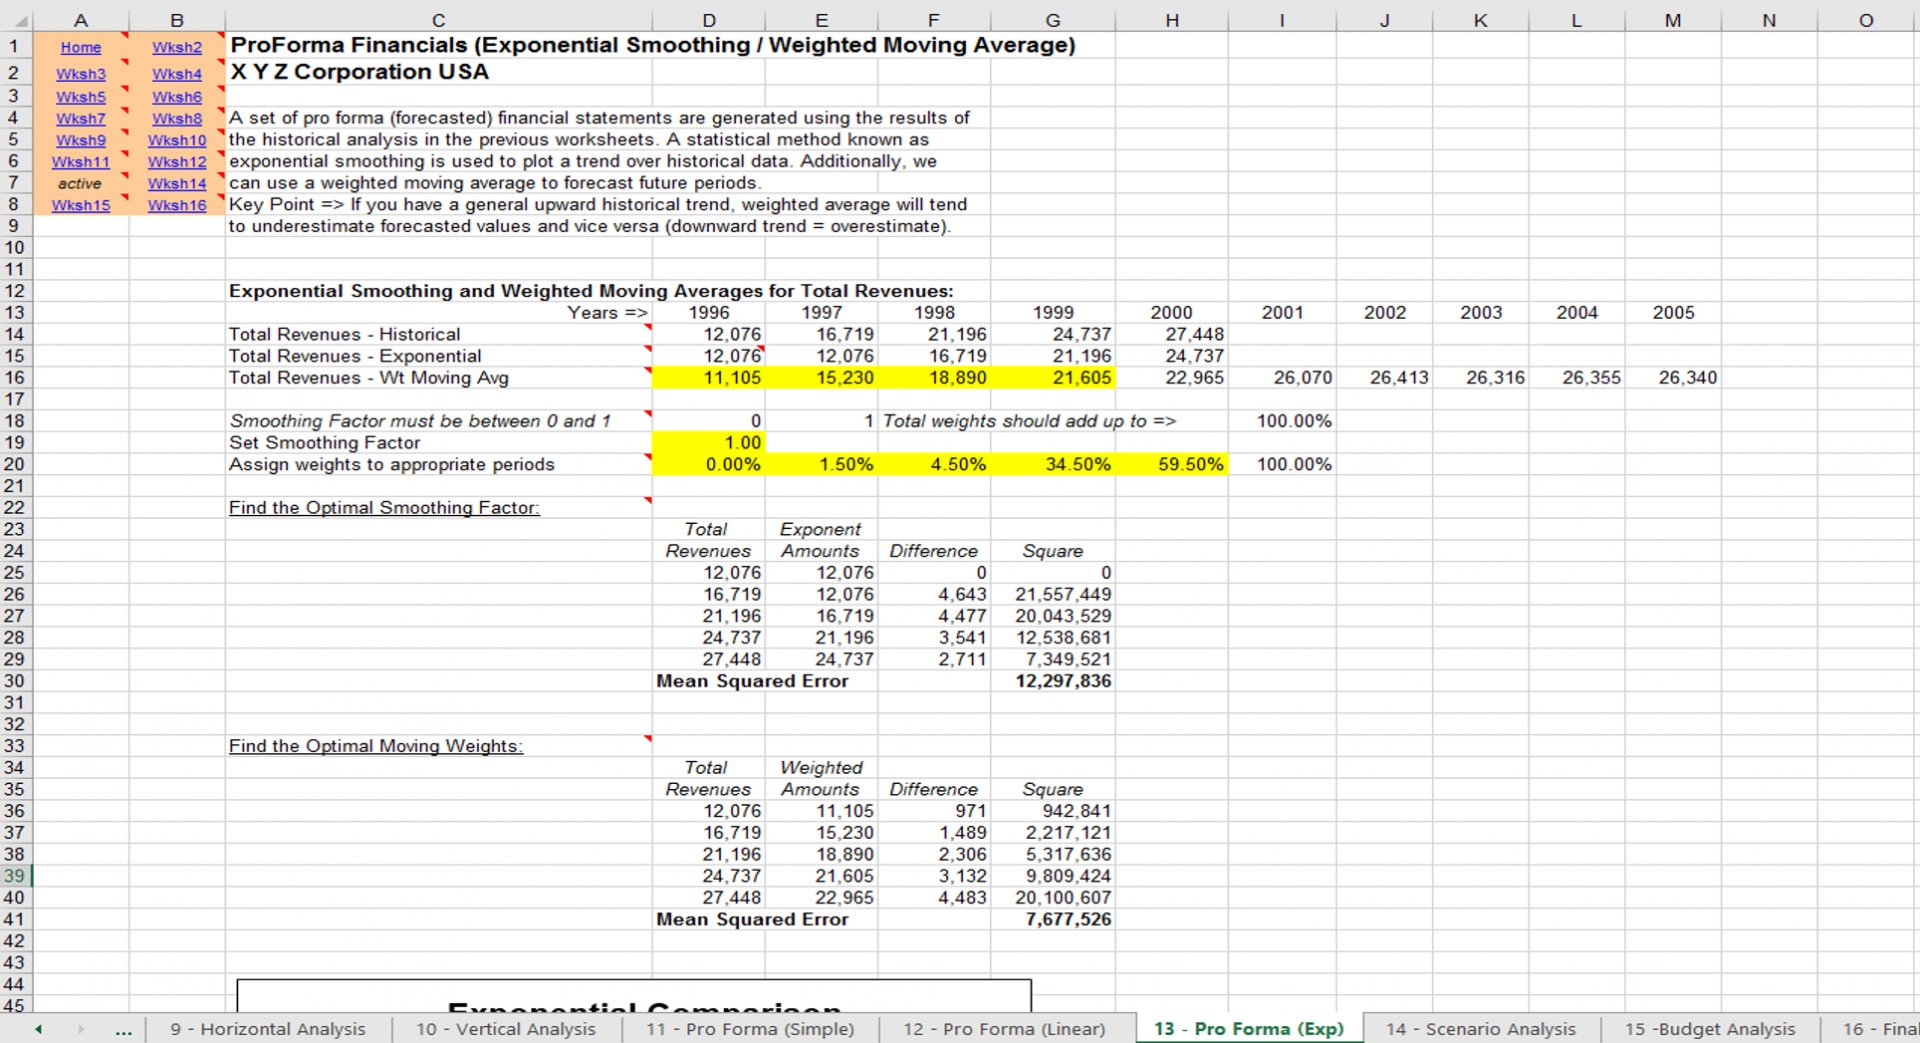
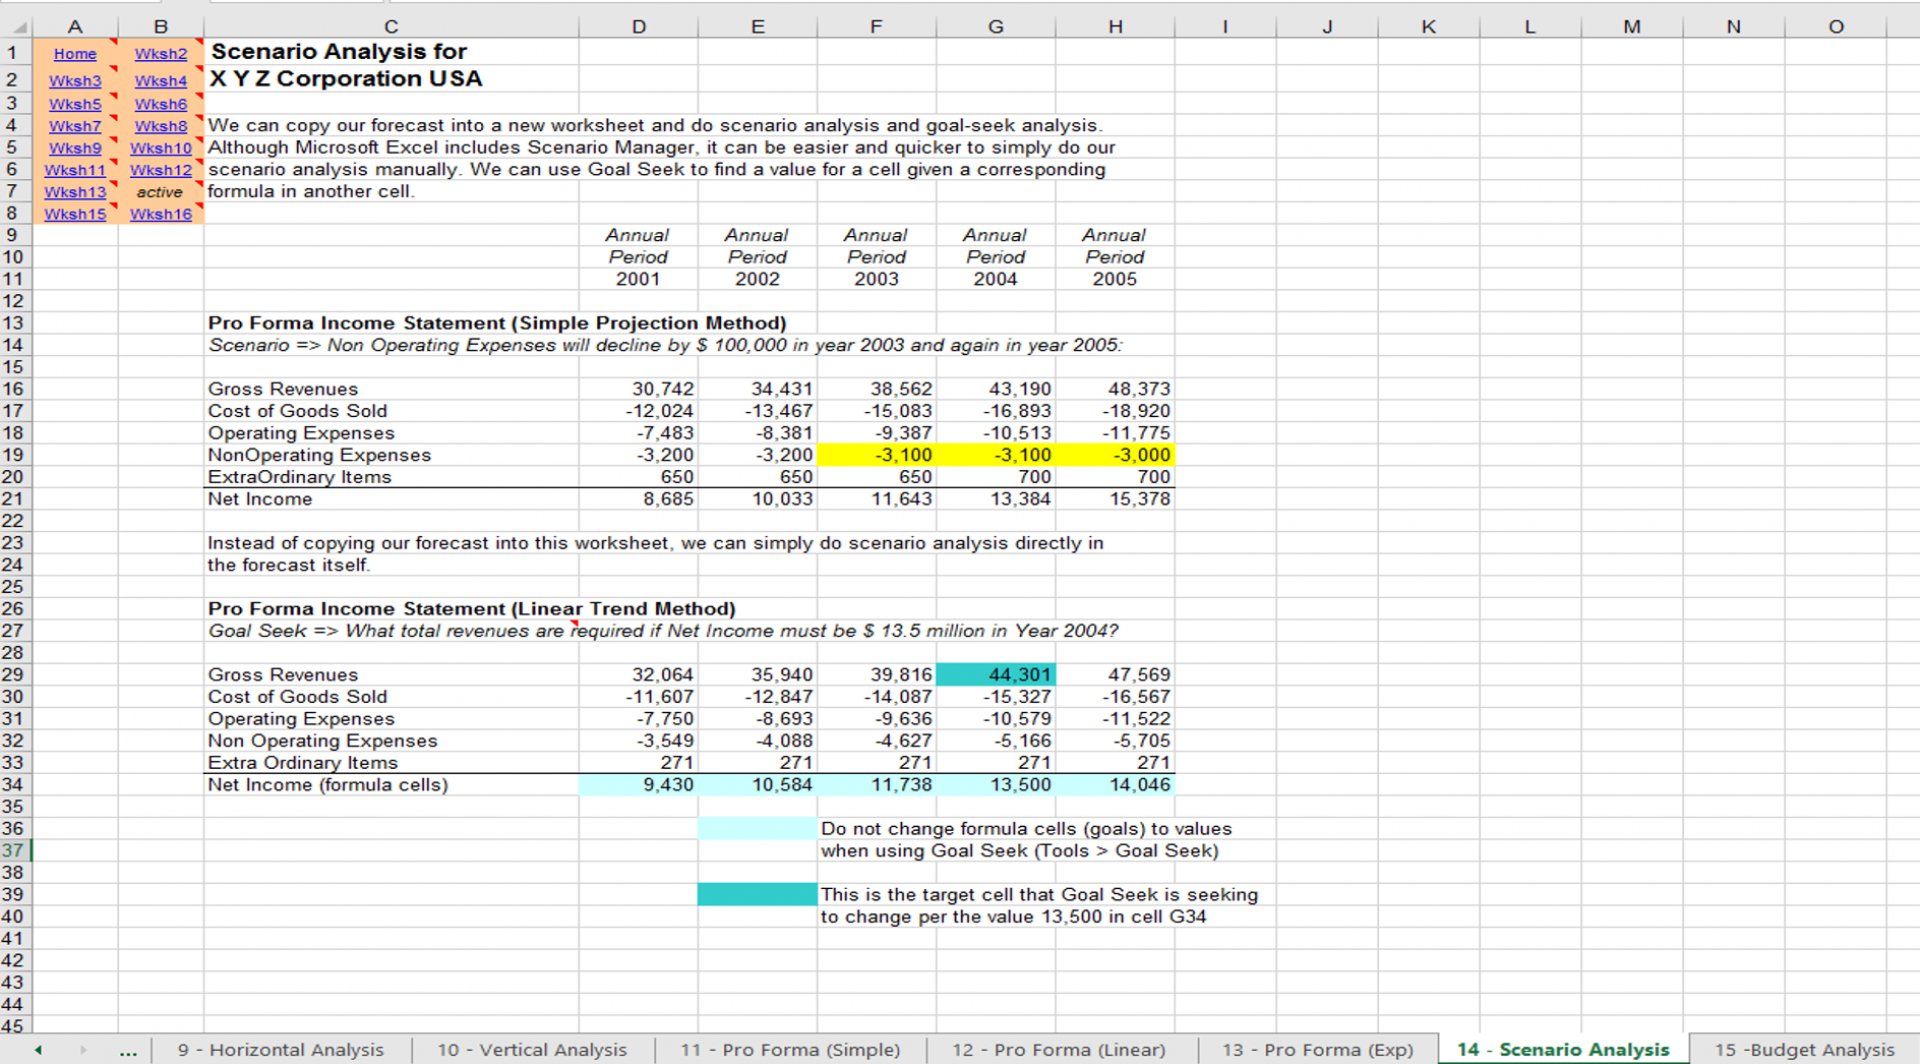
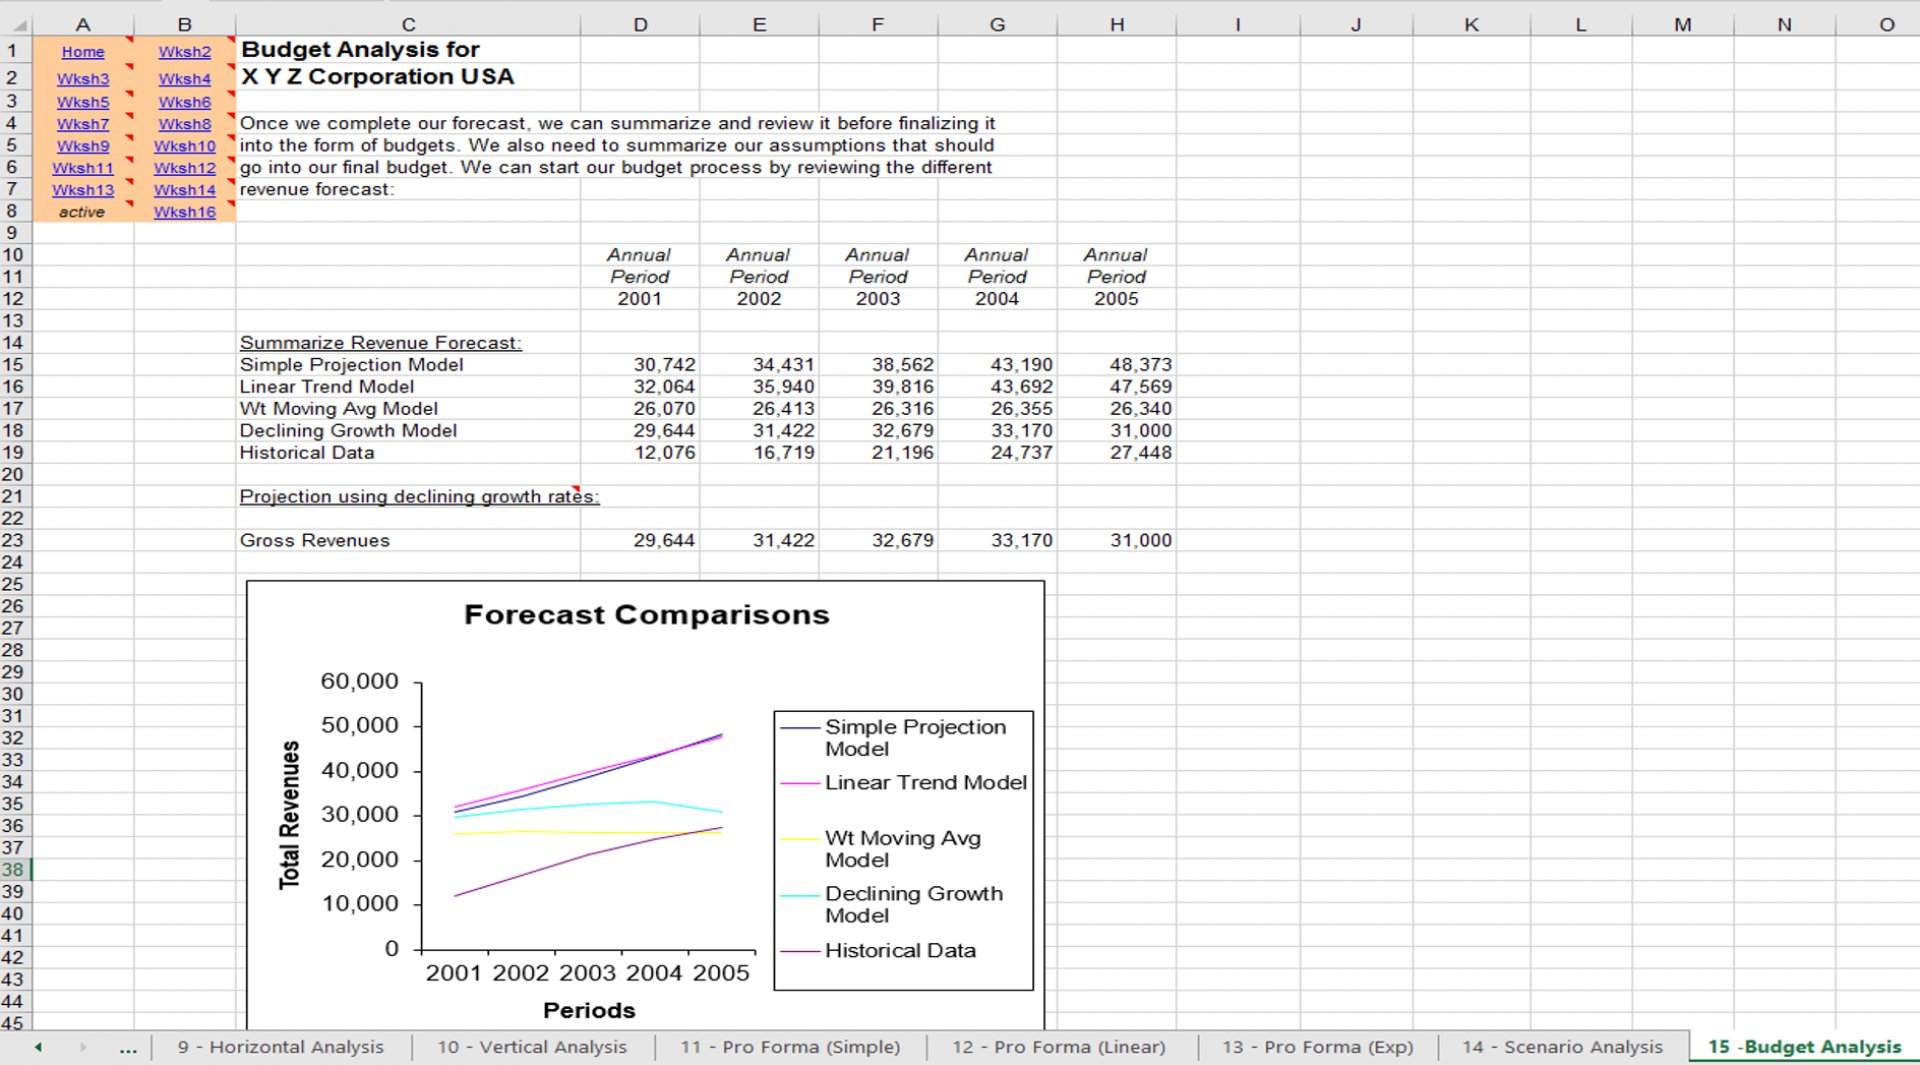
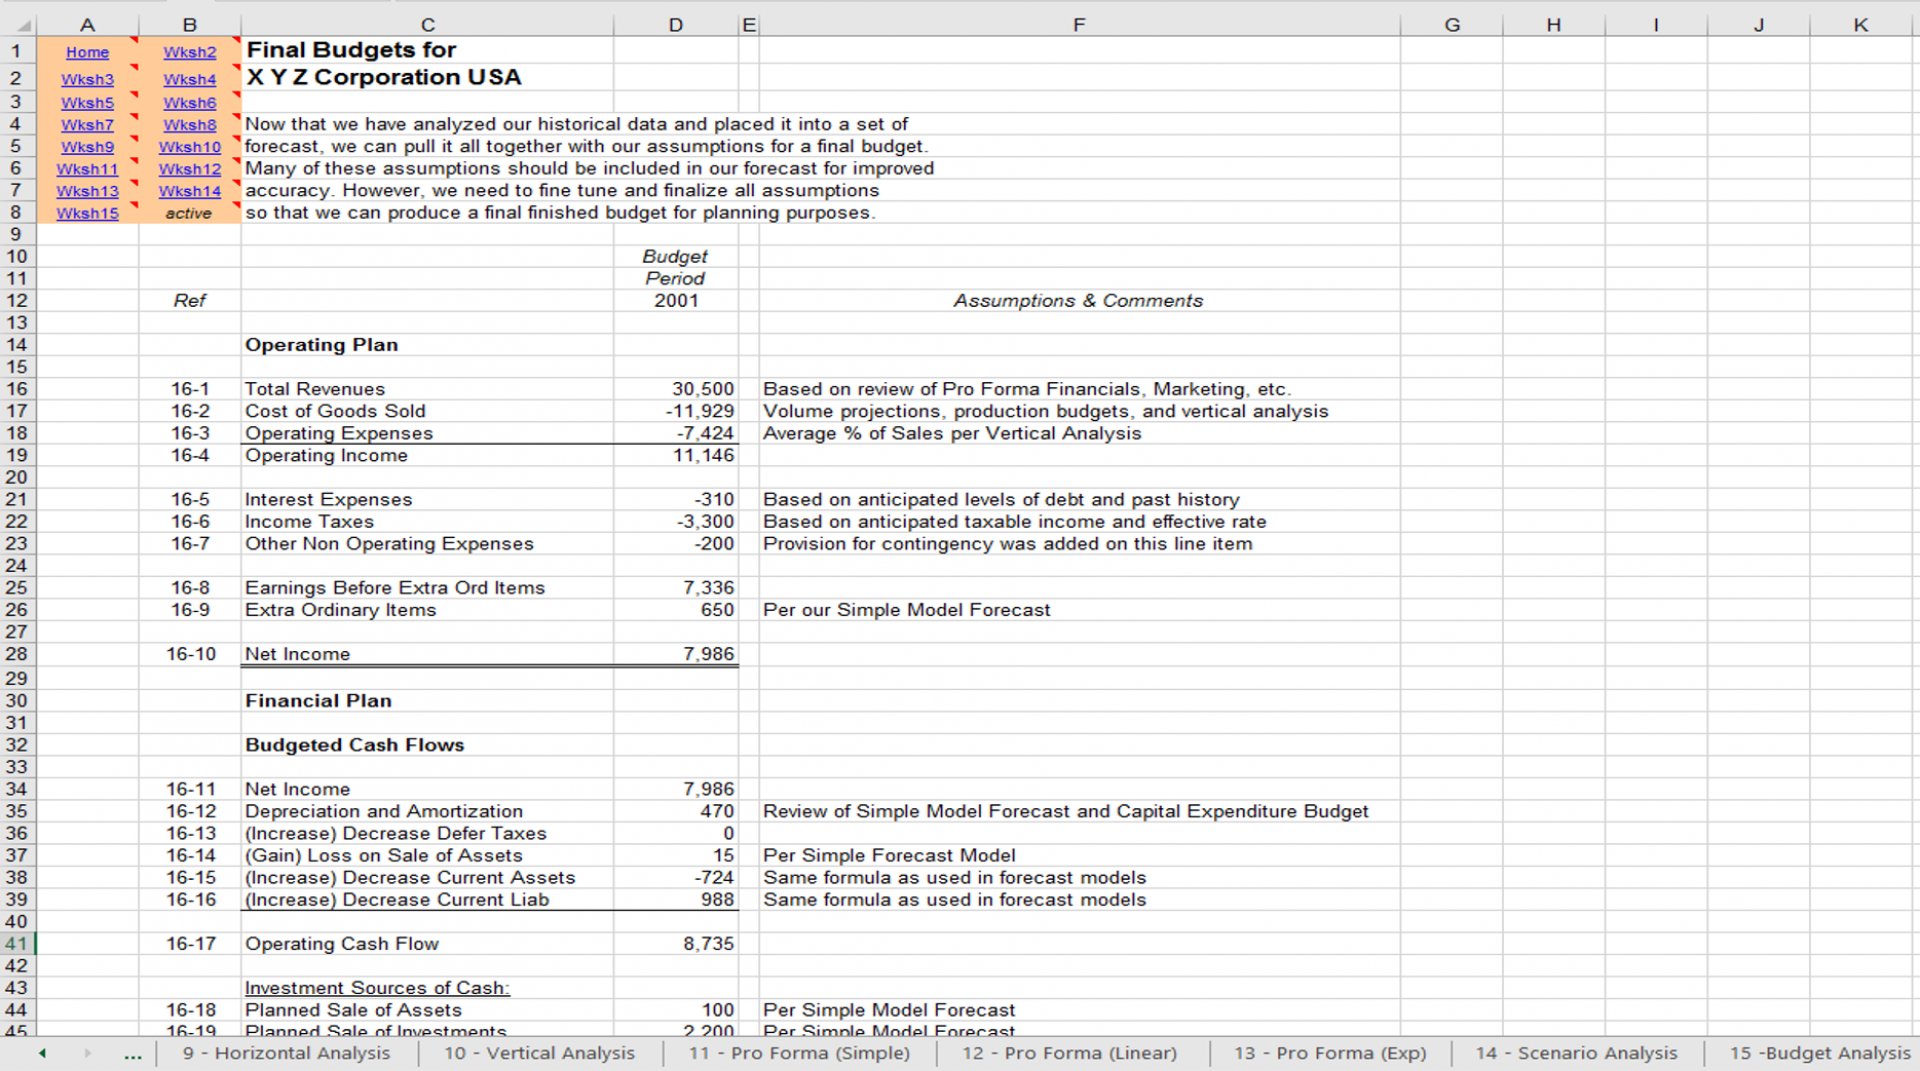
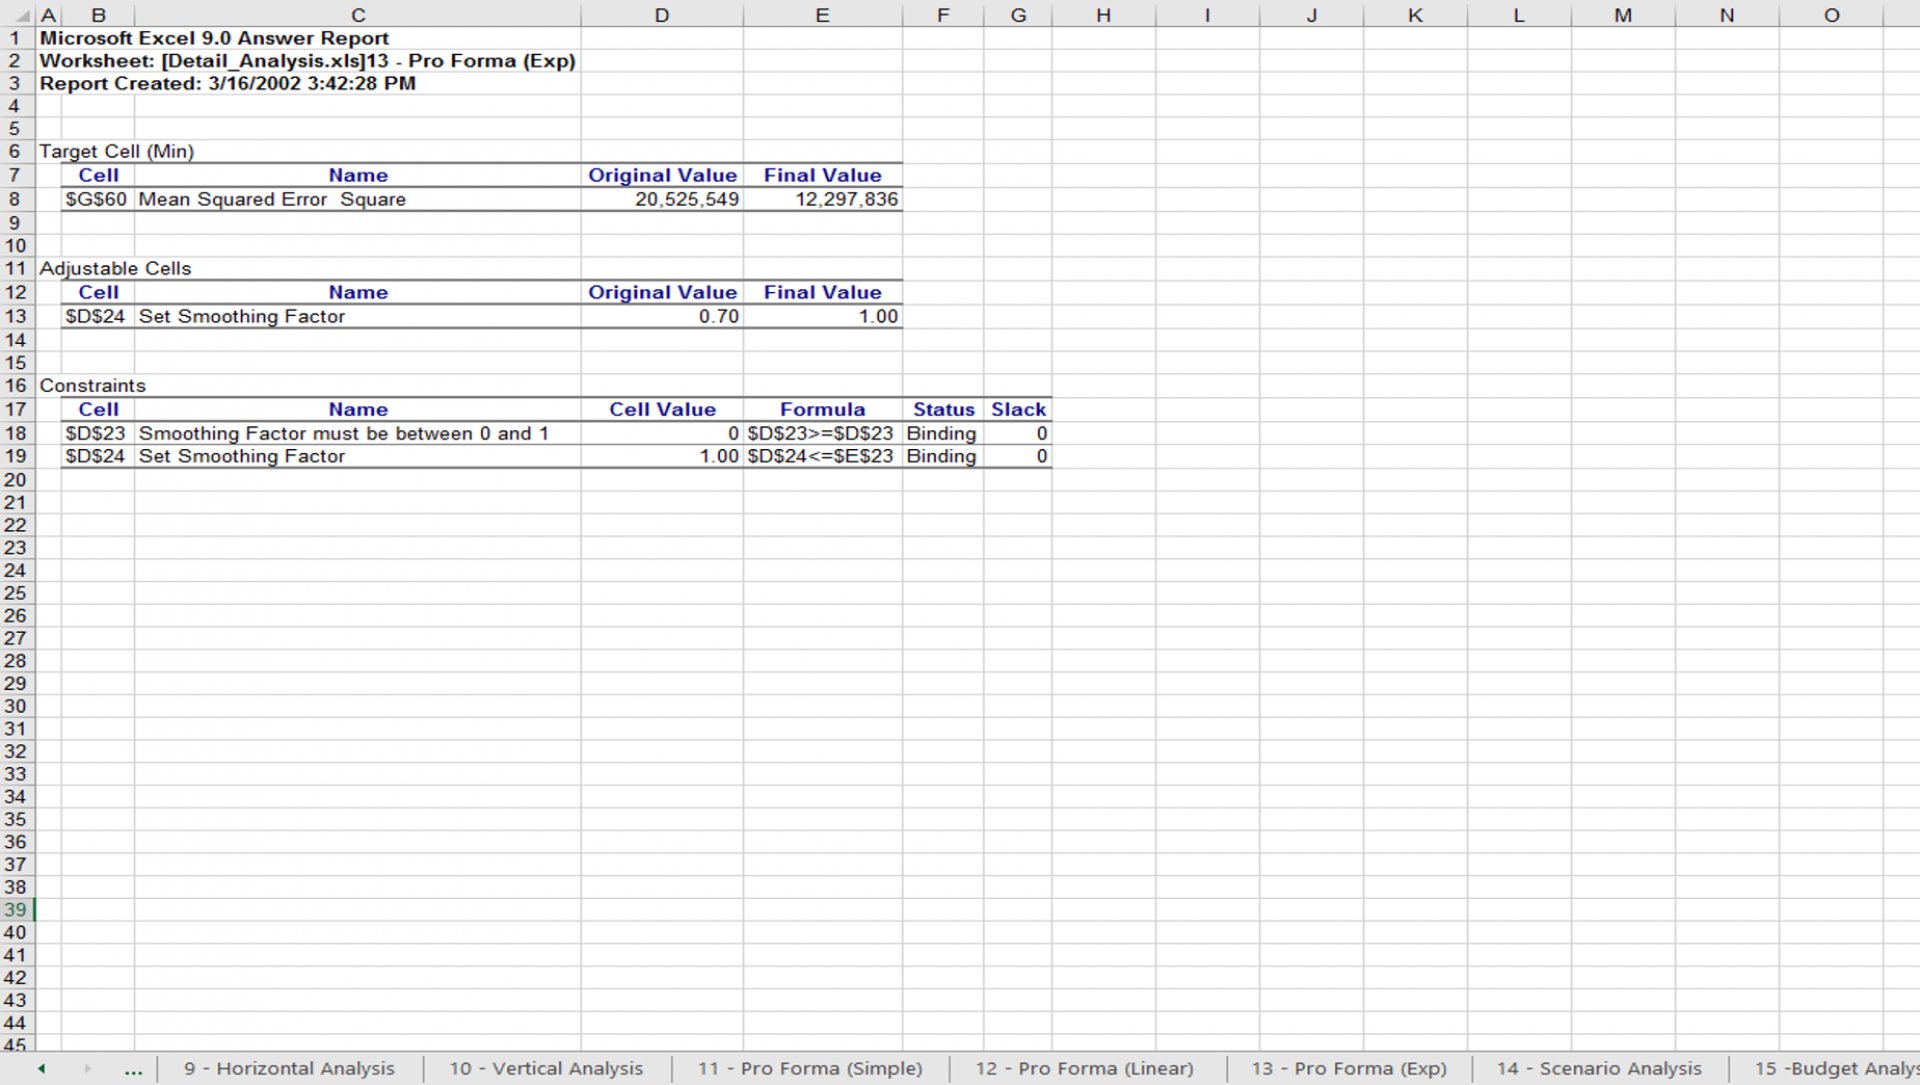
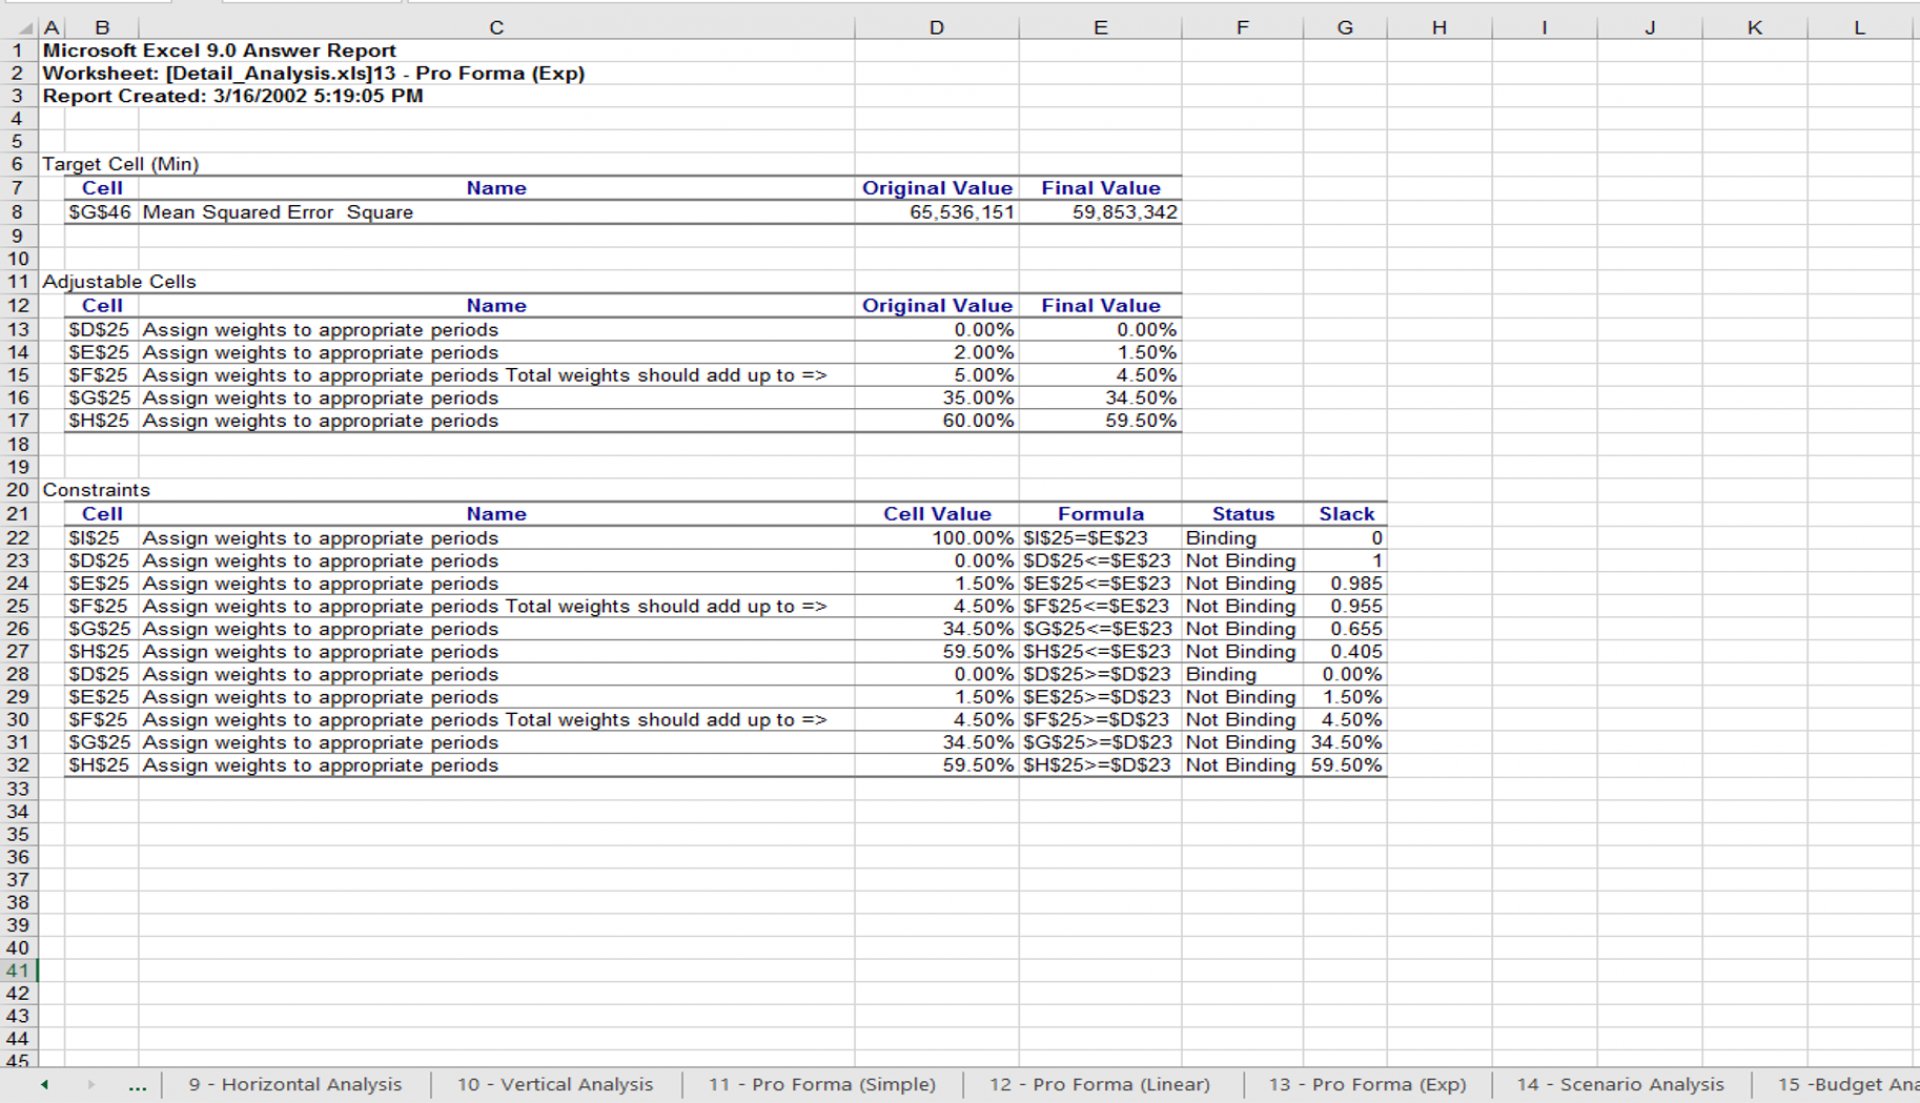
Evaluating Financial Performance and Forecasting
Set of worksheets related to financial analysis and forecasting
Further information
This spreadsheet uses certain financial functions (such as =TREND) which might not be found in your version of Microsoft Excel. To take full advantage of financial and statistical functions, you should install the Add On package titled: Analysis ToolPack.
