

Originally published: 22/09/2021 12:08
Publication number: ELQ-66741-1
View all versions & Certificate
Publication number: ELQ-66741-1
View all versions & Certificate

Financial Ratios in Excel
Financial Statement Analysis Ratios in Excel
financial ratiosexcelratiosliquidity ratiosasset management ratiosdebt management ratiosprofitability ratiosmarket value ratios
Description
Financial statement analysis is useful to anticipate future conditions and, most important, as a starting point for developing strategies that influence a company's future course of business.
An important step toward achieving these goals is to analyze the firm's financial ratios. Ratios are designed to highlight relationships between the financial statement accounts. These relationships begin to reveal how well a company is doing in its primary goal of creating value for its shareholders.
There are two ratio analysis techniques that provide additional insight into a company. The first technique is to compare the ratios of one company with other similar companies within the same industry. The second technique is to observe trends of the ratios over a period. These trends give clues about a company's performance.
The most common financial ratios can be grouped into five general categories:
Liquidity Ratios
Asset Management Ratios
Debt Management Ratios
Profitability Ratios
Market Value Ratios
You can check the free file with the worked examples here.
Liquidity Ratios
Liquidity Ratios address one of the first concerns of a firm: Will the company be able to meet its obligations. These ratios attempt to measure the extent to which the short-term creditors of the firm are covered by assets that are expected to be converted to cash in roughly the same period.
Liquidity Ratios include:
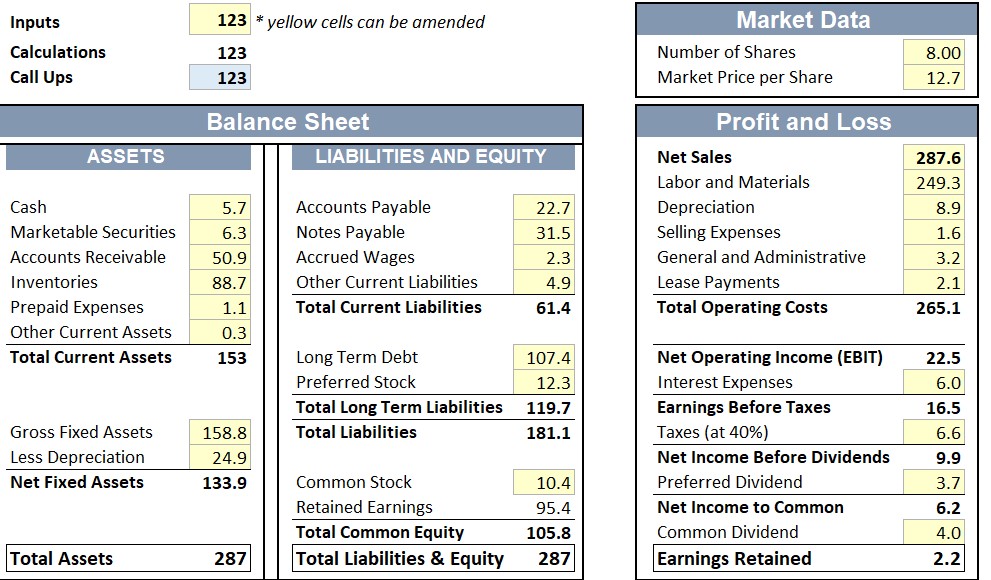
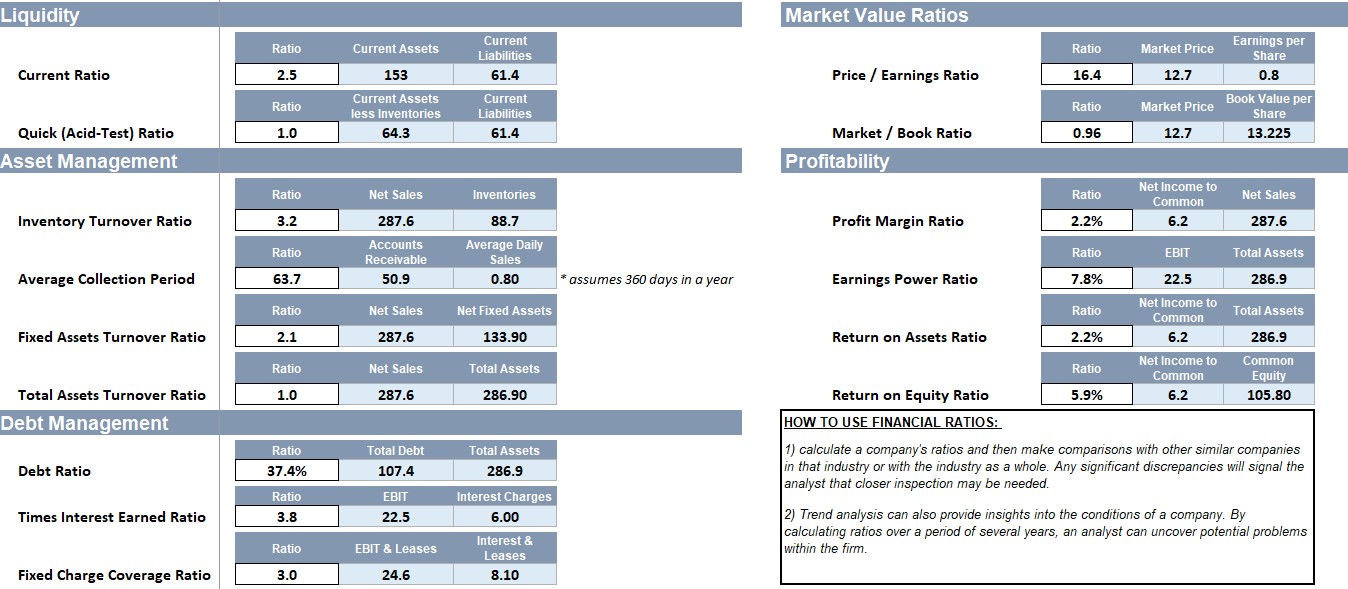
Current Ratio: The Current Ratio is calculated by dividing CURRENT ASSETS by CURRENT LIABILITIES. The Current Ratio means that, if necessary, the company could use its current assets to pay off its current liabilities. If a company is experiencing financial difficulty; it may begin to pay its bills more slowly. If CURRENT LIABILITIES are rising more quickly than CURRENT ASSETS, the Current Ratio will fall. This could indicate trouble in the company.
Quick (Acid-Test) Ratio: The Quick (Acid-Test) Ratio is computed by subtracting INVENTORIES from CURRENT ASSETS, then dividing the remainder by CURRENT LIABILITIES. Inventories usually are the least liquid of the current assets. They are the most difficult to convert to cash and most likely to incur losses during a liquidation. The Quick Ratio gives an indication of the firm's ability to meet short-term obligations without relying on the sale of inventories.
Asset Management Ratios
These ratios attempt to measure how effectively the company is managing its assets. They are designed to tell the analyst if the amounts of each type of asset reported on the Balance Sheet are reasonable, given current and anticipated operating levels of the firm.
Asset Management Ratios include:
Inventory Turnover Ratio: The Inventory Turnover (Inventory Utilization) Ratio is calculated by dividing the Net SALES of the firm by its INVENTORIES. Obsolete, unnecessary, or excess products held in inventories cause the Asset Turnover Ratio to fall, which may indicate a need for management action.
The first concern is that sales are stated at market prices, whereas inventories are usually carried at cost. In an environment with rapidly changing prices, the ratio would overstate the inventory turnover rate. When market prices are volatile, a more accurate calculation may be made using Cost of Goods Sold in the numerator. The other weakness is that sales occur over the entire year, whereas the inventory is valued at a point of time. A business with highly seasonal trends may calculate the ratio using an average inventory figure.
Average Collection Period: The Average Collection Period (ACP) is often used to appraise ACCOUNTS RECEIVABLE. It is computed by dividing ACCOUNTS RECEIVABLE by the average daily sales. The Average Collection Period represents the number of days the company must wait after a sale is made before receiving cash.
Fixed Assets Turnover Ratio: To measure the utilization of the firm's plant and equipment, the Fixed Assets Turnover (Fixed Asset Utilization) Ratio can be used. It is the firm's SALES divided by its FIXED ASSETS. Unnecessary or underutilized fixed assets that do not increase sales cause this ratio to become lower. Once again, consider that in a period of rapidly changing prices, the value of fixed assets on the Balance Sheet may be seriously understated. This causes a firm with older equipment to report a higher turnover than a firm with more recently purchased plants and equipment.
Total Assets Turnover Ratio: The Total Assets Turnover Ratio measures the utilization of the company's assets. To compute the Total Assets Turnover Ratio, divide SALES by TOTAL ASSETS. The Total Assets Turnover Ratio indicates how many times the value of all ASSETS is being generated in SALES. The same concerns about understated assets also are applicable to the Total Assets Turnover Ratio.
Debt Management Ratios
Analysts have developed ratios to determine the extent of the use of borrowed funds to finance assets and to determine how many times the income generated by those assets can be used to make interest payments.
These ratios include:
Total Debt to Total Assets Ratio: The Total Debt to Total Assets Ratio measures the percentage of total funds provided using debt. It is calculated by dividing TOTAL DEBT by TOTAL ASSETS. This Debt Ratio is used by creditors to help decide if they will loan money to the company.
Times Interest Earned (TIE) Ratio: The Times Interest Earned Ratio gives the analyst an idea of how far operating income can decline before the company is unable to meet its interest payments on currently held debt. The TIE Ratio is computed by dividing EARNINGS BEFORE INTEREST AND TAXES (EBIT) by the INTEREST CHARGES. The TIE Ratio indicates to the analyst how many times the company can make interest payments with the earnings generated by the firm.
Fixed Charge Coverage Ratio: The Fixed Charge Coverage Ratio has one important difference from the TIE Ratio. Many companies enter long-term lease agreements for assets. This ratio recognizes those leases as obligations and includes the LEASE PAYMENTS as fixed charges along with INTEREST PAYMENTS on loans. The Fixed Charge Coverage Ratio is computed by dividing EBIT plus LEASE PAYMENTS by INTEREST CHARGES plus LEASE PAYMENTS. This ratio is used more often than the TIE ratio, especially in industries where leasing of assets is common. It tells how many times all fixed payments incurred by the company can be made by using all the earnings of the firm.
Profitability Ratios
All policies and decisions made by a company are driven by the company's profitability goal. The previous ratios were designed to provide information about the operations of a company. Another group of ratios, Profitability Ratios, highlight the combined effects of liquidity, asset management, and debt management.
These ratios include:
Profit Margin Ratio: The Profit Margin Ratio shows the percentage of sales that is left for distribution to the common shareholders. The calculation is NET INCOME AVAILABLE TO COMMON SHAREHOLDERS divided by SALES for the period. The Profit Margin Ratio reveals to the analyst how much profit is being generated by the company for each dollar of sales.
Earnings Power Ratio: The Earnings Power Ratio is used to help compare firms with different degrees of financial leverage and in different tax situations. It provides the analyst with an idea of how effectively the assets are used to generate earnings. The computation is EARNINGS BEFORE INTEREST and TAXES (EBIT) divided by TOTAL ASSETS. EBIT is used in the Earnings Power Ratio to eliminate any interest payments or tax considerations of the firm. The Basic Earnings Power Ratio indicates the percentage of TOTAL ASSETS generated as EARNINGS.
Return on Total Assets Ratio: By taking NET INCOME AVAILABLE TO COMMON SHAREHOLDERS and dividing it by the value of all the ASSETS, the analyst calculates the return on those assets. The Return on Total Assets (ROA) Ratio is used to determine the return generated by the company on its assets.
Return on Common Equity Ratio: The Return on Common Equity (ROE) Ratio is a measure of the rate of return on stockholders' investments. It is calculated by dividing NET INCOME AVAILABLE TO COMMON SHAREHOLDERS by the TOTAL COMMON EQUITY capital in the firm. The ROE Ratio tells the analyst the return that common shareholders had on their investments.
Market Value Ratios
Market Value Ratios relate the company's stock price data with the earnings and capital structure of the company. This information gives the analyst an idea of the view investors has of the company's past performance and their view of the firm's prospects.
These ratios include:
Price / Earnings Ratio: P/E Ratio shows how much investors are willing to pay for every dollar of the company's reported profits. It is calculated by dividing the market price per share of Common Stock by EARNINGS PER SHARE (EPS). The earnings per share calculation is NET INCOME AVAILABLE TO COMMON divided by the Number of Shares Outstanding.
Market / Book Ratio: The Market / Book Ratio shows how much investors are willing to pay relative to the value of the company as shown on its books. The total market value of a company is the value that investors in the stock market (where the shares are being traded) think the company is worth. This value is derived from the stock price at which the shares are trading.
To calculate the Market / Book Ratio, the analyst must first compute the book value per share. This computation is the value of COMMON EQUITY divided by the Number of Shares. The Market / Book Ratio is calculated by dividing the market price per share by the book value per share. The Market / Book Ratio indicates how many times above (or below) the book value of the company’s investors are paying for an equity position.
How to use Financial Ratios
1) calculate a company's ratios and then make comparisons with other similar companies in that industry or with the industry. Any significant discrepancies will signal the analyst that closer inspection may be needed.
2) Trend analysis can also provide insights into the conditions of a company. By calculating ratios over a period of several years, an analyst can uncover potential problems within the firm.
Financial statement analysis is useful to anticipate future conditions and, most important, as a starting point for developing strategies that influence a company's future course of business.
An important step toward achieving these goals is to analyze the firm's financial ratios. Ratios are designed to highlight relationships between the financial statement accounts. These relationships begin to reveal how well a company is doing in its primary goal of creating value for its shareholders.
There are two ratio analysis techniques that provide additional insight into a company. The first technique is to compare the ratios of one company with other similar companies within the same industry. The second technique is to observe trends of the ratios over a period. These trends give clues about a company's performance.
The most common financial ratios can be grouped into five general categories:
Liquidity Ratios
Asset Management Ratios
Debt Management Ratios
Profitability Ratios
Market Value Ratios
You can check the free file with the worked examples here.
Liquidity Ratios
Liquidity Ratios address one of the first concerns of a firm: Will the company be able to meet its obligations. These ratios attempt to measure the extent to which the short-term creditors of the firm are covered by assets that are expected to be converted to cash in roughly the same period.
Liquidity Ratios include:
Current Ratio: The Current Ratio is calculated by dividing CURRENT ASSETS by CURRENT LIABILITIES. The Current Ratio means that, if necessary, the company could use its current assets to pay off its current liabilities. If a company is experiencing financial difficulty; it may begin to pay its bills more slowly. If CURRENT LIABILITIES are rising more quickly than CURRENT ASSETS, the Current Ratio will fall. This could indicate trouble in the company.
Quick (Acid-Test) Ratio: The Quick (Acid-Test) Ratio is computed by subtracting INVENTORIES from CURRENT ASSETS, then dividing the remainder by CURRENT LIABILITIES. Inventories usually are the least liquid of the current assets. They are the most difficult to convert to cash and most likely to incur losses during a liquidation. The Quick Ratio gives an indication of the firm's ability to meet short-term obligations without relying on the sale of inventories.
Asset Management Ratios
These ratios attempt to measure how effectively the company is managing its assets. They are designed to tell the analyst if the amounts of each type of asset reported on the Balance Sheet are reasonable, given current and anticipated operating levels of the firm.
Asset Management Ratios include:
Inventory Turnover Ratio: The Inventory Turnover (Inventory Utilization) Ratio is calculated by dividing the Net SALES of the firm by its INVENTORIES. Obsolete, unnecessary, or excess products held in inventories cause the Asset Turnover Ratio to fall, which may indicate a need for management action.
The first concern is that sales are stated at market prices, whereas inventories are usually carried at cost. In an environment with rapidly changing prices, the ratio would overstate the inventory turnover rate. When market prices are volatile, a more accurate calculation may be made using Cost of Goods Sold in the numerator. The other weakness is that sales occur over the entire year, whereas the inventory is valued at a point of time. A business with highly seasonal trends may calculate the ratio using an average inventory figure.
Average Collection Period: The Average Collection Period (ACP) is often used to appraise ACCOUNTS RECEIVABLE. It is computed by dividing ACCOUNTS RECEIVABLE by the average daily sales. The Average Collection Period represents the number of days the company must wait after a sale is made before receiving cash.
Fixed Assets Turnover Ratio: To measure the utilization of the firm's plant and equipment, the Fixed Assets Turnover (Fixed Asset Utilization) Ratio can be used. It is the firm's SALES divided by its FIXED ASSETS. Unnecessary or underutilized fixed assets that do not increase sales cause this ratio to become lower. Once again, consider that in a period of rapidly changing prices, the value of fixed assets on the Balance Sheet may be seriously understated. This causes a firm with older equipment to report a higher turnover than a firm with more recently purchased plants and equipment.
Total Assets Turnover Ratio: The Total Assets Turnover Ratio measures the utilization of the company's assets. To compute the Total Assets Turnover Ratio, divide SALES by TOTAL ASSETS. The Total Assets Turnover Ratio indicates how many times the value of all ASSETS is being generated in SALES. The same concerns about understated assets also are applicable to the Total Assets Turnover Ratio.
Debt Management Ratios
Analysts have developed ratios to determine the extent of the use of borrowed funds to finance assets and to determine how many times the income generated by those assets can be used to make interest payments.
These ratios include:
Total Debt to Total Assets Ratio: The Total Debt to Total Assets Ratio measures the percentage of total funds provided using debt. It is calculated by dividing TOTAL DEBT by TOTAL ASSETS. This Debt Ratio is used by creditors to help decide if they will loan money to the company.
Times Interest Earned (TIE) Ratio: The Times Interest Earned Ratio gives the analyst an idea of how far operating income can decline before the company is unable to meet its interest payments on currently held debt. The TIE Ratio is computed by dividing EARNINGS BEFORE INTEREST AND TAXES (EBIT) by the INTEREST CHARGES. The TIE Ratio indicates to the analyst how many times the company can make interest payments with the earnings generated by the firm.
Fixed Charge Coverage Ratio: The Fixed Charge Coverage Ratio has one important difference from the TIE Ratio. Many companies enter long-term lease agreements for assets. This ratio recognizes those leases as obligations and includes the LEASE PAYMENTS as fixed charges along with INTEREST PAYMENTS on loans. The Fixed Charge Coverage Ratio is computed by dividing EBIT plus LEASE PAYMENTS by INTEREST CHARGES plus LEASE PAYMENTS. This ratio is used more often than the TIE ratio, especially in industries where leasing of assets is common. It tells how many times all fixed payments incurred by the company can be made by using all the earnings of the firm.
Profitability Ratios
All policies and decisions made by a company are driven by the company's profitability goal. The previous ratios were designed to provide information about the operations of a company. Another group of ratios, Profitability Ratios, highlight the combined effects of liquidity, asset management, and debt management.
These ratios include:
Profit Margin Ratio: The Profit Margin Ratio shows the percentage of sales that is left for distribution to the common shareholders. The calculation is NET INCOME AVAILABLE TO COMMON SHAREHOLDERS divided by SALES for the period. The Profit Margin Ratio reveals to the analyst how much profit is being generated by the company for each dollar of sales.
Earnings Power Ratio: The Earnings Power Ratio is used to help compare firms with different degrees of financial leverage and in different tax situations. It provides the analyst with an idea of how effectively the assets are used to generate earnings. The computation is EARNINGS BEFORE INTEREST and TAXES (EBIT) divided by TOTAL ASSETS. EBIT is used in the Earnings Power Ratio to eliminate any interest payments or tax considerations of the firm. The Basic Earnings Power Ratio indicates the percentage of TOTAL ASSETS generated as EARNINGS.
Return on Total Assets Ratio: By taking NET INCOME AVAILABLE TO COMMON SHAREHOLDERS and dividing it by the value of all the ASSETS, the analyst calculates the return on those assets. The Return on Total Assets (ROA) Ratio is used to determine the return generated by the company on its assets.
Return on Common Equity Ratio: The Return on Common Equity (ROE) Ratio is a measure of the rate of return on stockholders' investments. It is calculated by dividing NET INCOME AVAILABLE TO COMMON SHAREHOLDERS by the TOTAL COMMON EQUITY capital in the firm. The ROE Ratio tells the analyst the return that common shareholders had on their investments.
Market Value Ratios
Market Value Ratios relate the company's stock price data with the earnings and capital structure of the company. This information gives the analyst an idea of the view investors has of the company's past performance and their view of the firm's prospects.
These ratios include:
Price / Earnings Ratio: P/E Ratio shows how much investors are willing to pay for every dollar of the company's reported profits. It is calculated by dividing the market price per share of Common Stock by EARNINGS PER SHARE (EPS). The earnings per share calculation is NET INCOME AVAILABLE TO COMMON divided by the Number of Shares Outstanding.
Market / Book Ratio: The Market / Book Ratio shows how much investors are willing to pay relative to the value of the company as shown on its books. The total market value of a company is the value that investors in the stock market (where the shares are being traded) think the company is worth. This value is derived from the stock price at which the shares are trading.
To calculate the Market / Book Ratio, the analyst must first compute the book value per share. This computation is the value of COMMON EQUITY divided by the Number of Shares. The Market / Book Ratio is calculated by dividing the market price per share by the book value per share. The Market / Book Ratio indicates how many times above (or below) the book value of the company’s investors are paying for an equity position.
How to use Financial Ratios
1) calculate a company's ratios and then make comparisons with other similar companies in that industry or with the industry. Any significant discrepancies will signal the analyst that closer inspection may be needed.
2) Trend analysis can also provide insights into the conditions of a company. By calculating ratios over a period of several years, an analyst can uncover potential problems within the firm.
This Best Practice includes
1 Excel file
Further information
Calculate various financial ratios in excel
