
Originally published: 04/04/2022 12:02
Publication number: ELQ-32161-1
View all versions & Certificate
Publication number: ELQ-32161-1
View all versions & Certificate

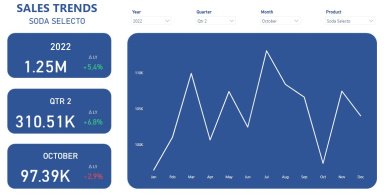
Power BI Sales Dashboard: Trends and Growth
Analyse sales trend and sales growth compared to last year
Further information
It is a practical and easy to use tool, ideal for companies who want to analyse the trend and growth of their sales.
