
Originally published: 19/04/2022 09:08
Publication number: ELQ-63769-1
View all versions & Certificate
Publication number: ELQ-63769-1
View all versions & Certificate

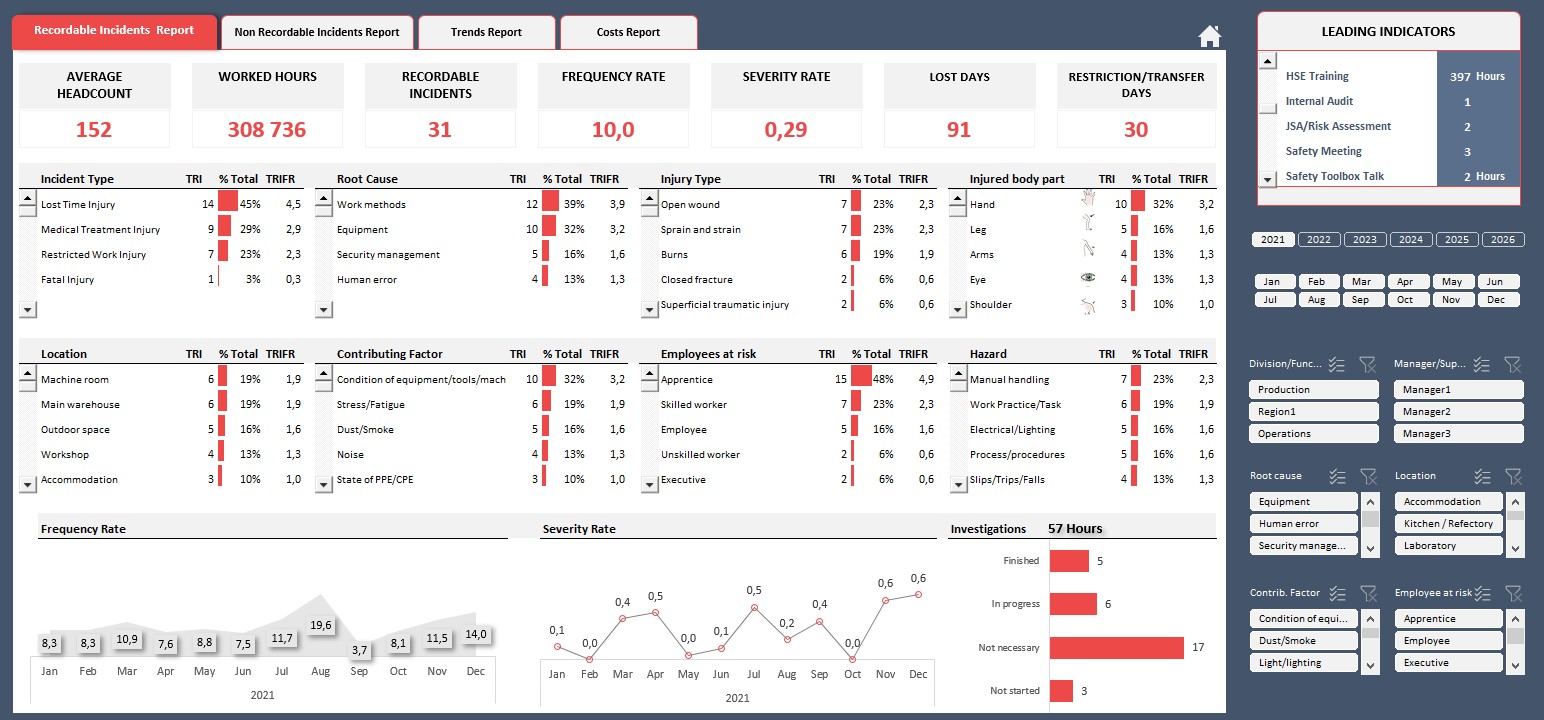
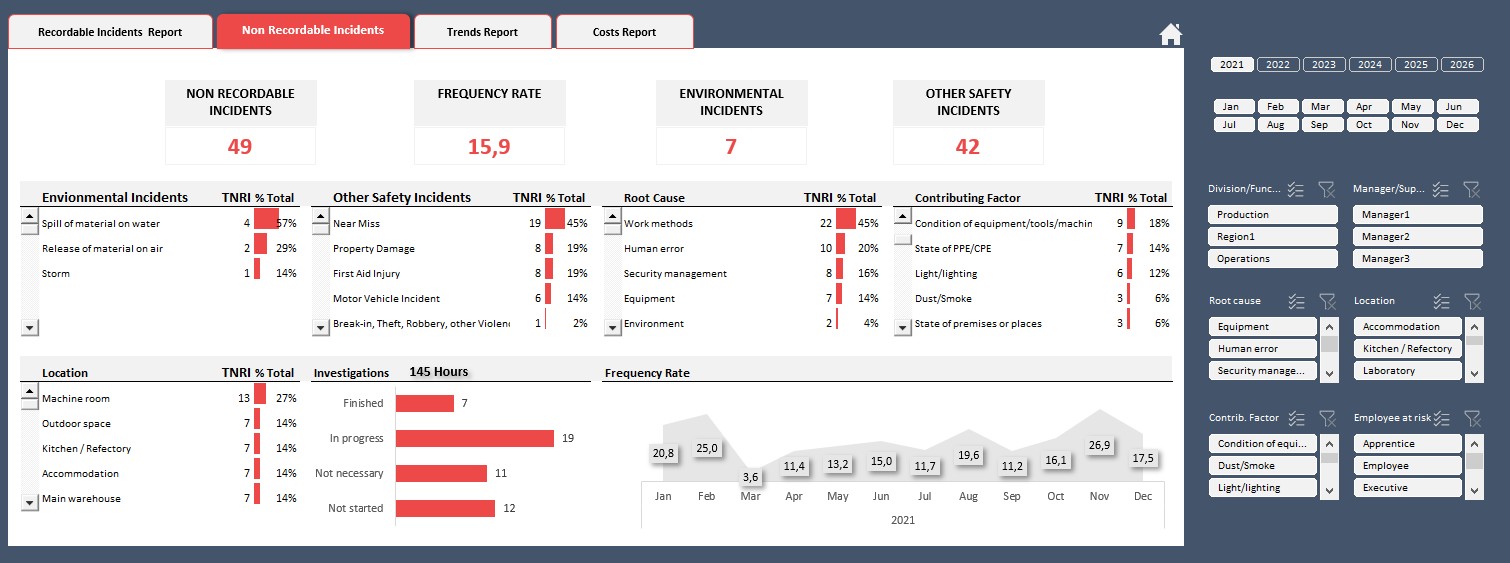
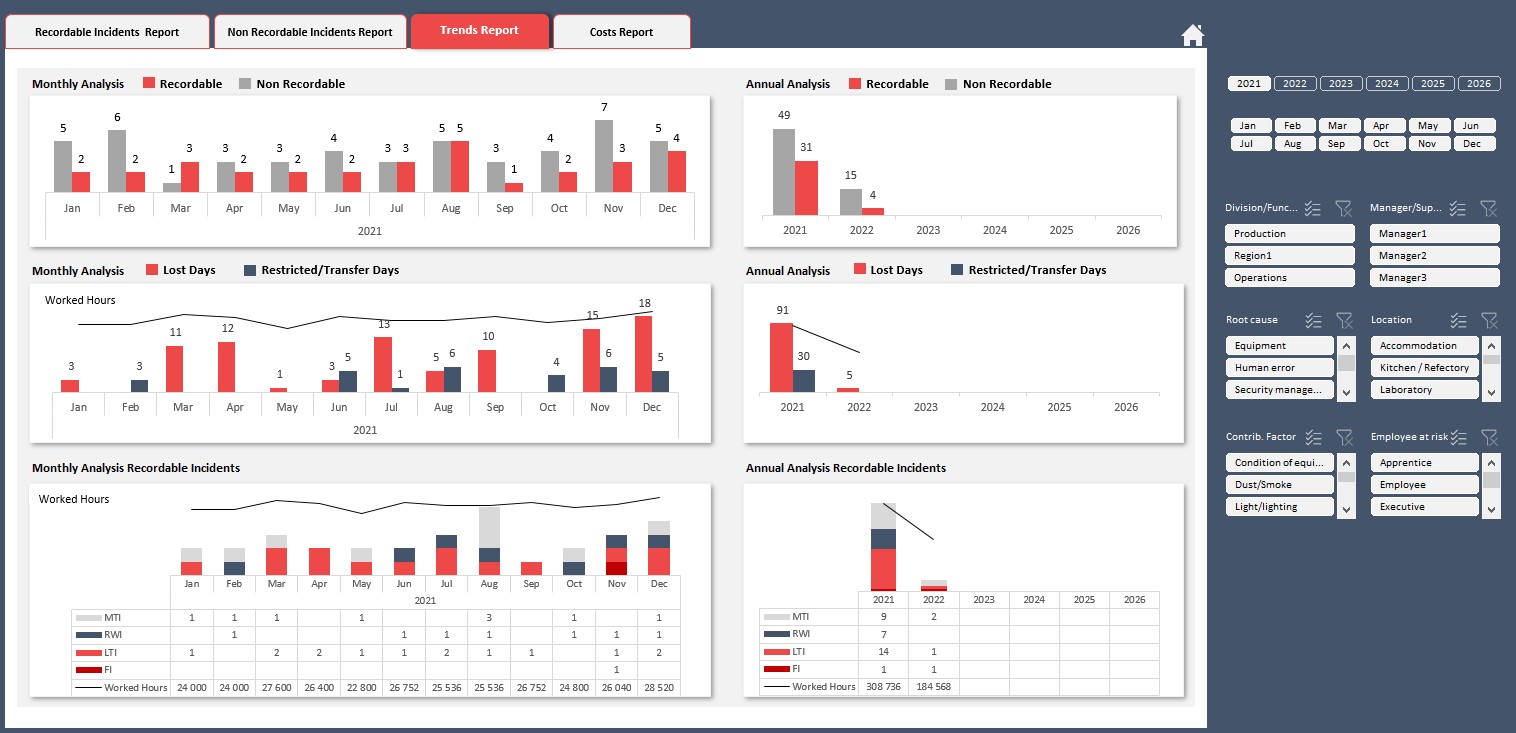
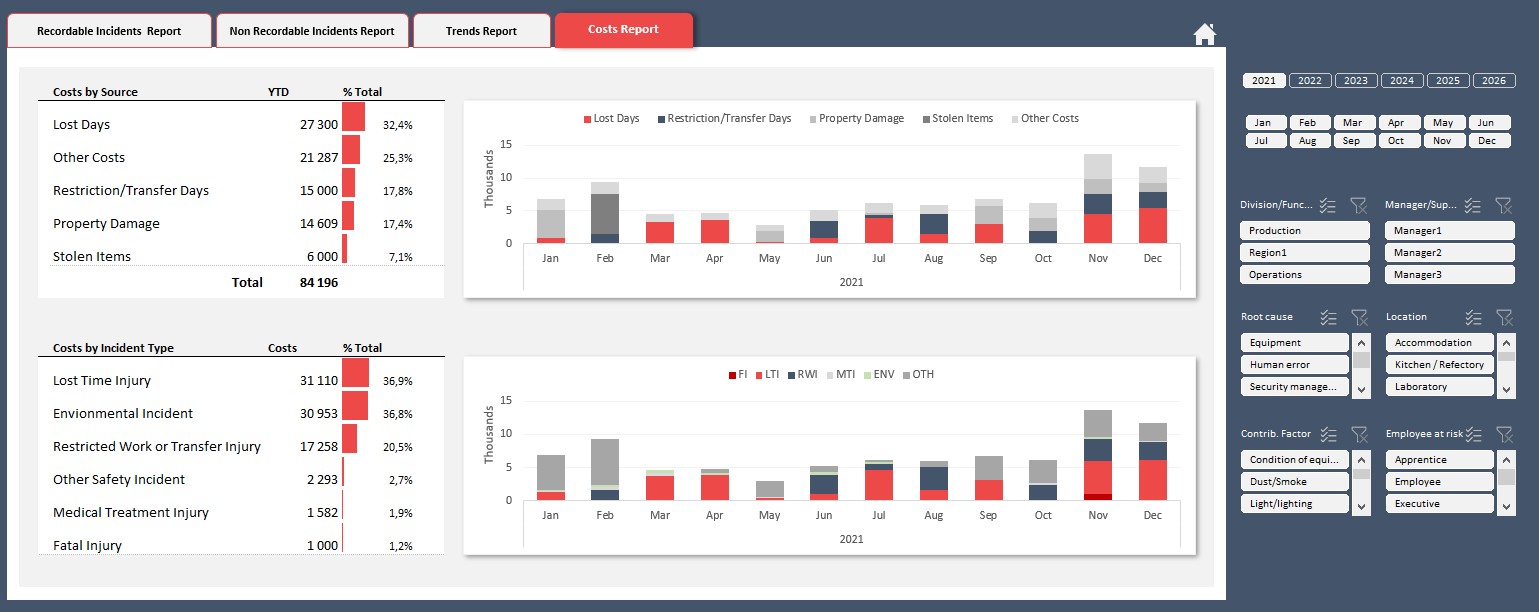
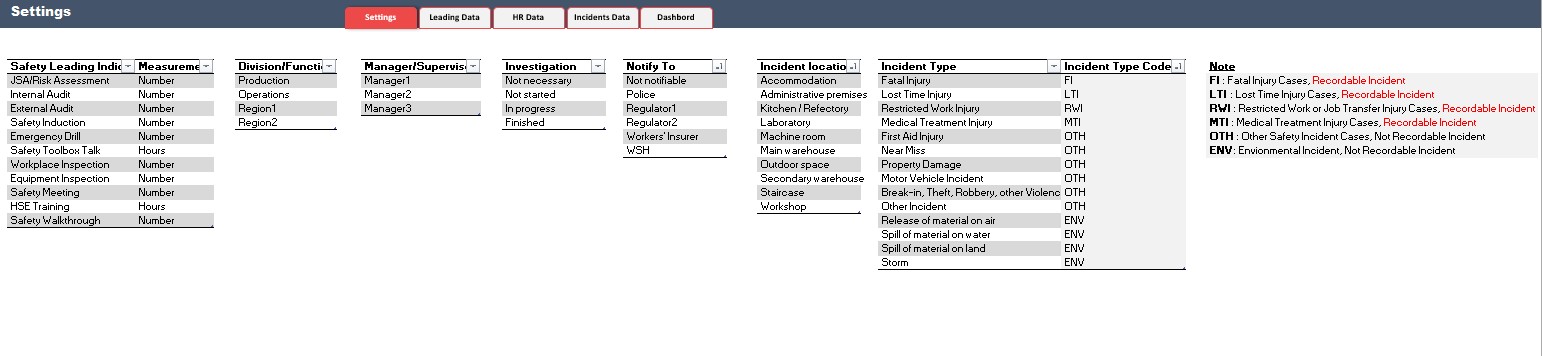
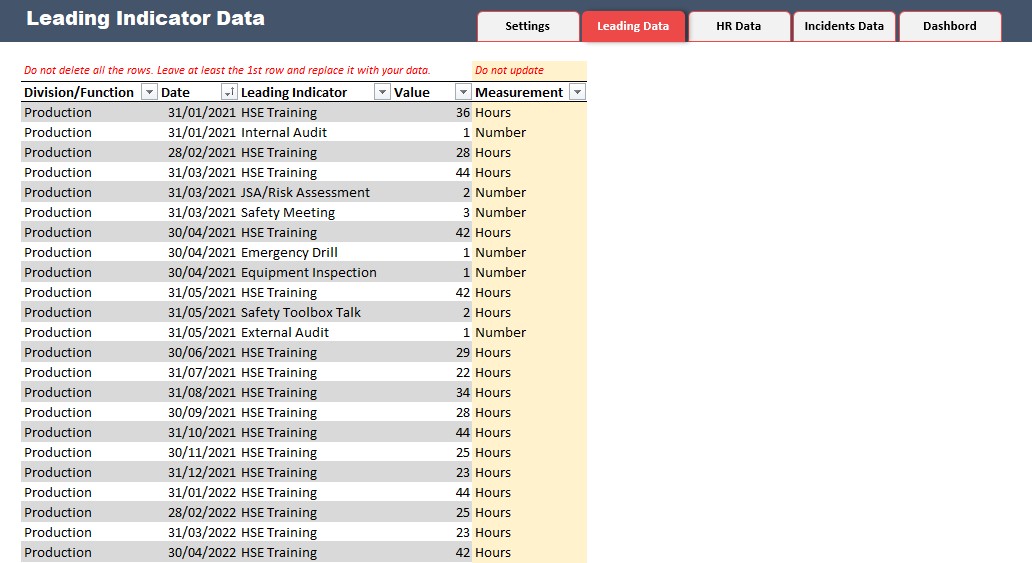
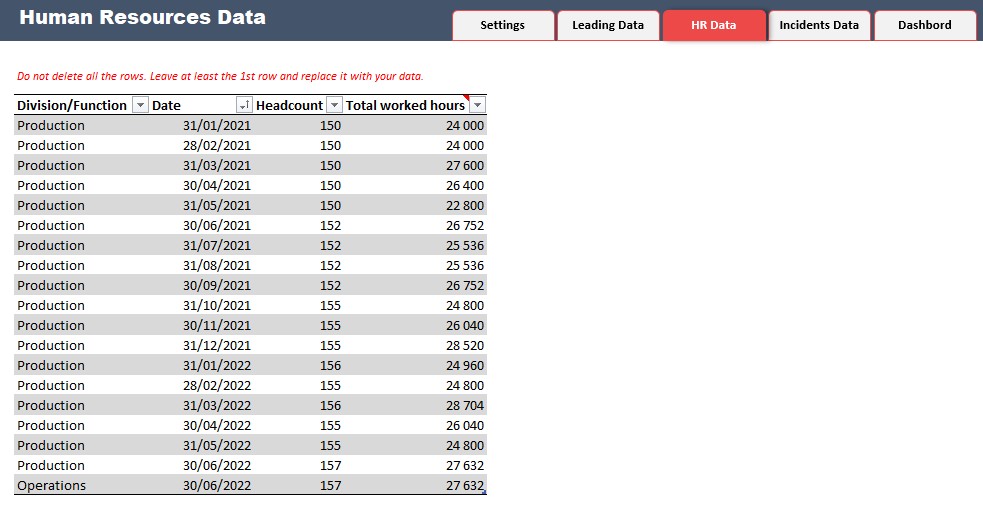
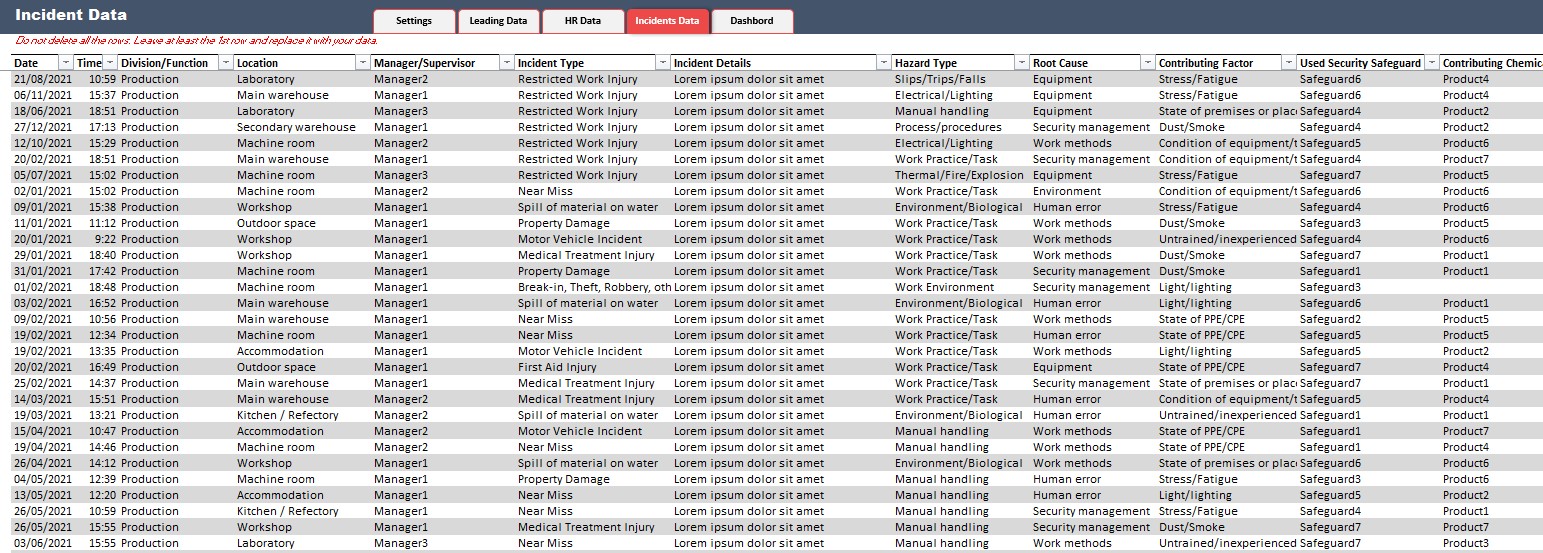
Advanced Safety Dashboard Excel Template
Track safety leading indicators, fatalities, lost time, restricted/job transfer, medical treatment injuries, recordable incident frequency and severity rate etc
Further information
It can help you to reduce work-related injuries.
It is a practical and easy-to-use template, ideal for Executives, Plant, Production and Safety Managers who need an advanced tool to analyse and improve safety at work.
