Originally published: 16/12/2019 07:08
Last version published: 30/05/2023 13:21
Publication number: ELQ-20434-11
View all versions & Certificate
Last version published: 30/05/2023 13:21
Publication number: ELQ-20434-11
View all versions & Certificate

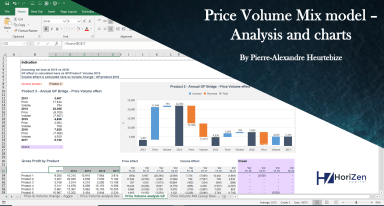
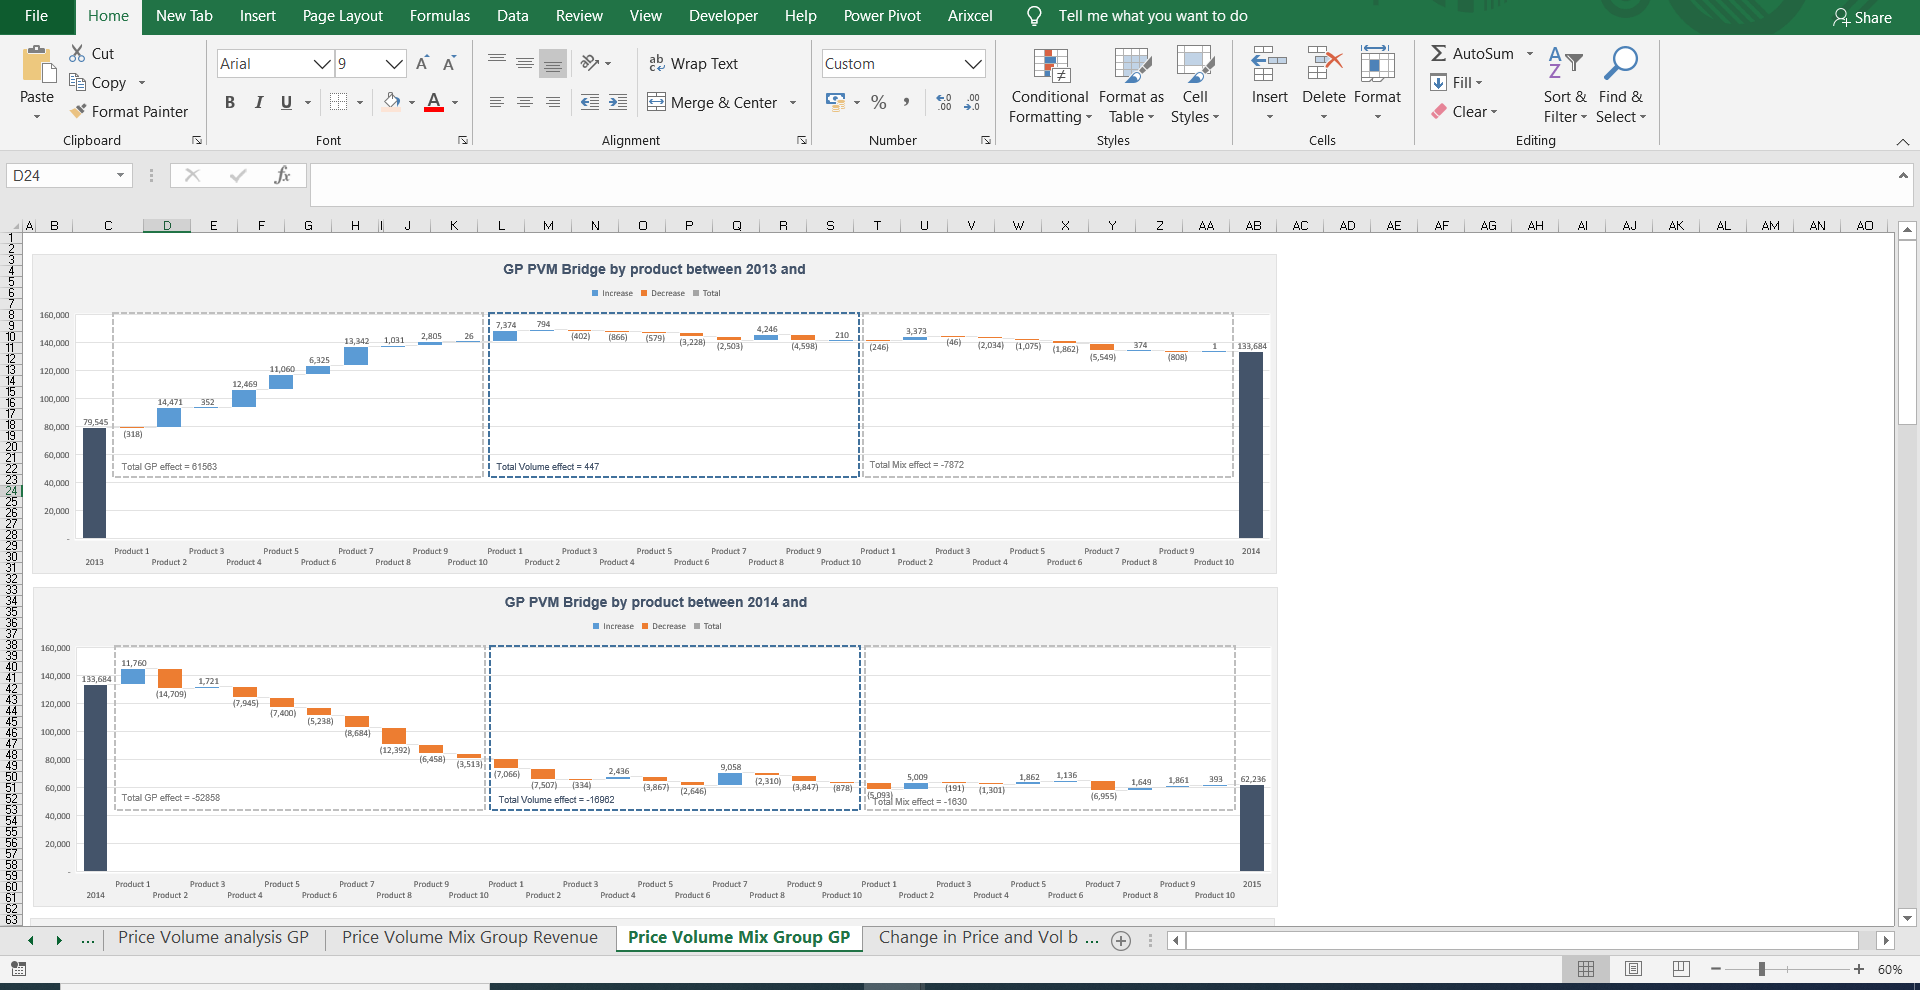
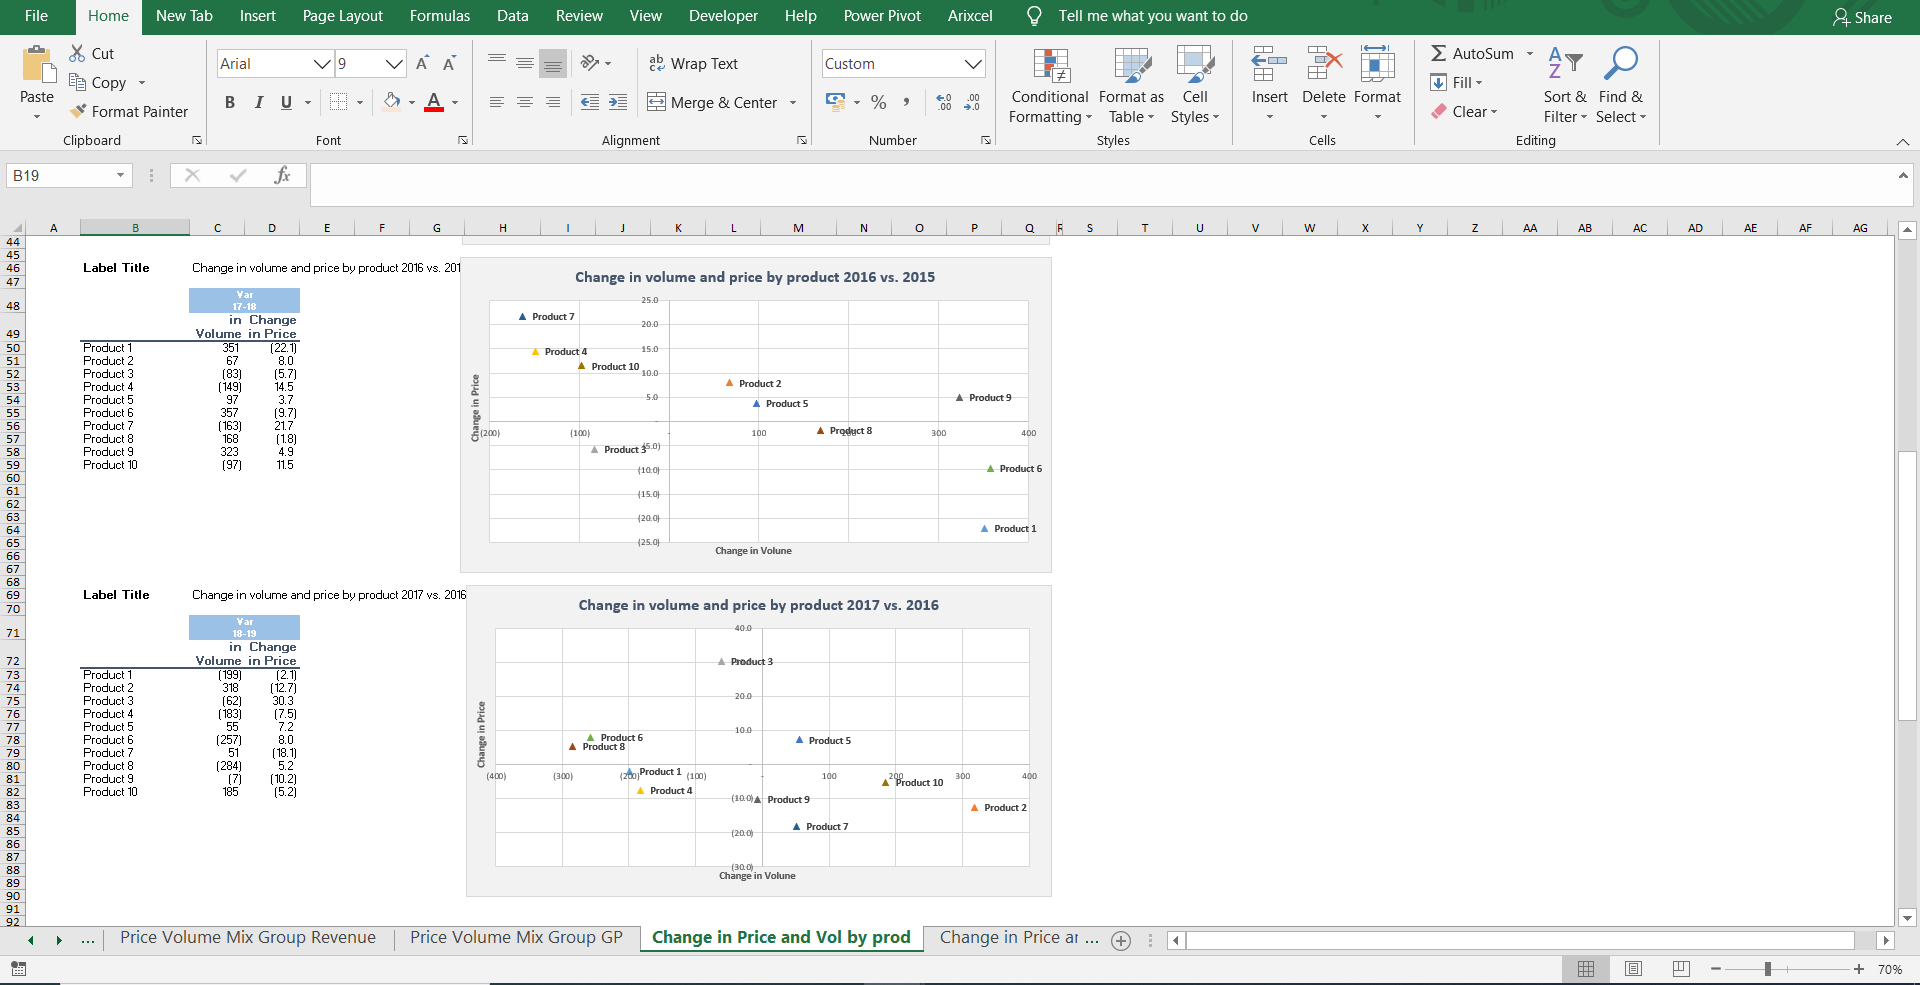
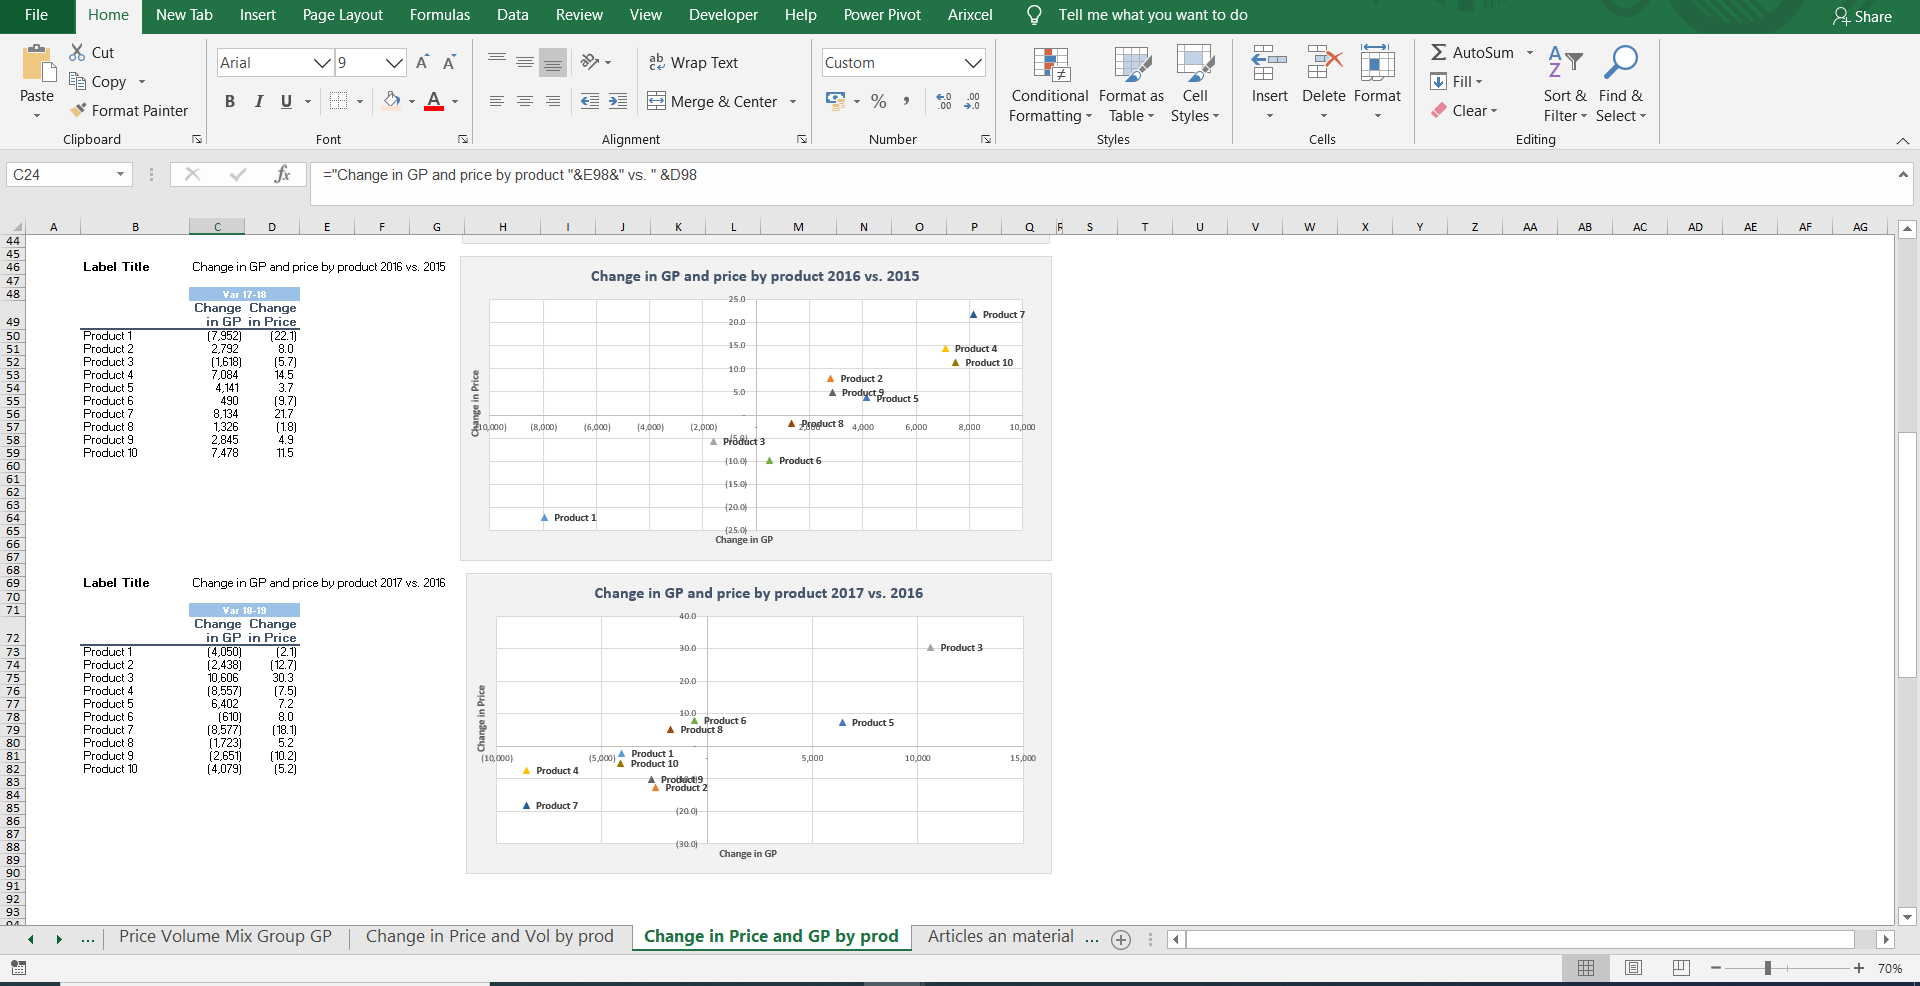
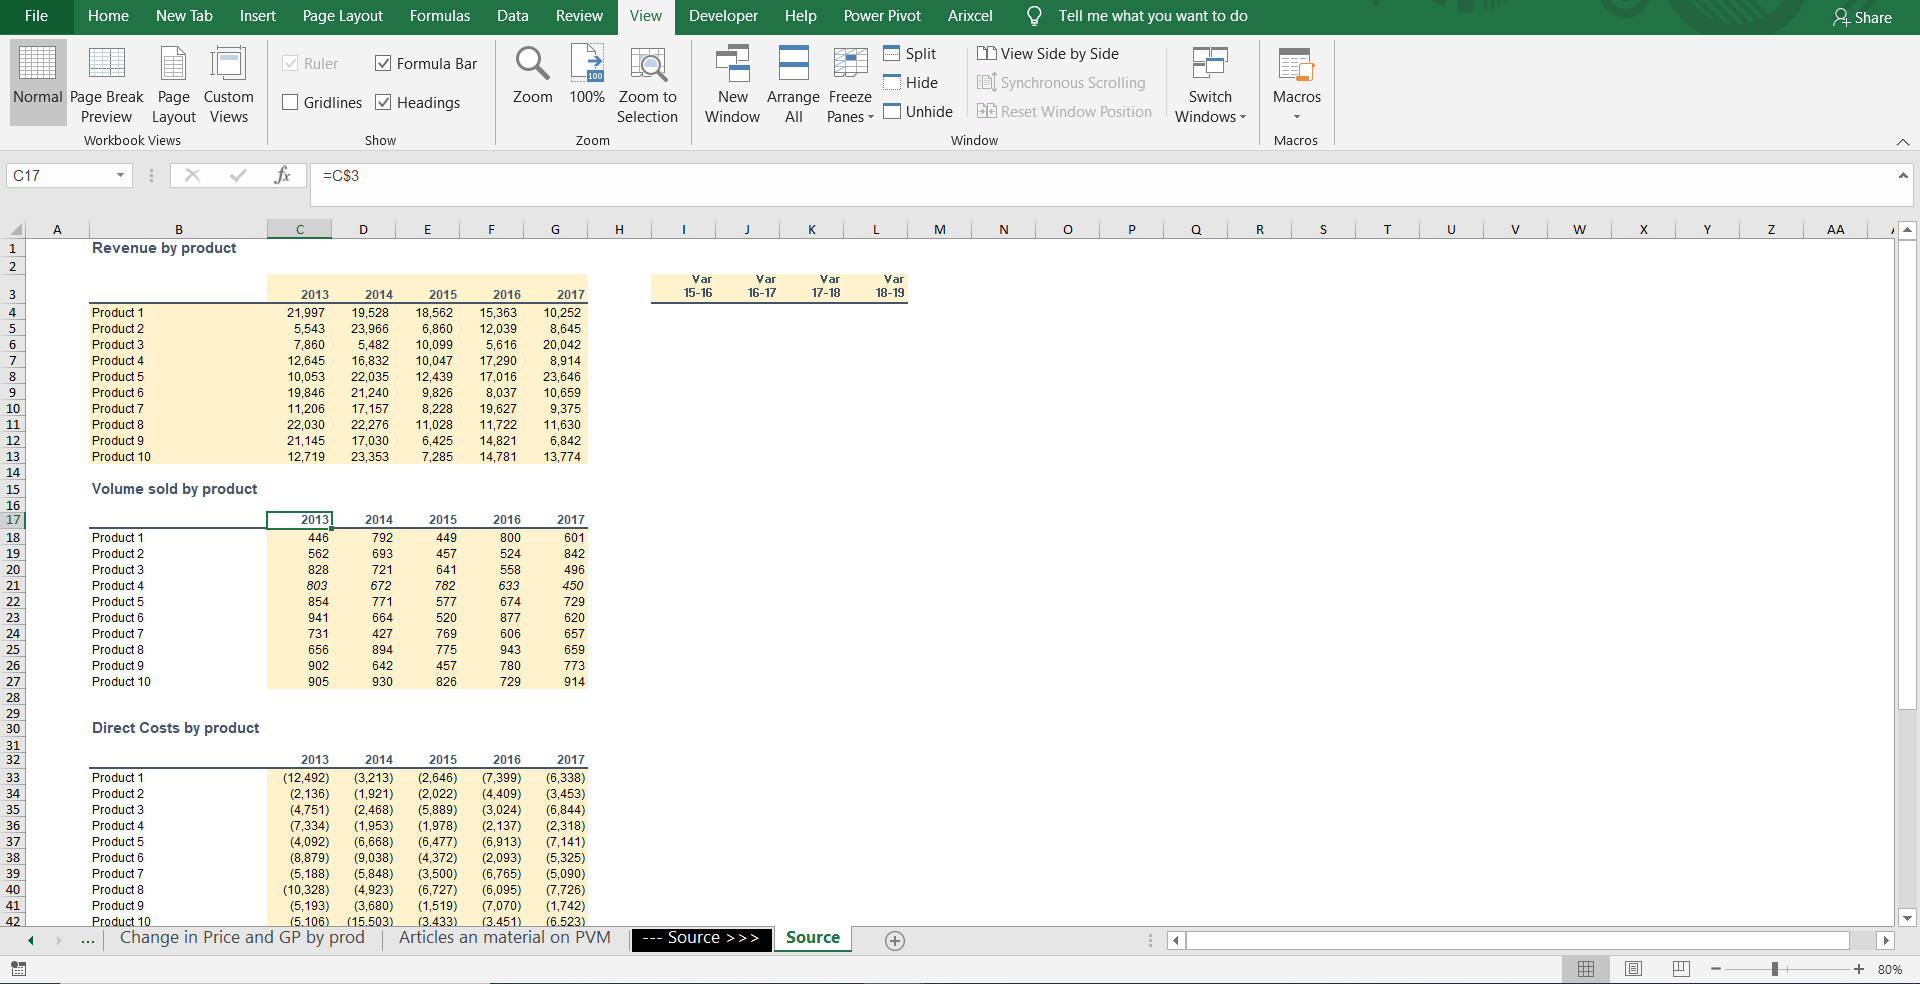
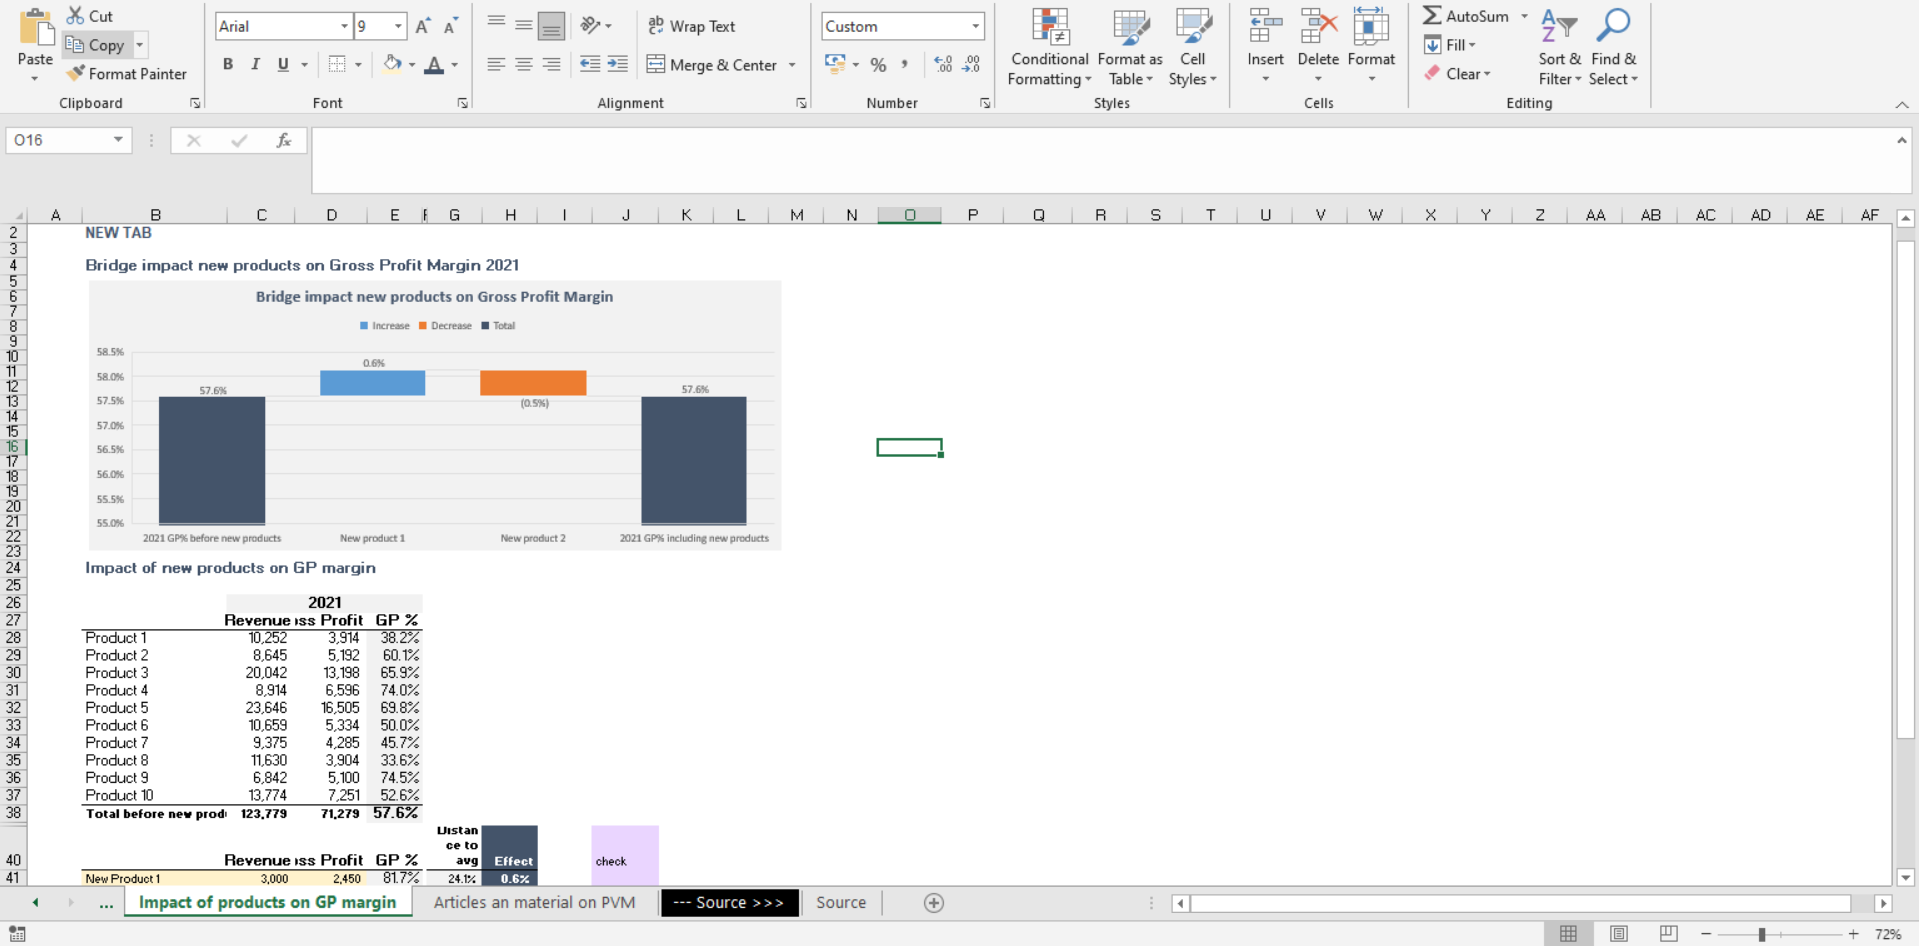
Price Volume Mix Analysis (PVM) excel template with Charts - Sales mix and Gross Profit by Product
Price volume mix analysis (PVM) excel template to better understand your sales and improve pricing strategy.
Consultant - M&A, Modelling and Financial expert - M&A director at HoriZen CapitalFollow 62
Further information
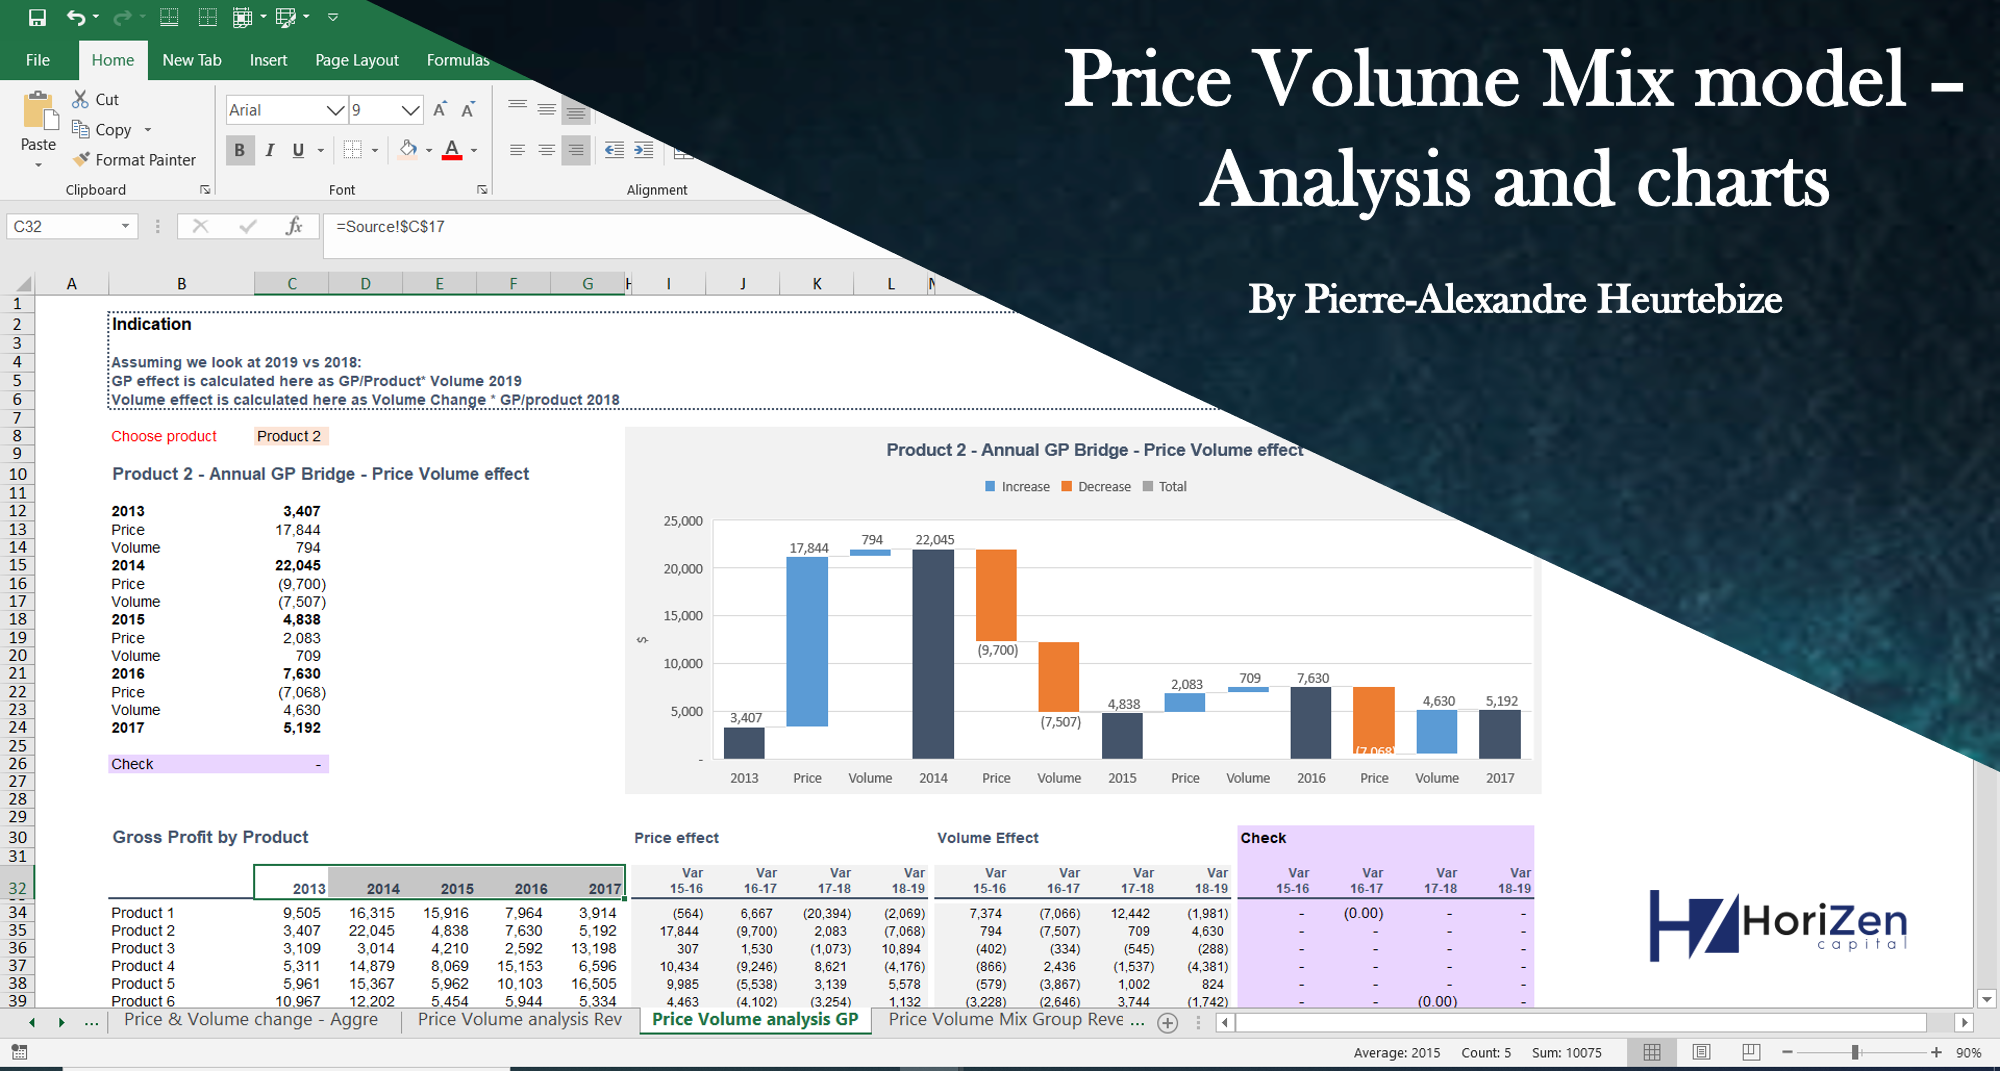
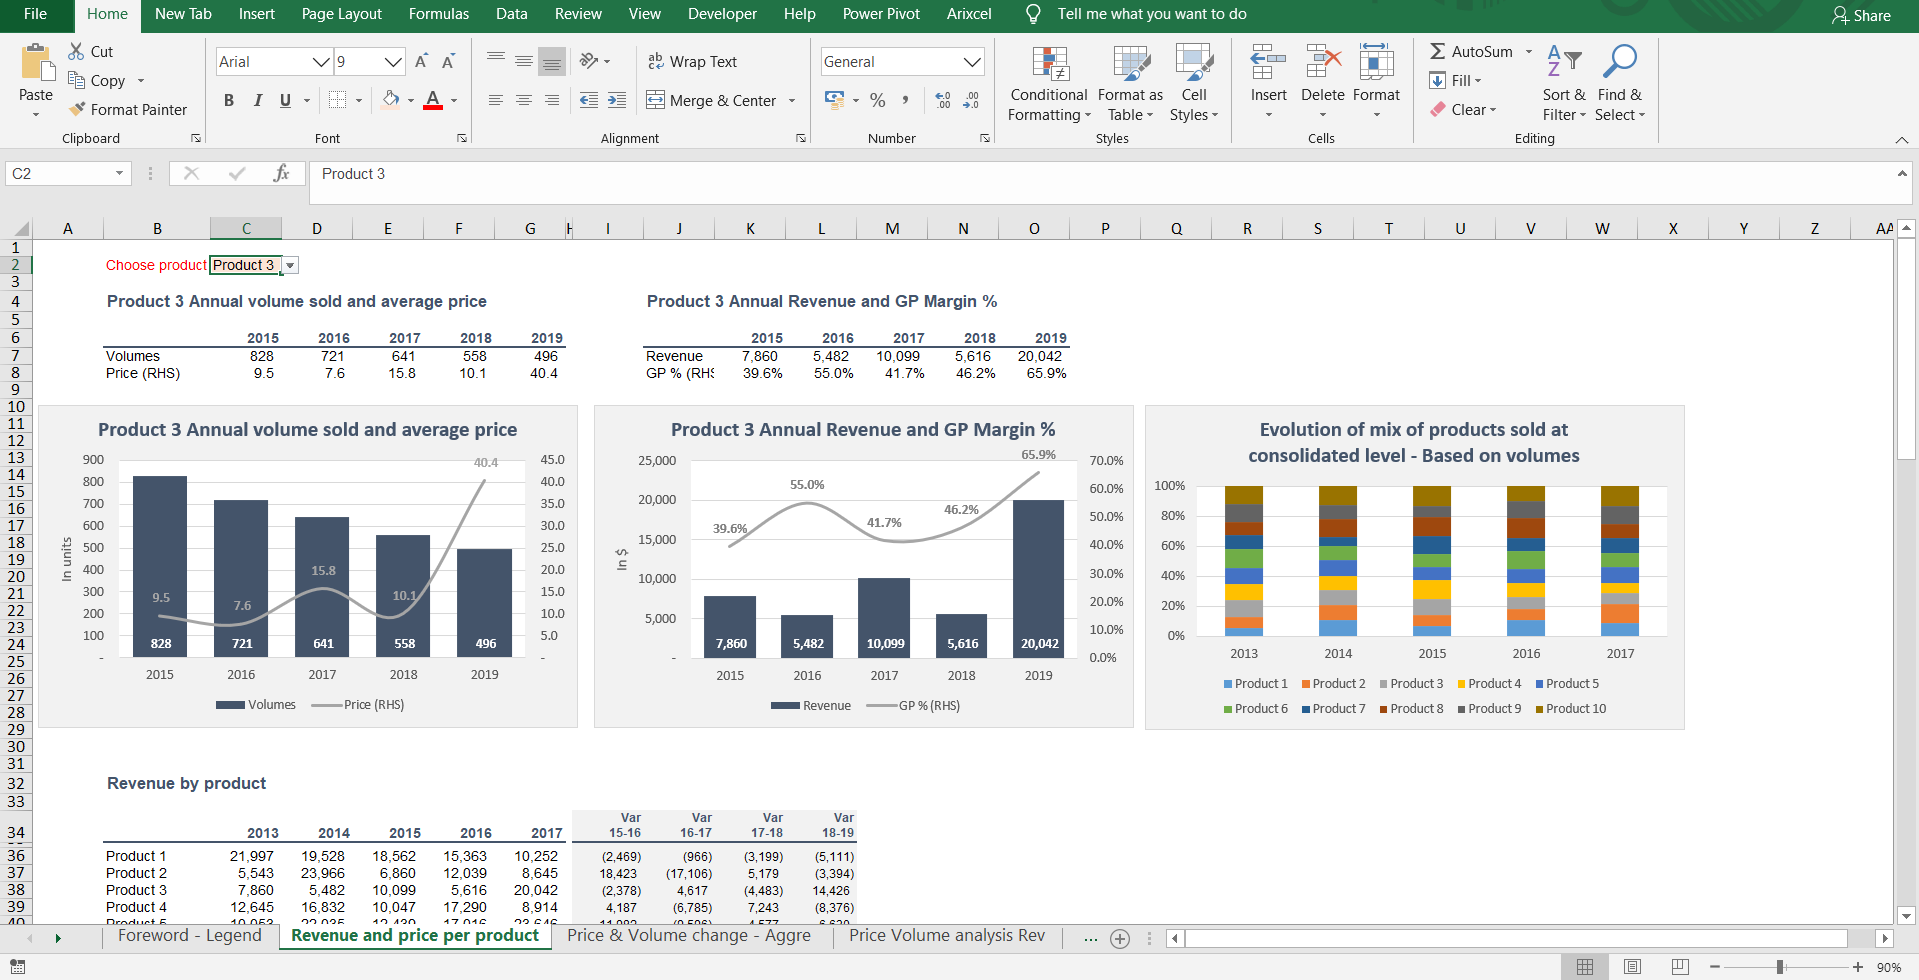
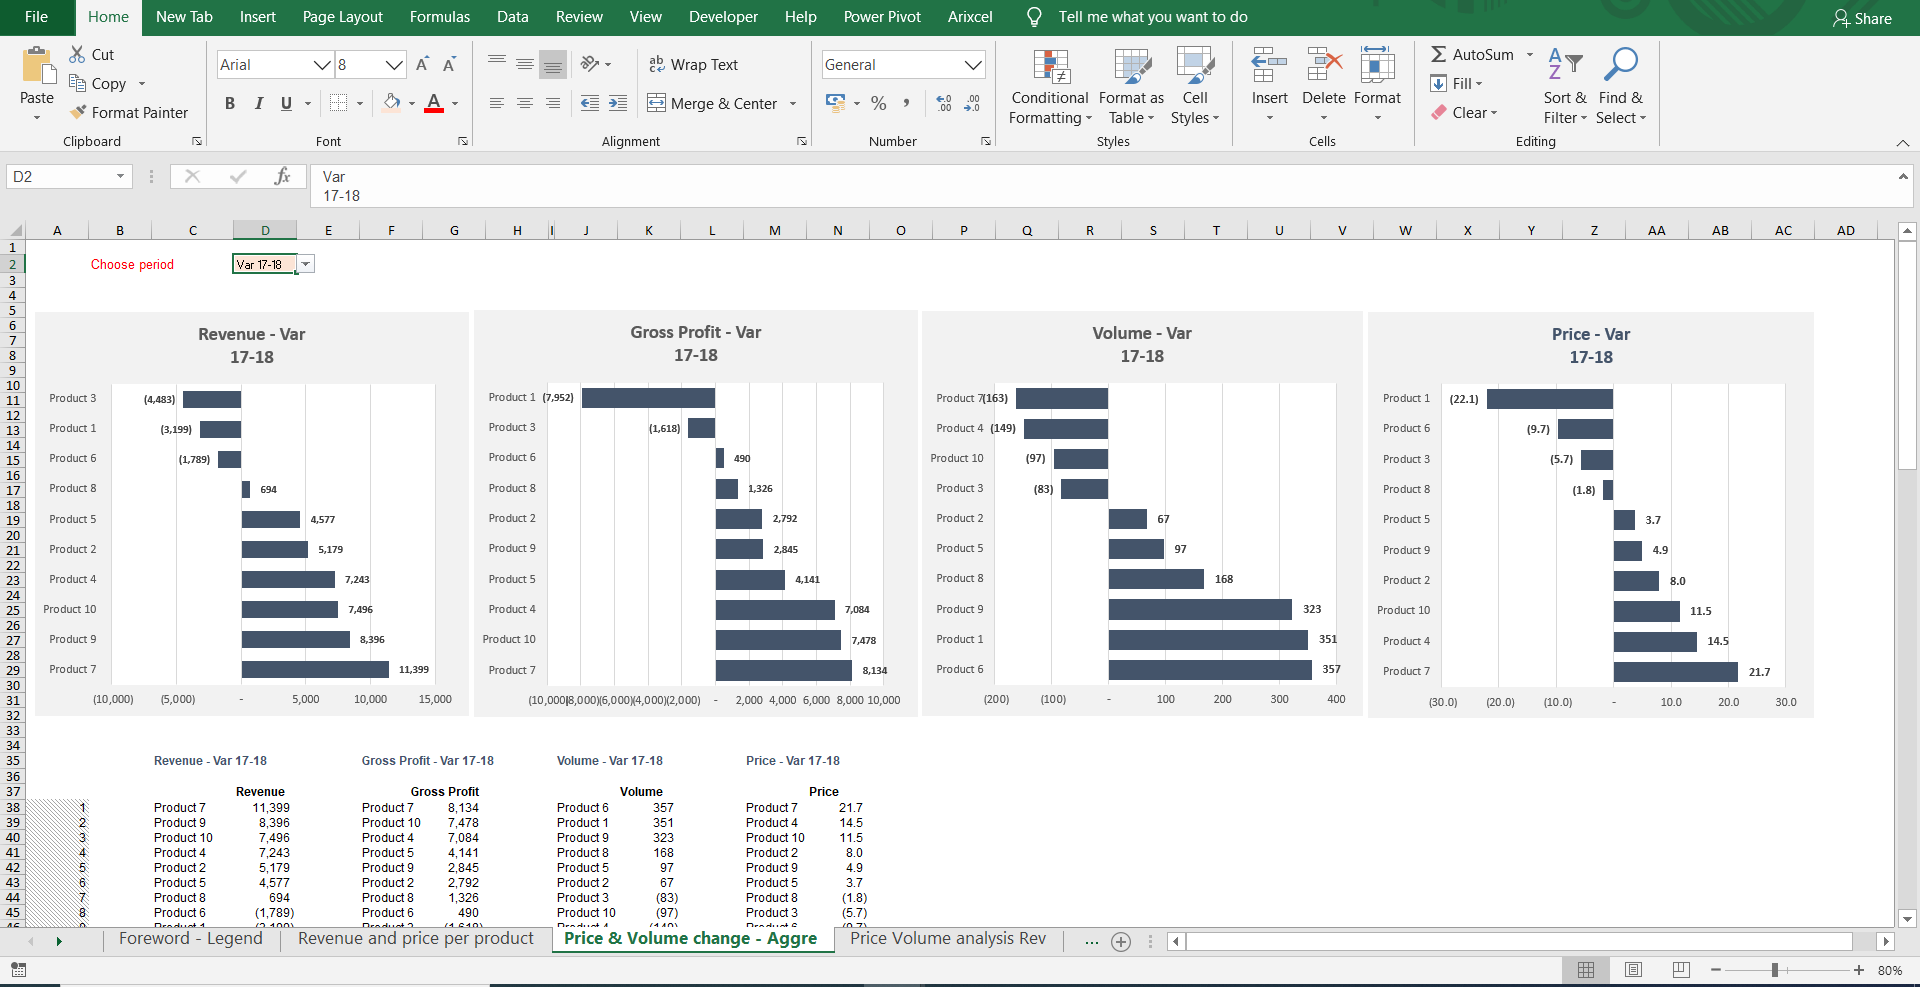
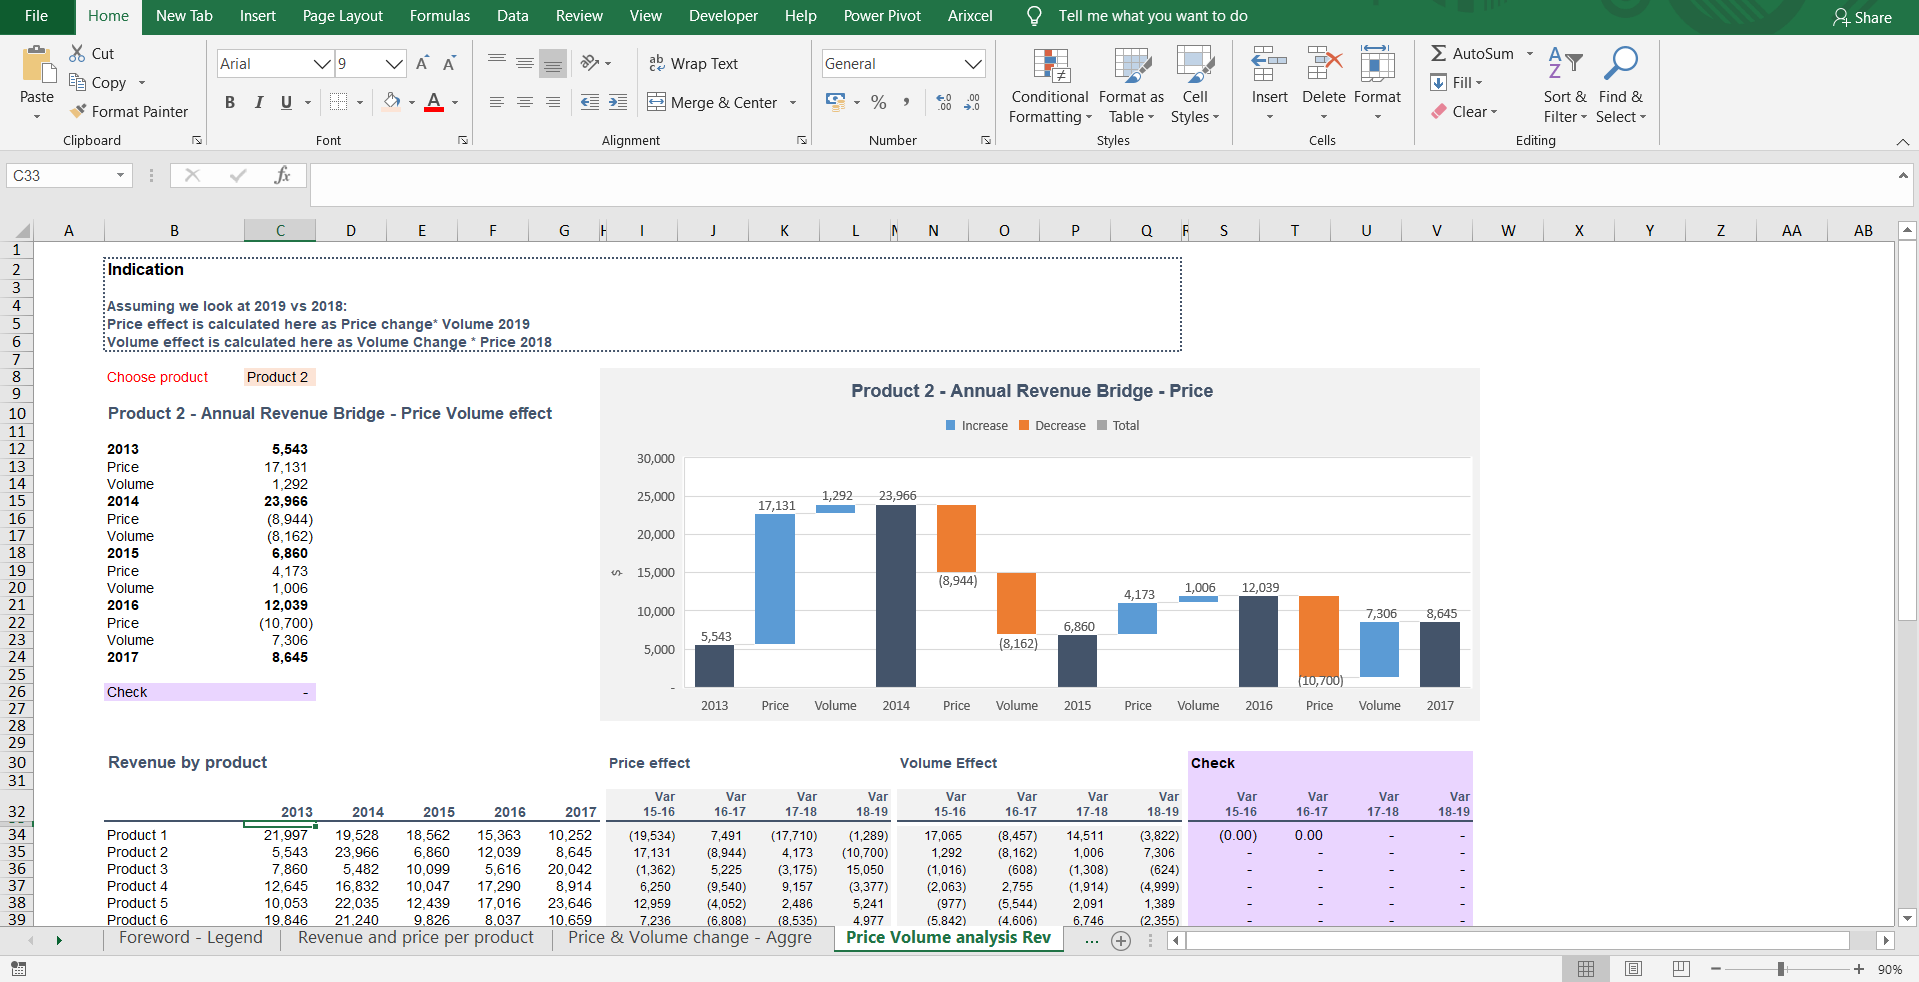
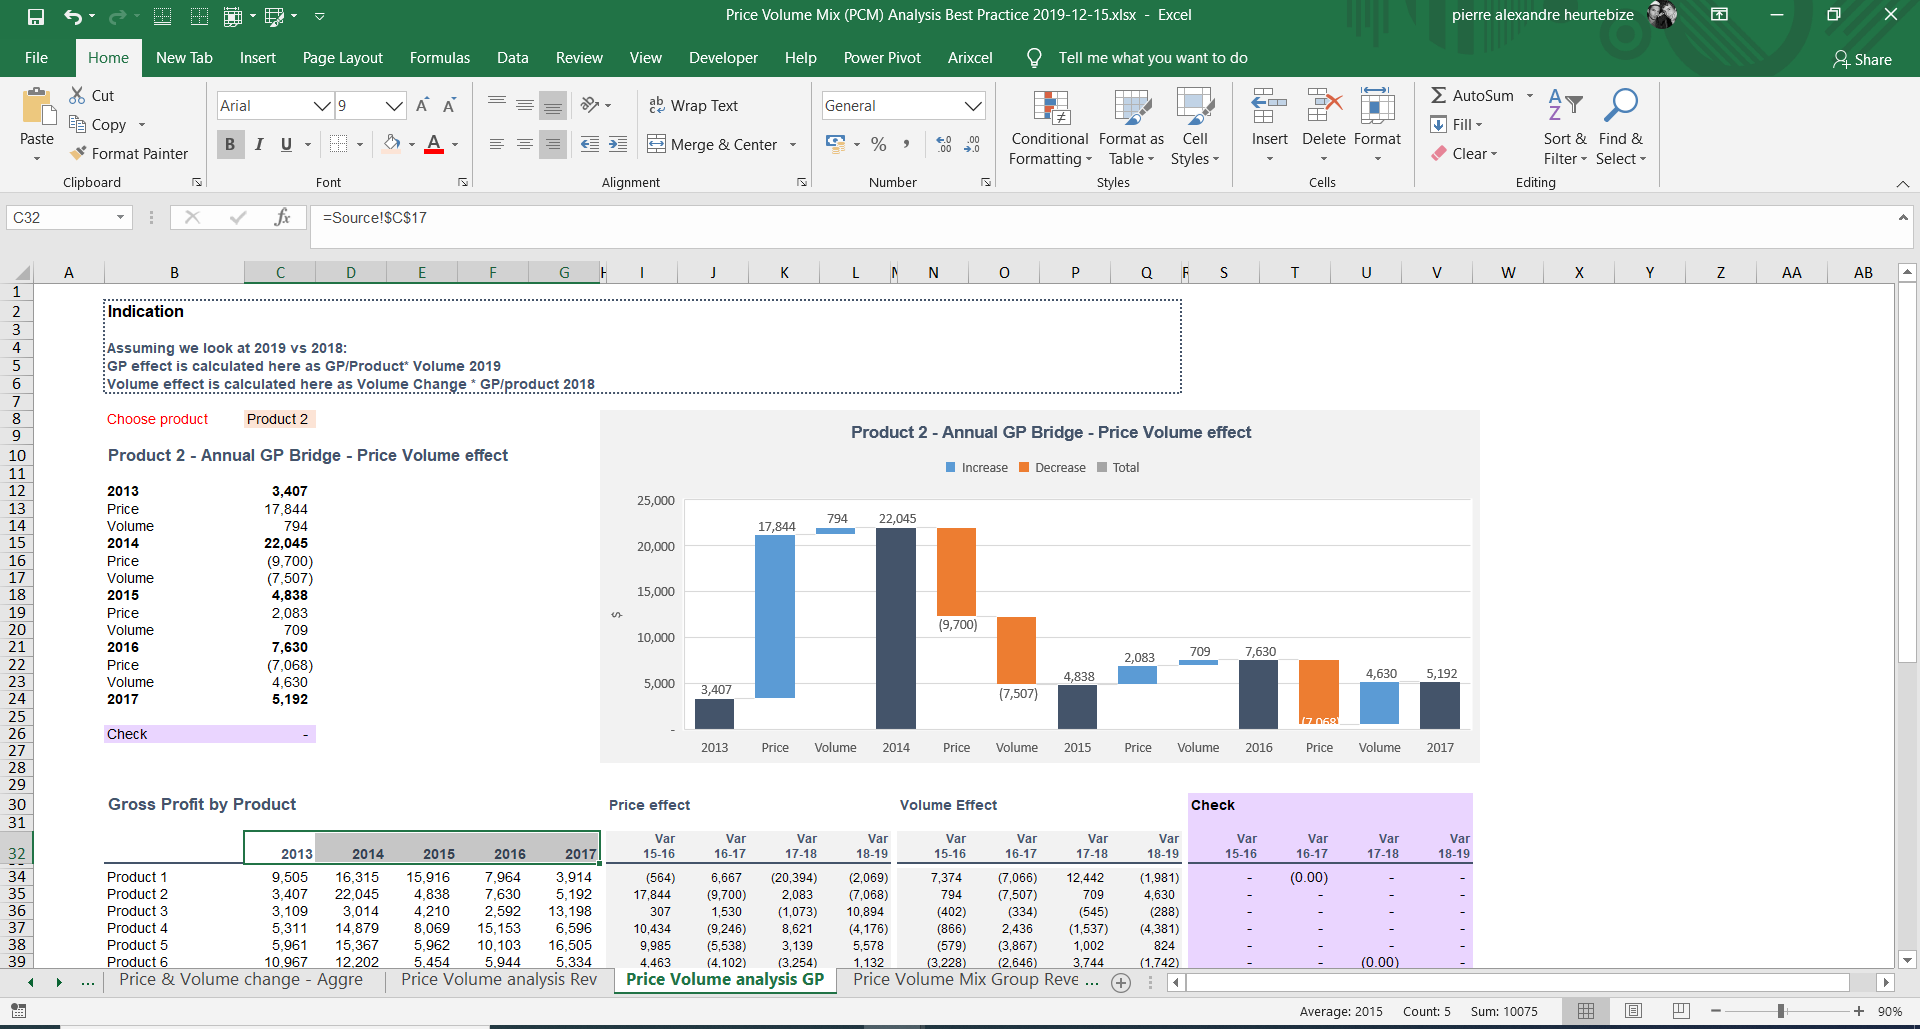
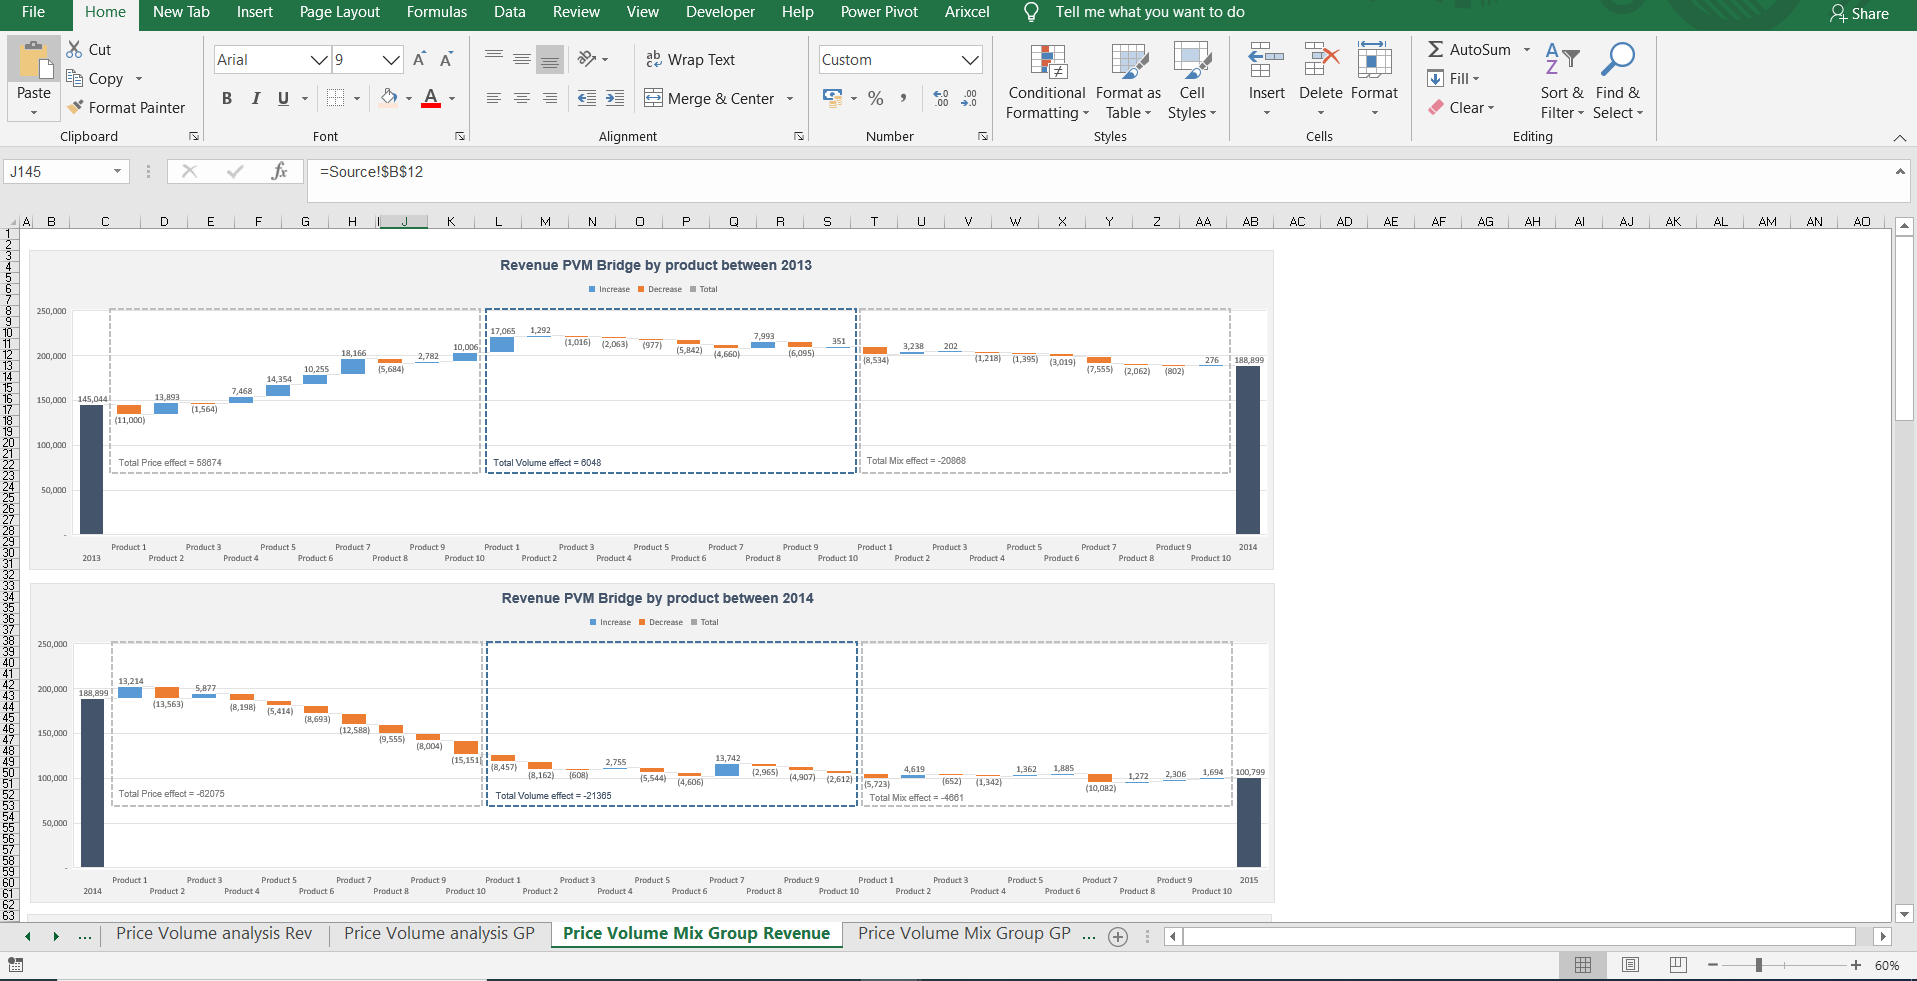
Give a strong and automated tool to analyse revenue and gross profit change on a product by product level and efficiently understand the impact of the change in price, change in volume and change in mix on your top line and your gross profit.
A business with multiple products. Retail, marketplace, services companies.
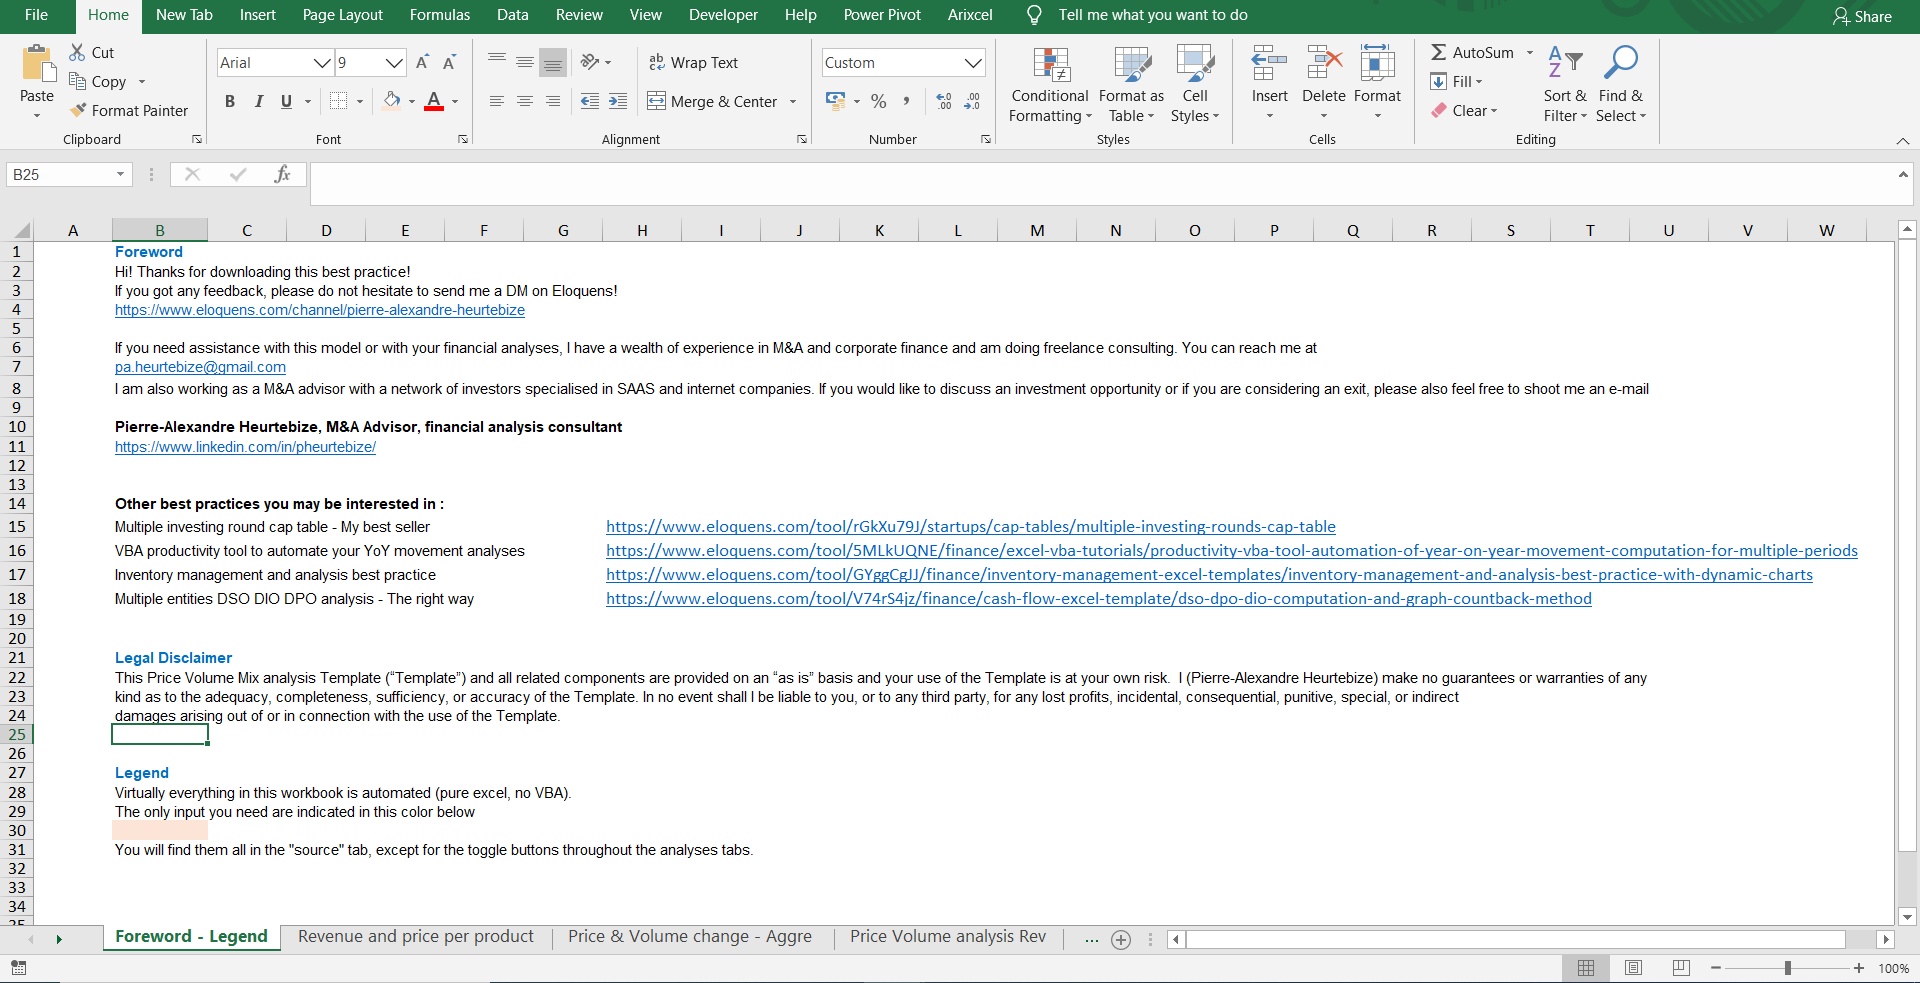
If you are using a microsoft excel version older than 2016
