
Originally published: 20/05/2020 16:11
Publication number: ELQ-59734-1
View all versions & Certificate
Publication number: ELQ-59734-1
View all versions & Certificate

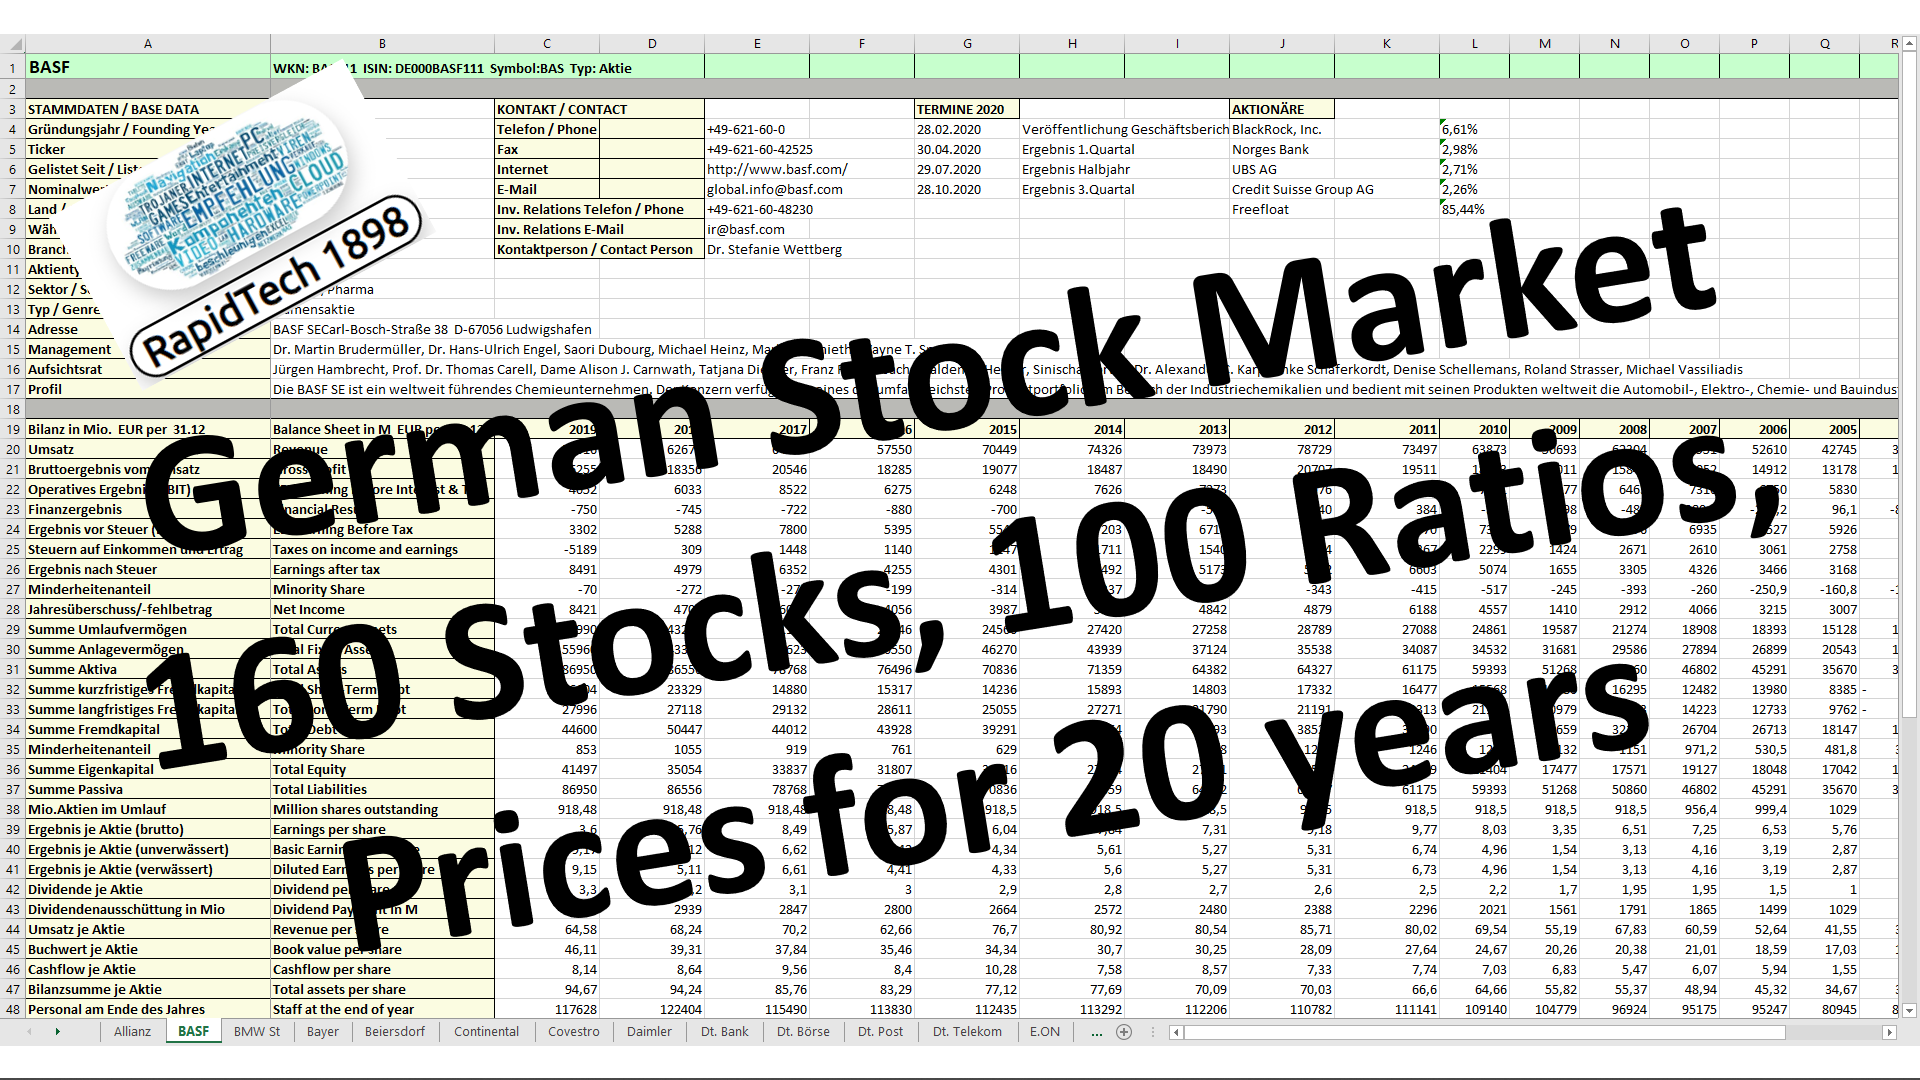
Stock Valuation - German Stock Market
All you need to know about the German Stock Market
Description
Here you can find everything you need to know about the US Stock Market.
More than 150 indiviudal stocks with 100 ratios and historical prices for up to 30 years back.
Perfect for backtesting and analyzing your individual strategy.
Values are from the company reports in EUR - the stock prices are based on the informations from different stock exchanges
It consists of 2 Excel Sheets -
1) Stock Data
2) Stock Prices
In every Excel-Sheet you have an Index-Overview, where you can jump directly to the indiviudal stock you are interested in - and also have a "Back to INDEX" field in every Stock Worksheet.
See the following video for a explenation for the handling:
https://youtu.be/oyscNEdV6vY
In the STOCK DATA Excel sheet you can see all the Base Data for the stock title.
US-Symbol: for example AMZN for Amazon
ISIN-Number: for example US0231351067 for Amazon
Werpapierkennnummer: for example 906866 for Amazon
Base Data:
- Founding Year
- Ticker
- Country
- Currency
- Industry
- Sector
- Address
- Management
- Board
- Beschreibung in German
- Profile in English
Contact Informationss:
- Phone
- Fax
- Internet
- Investor Relations Phone
- Investor Relations E-Mail
- Contact Person
Upcoming Events:
- Quarterly Results
- Publications of Annual Reports
- Annual General Meetings
- Dividend Payouts
Shareholders in %
- Biggest Individual Shareholders
- Freefloat
Ratios:
- Total Income
- EBIT Earning Before Interest & Tax-
- Financial Result
- EBT Earning Before Tax
- Taxes on income and earnings
- Earnings after tax
- Minority Share
- Net Income
- Total Assets
- Total Debt Capital
- Minority Share
- Total Equity
- Total Liabilities
- Million shares outstanding
- Subscribed Capital in M
- Earnings per share
- Basic Earnings per share
- Diluted Earnings per share
- Dividend per share
Dividend Payment in M
- Income
- Book value per share
- Cashflow per share
- Total assets per share
- Staff at the end of year
- Personnel expenses in M
- Effort per employee
- Income per employee
- Gross Profit per employee
- Earnings per employee
- PE (price/earnings)
- PS (price/sales)
- PB (price/book value)
- PC (prce/cashflow)
- Dividend Yield in %
- Return on profit in %
- Return on Equity in %
- Total Return on Investment in %
- Equity Ratio in %
- Debt Ratio in %
- Finance Gearing in %
- Current Assets Ratio in %
- Net Profit Marge in %
- EBIT Marge in %
- Asset Turnover in %
- Non-Current Assets Ratio in %
- ROA Return on Assets in %
- ROCE Return on Cap. Empl. in %
- Equity to Fixed Assets in %
- Current Ratio in %
- Operating Cashflow in M
- Share Buyback in M
- Revenue Growth 1Y in %
- Revenue Growth 3Y in %
- Revenue Growth 5Y in %
- Revenue Growth 10Y in %
- Earnings Growth 1Y in %
- Earnings Growth 3Y in %
- Earnings Growth 5Y in %
- Earnings Growth 10Y in %
- KGW Kurs/Gewinn/Wachstum
- EBIT Growth 1Y in %
- EBIT Growth 3Y in %
- EBIT Growth 5Y in %
- EBIT Growth 10Y in %
- Op.Cashflow Wachstum 1Y in %
- Op.Cashflow Wachstum 3Y in %
- Op.Cashflow Wachstum 5Y in %
- Op.Cashflow Wachstum 10Y in %
- Working Capital in M
In the PRICE DATA Excel sheet you can see the Historic Stock Prices and some metrics on daily basis for the stock title.
- Price
- MarketCap
- PE Ratio (Price / Earnings)
- PS Ratio (Price / Sales)
- PB Ratio (Price / Book)
- PC Ratio (Price / Cashflow)
- Dividend Yield
- Initial Yield
- PEG Rato (Price / Earnings / Growth)
This Best Practice includes
2 Excel Sheets (one for prices and one for ratios)
