Originally published: 01/03/2019 11:21
Last version published: 06/06/2023 08:17
Publication number: ELQ-46892-9
View all versions & Certificate
Last version published: 06/06/2023 08:17
Publication number: ELQ-46892-9
View all versions & Certificate

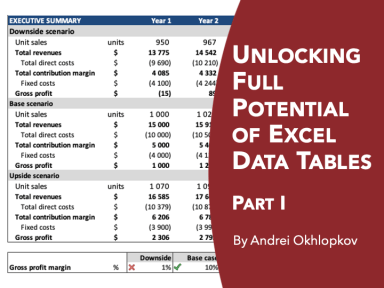
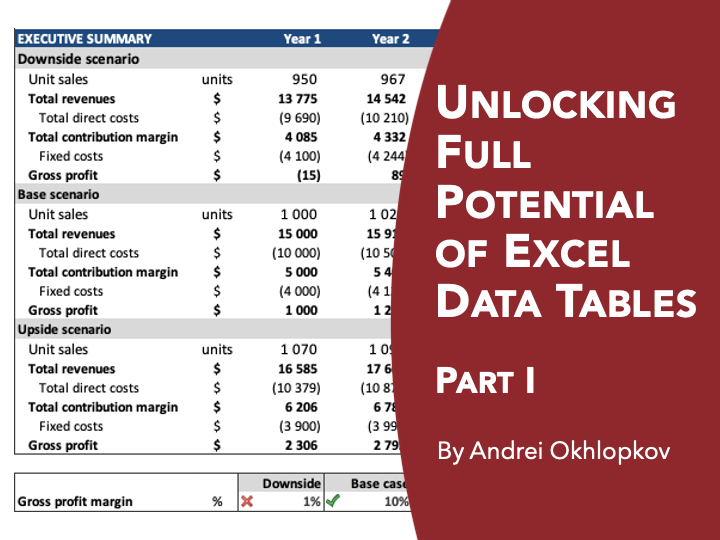
Unlocking Full Potential of Excel Data Tables (Part 1)
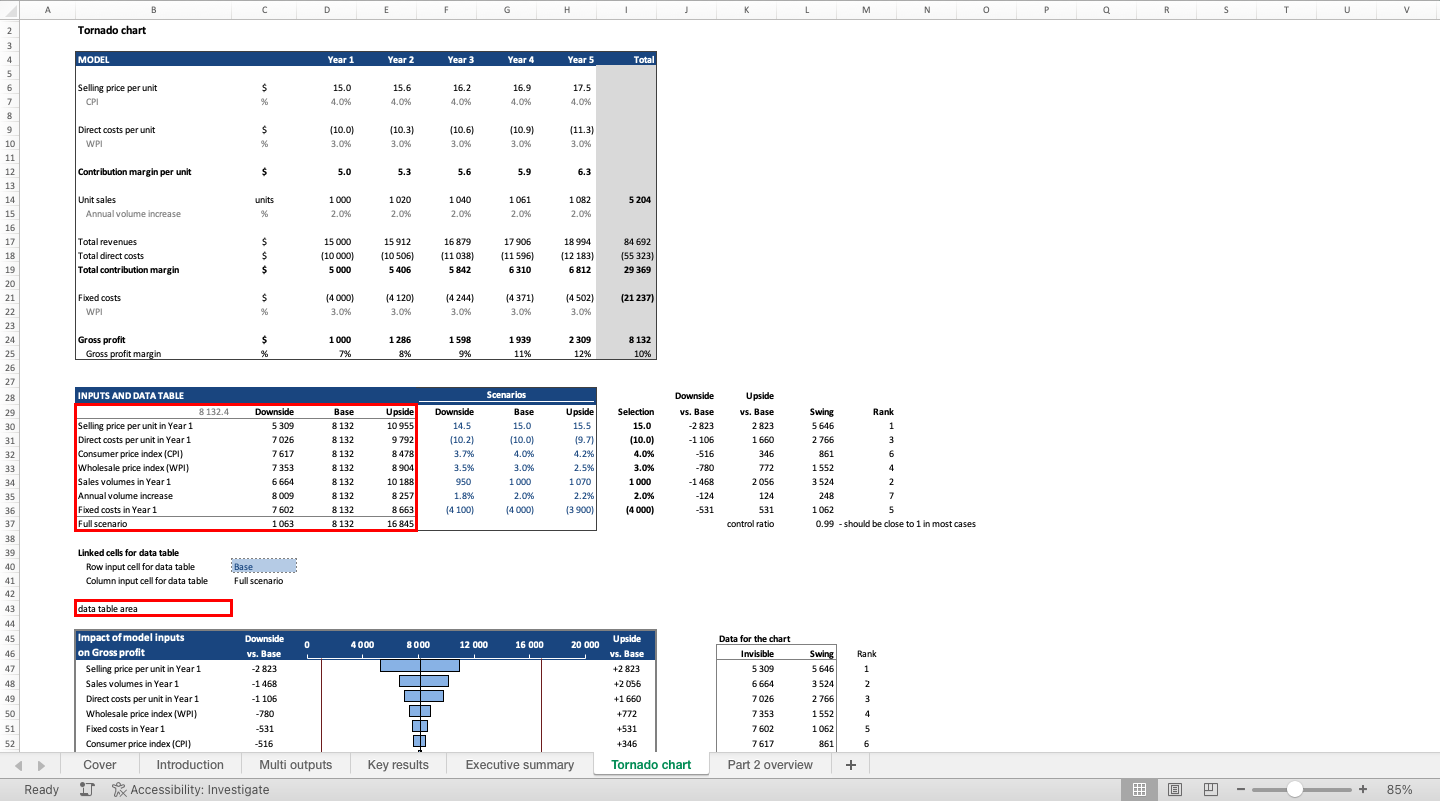
This publication explains advanced methods of using data tables for sensitivity analysis in financial models
Further information
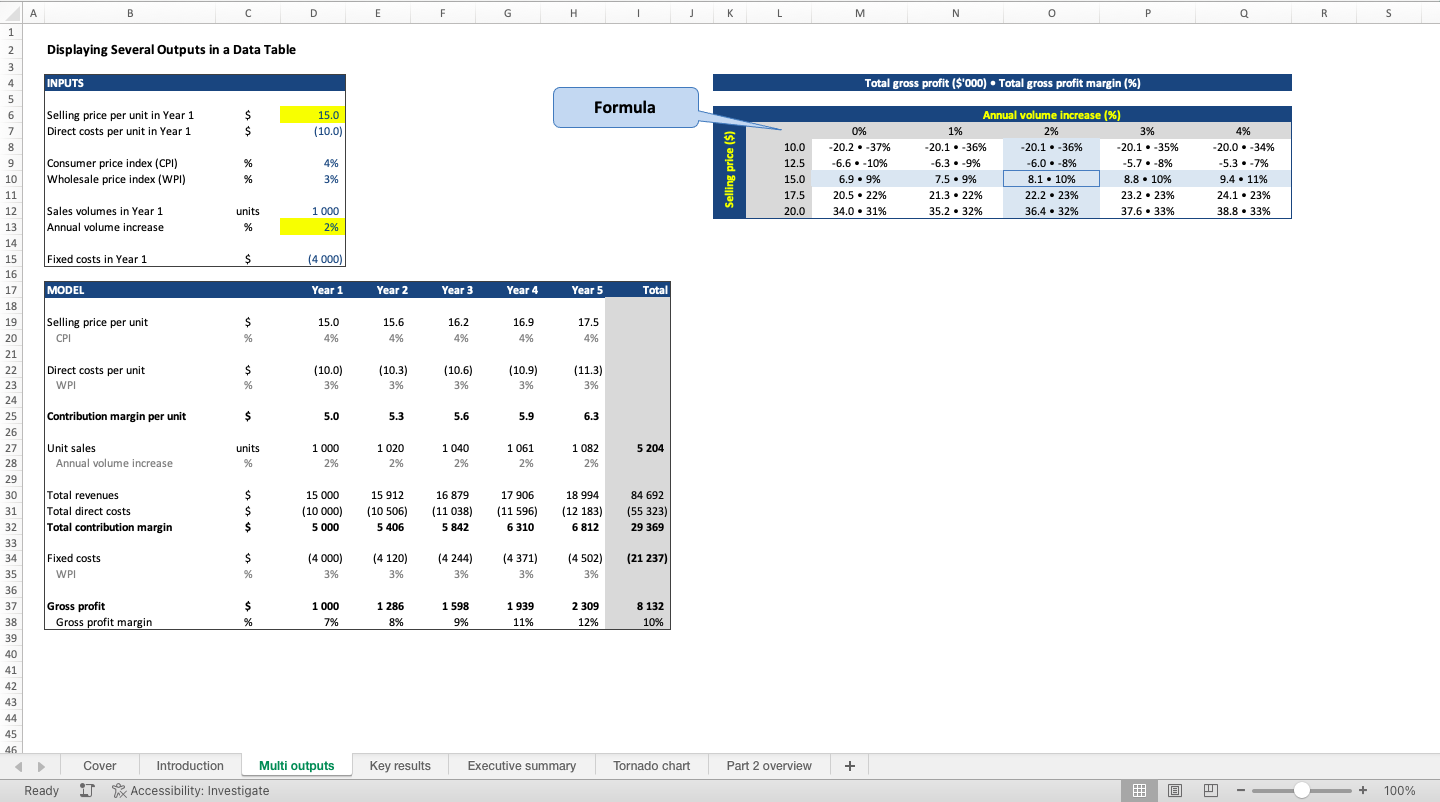
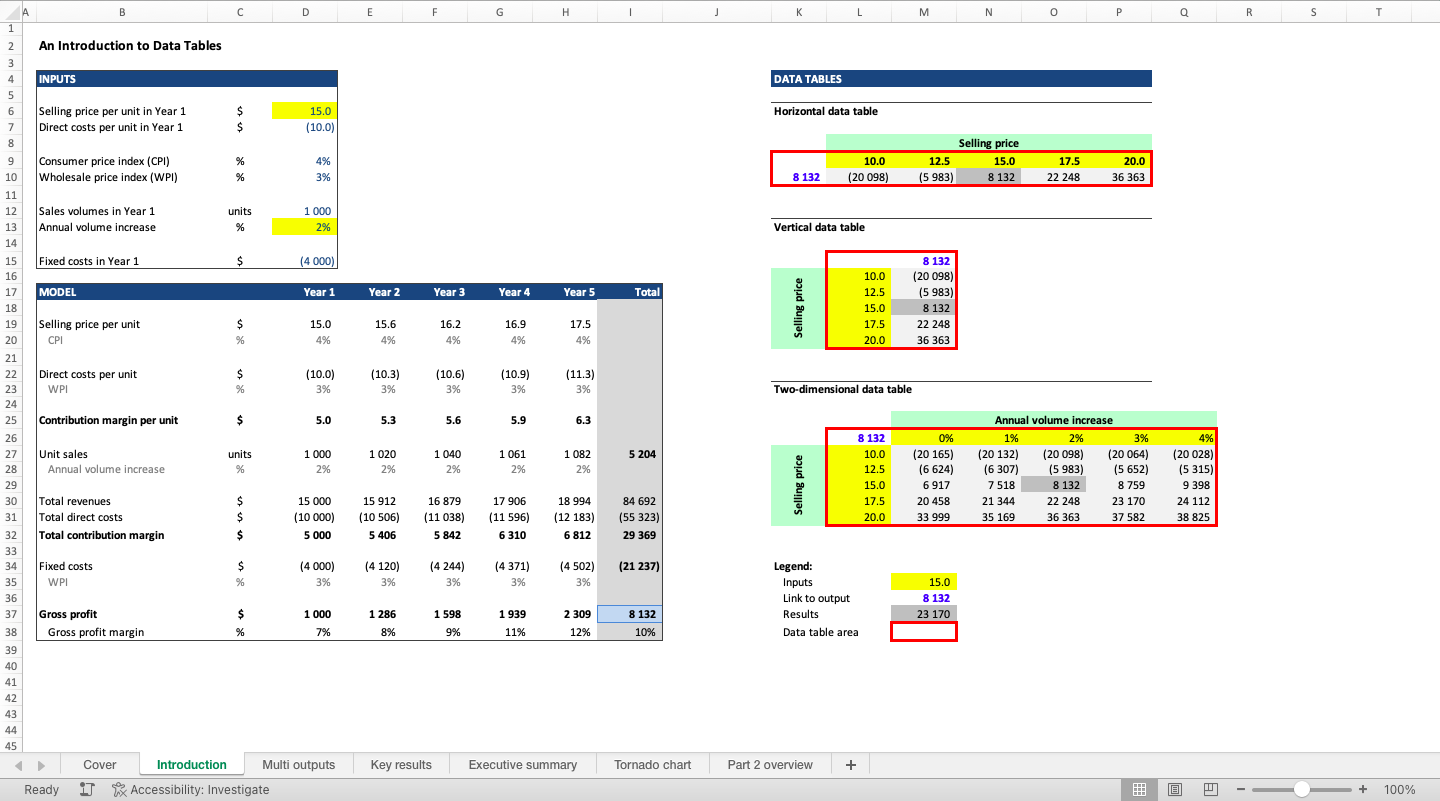
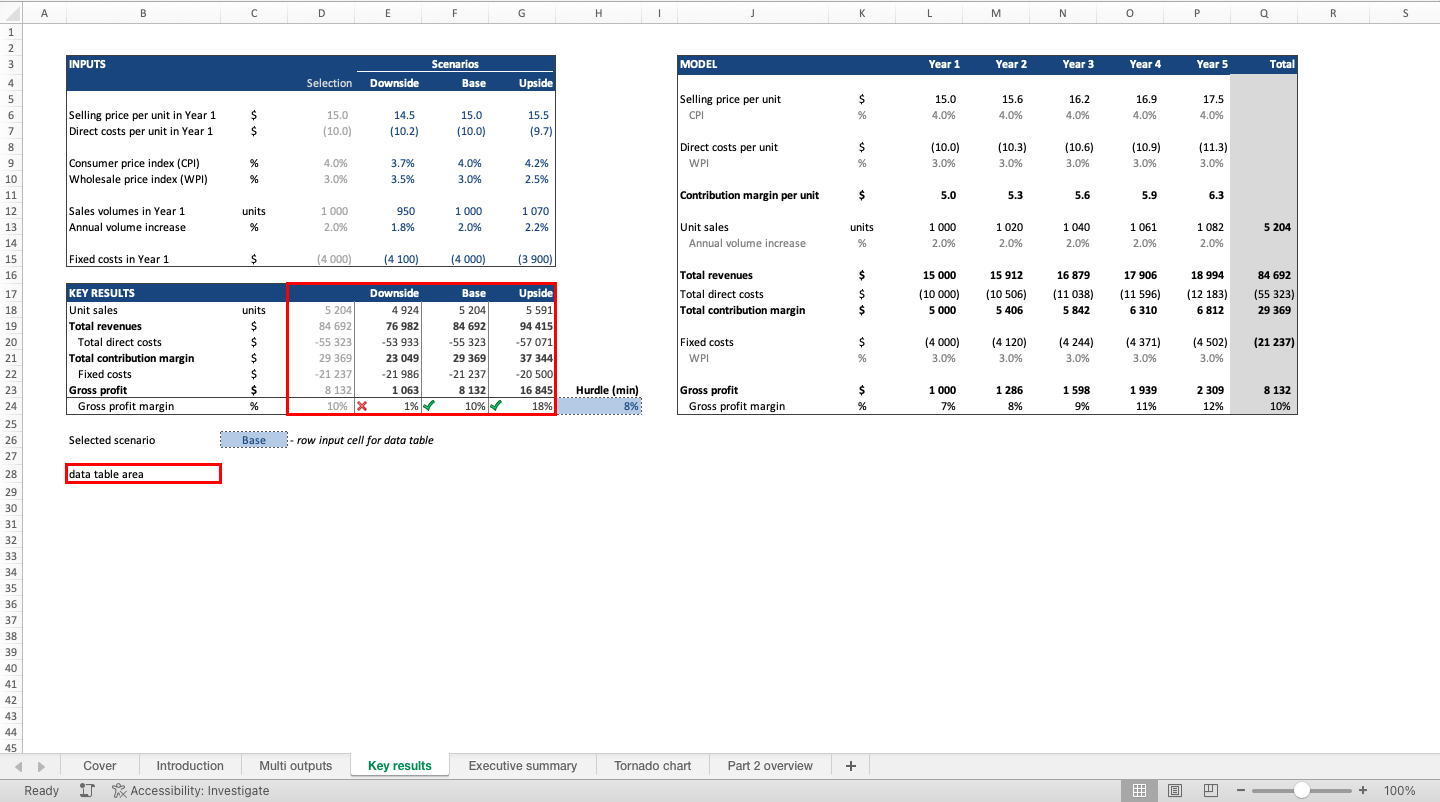
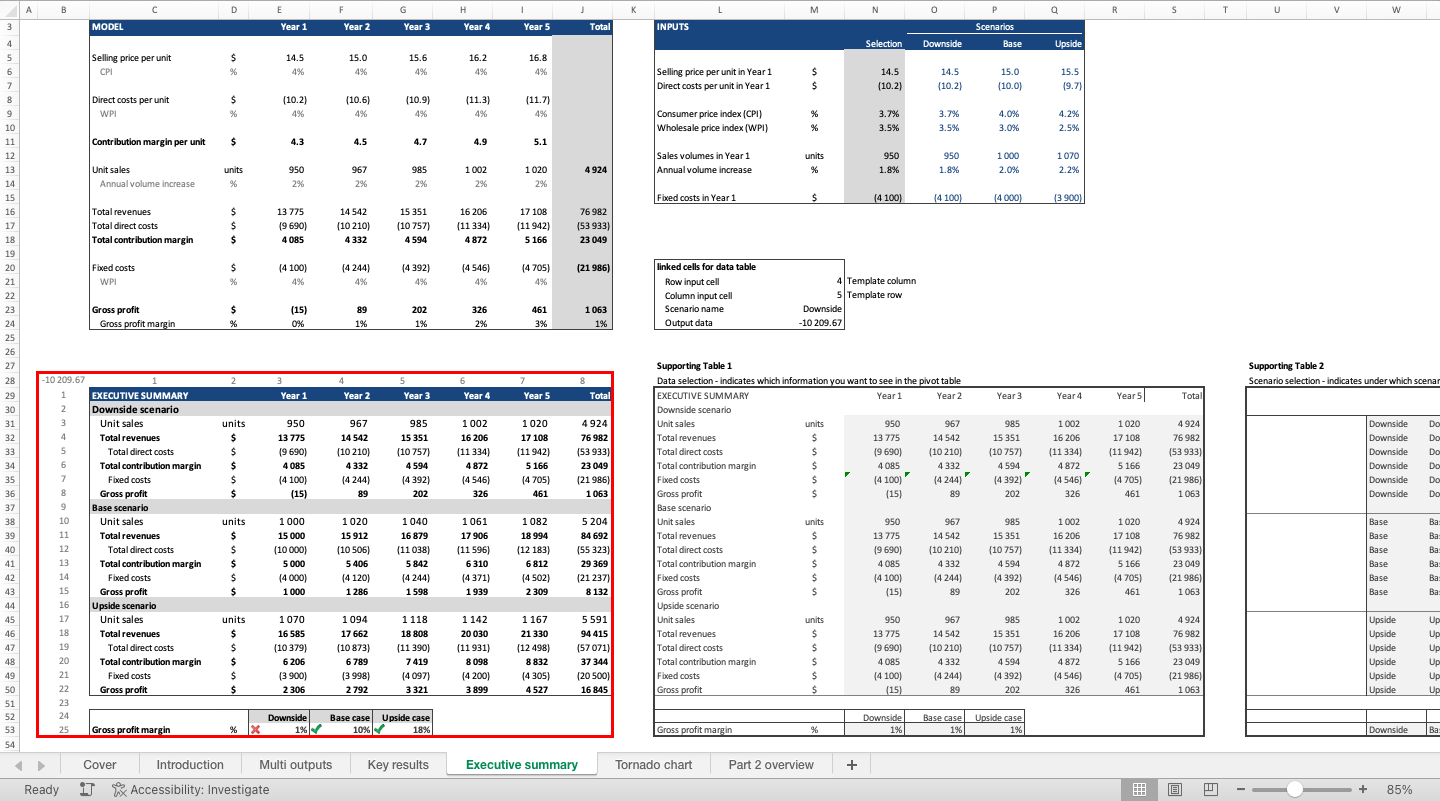
The tool allows to see the outcomes of a financial models simultaneously under several scenarios
Financial models with multiple scenarios
