Originally published: 20/10/2019 12:49
Last version published: 18/09/2023 08:51
Publication number: ELQ-16605-6
View all versions & Certificate
Last version published: 18/09/2023 08:51
Publication number: ELQ-16605-6
View all versions & Certificate

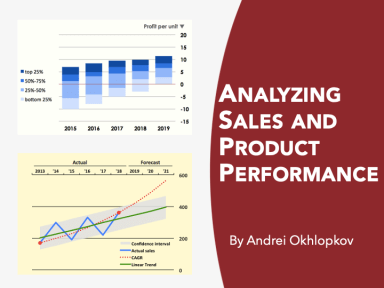
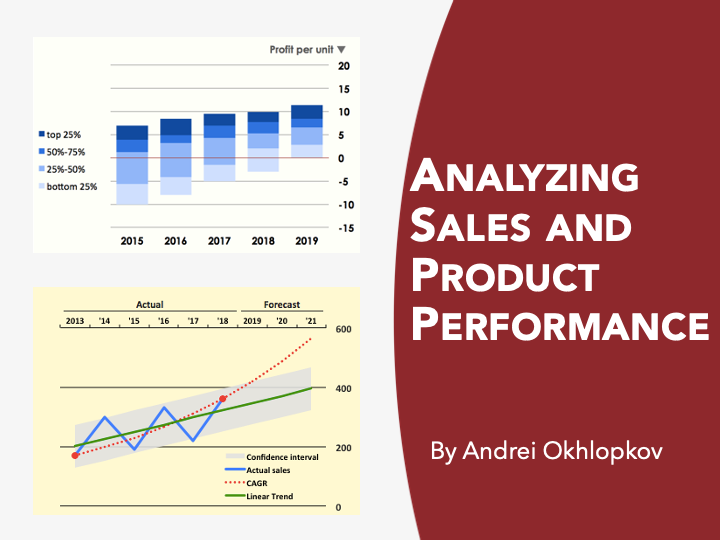
Analyzing Sales and Product Performance
Tools to analyse sales, portfolio performance, seasonal variations, price-volume-mix factors
Further information
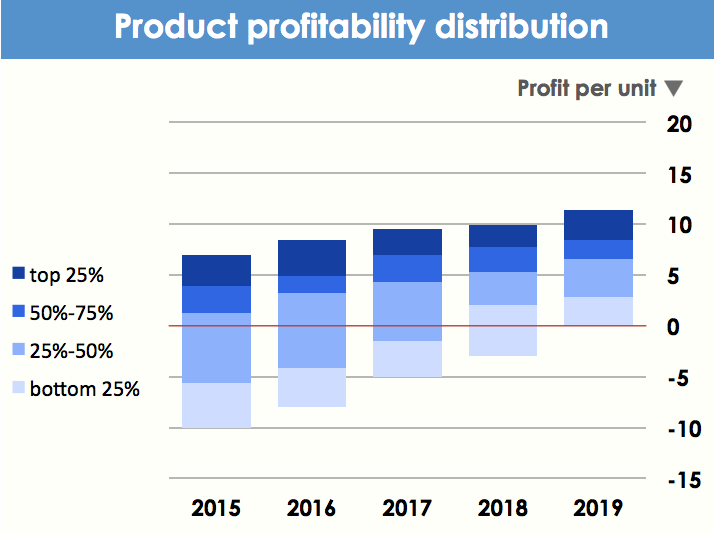
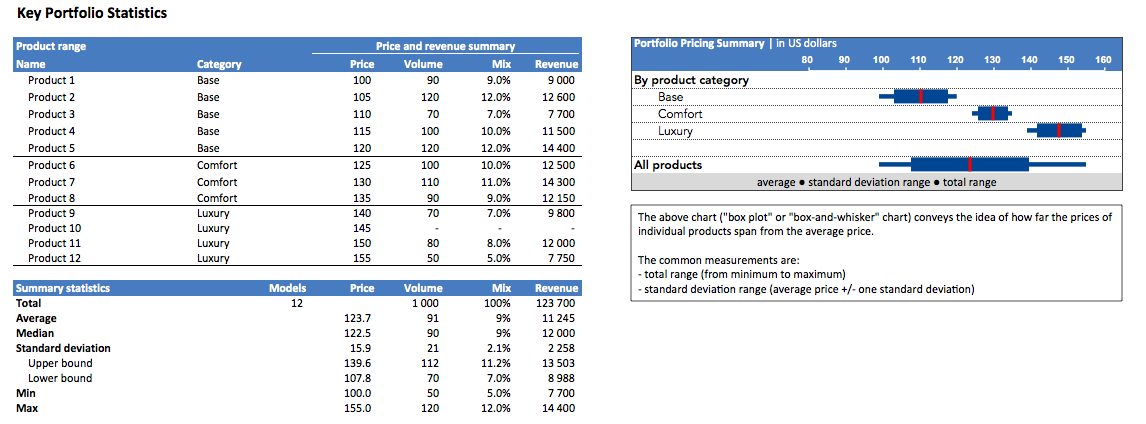
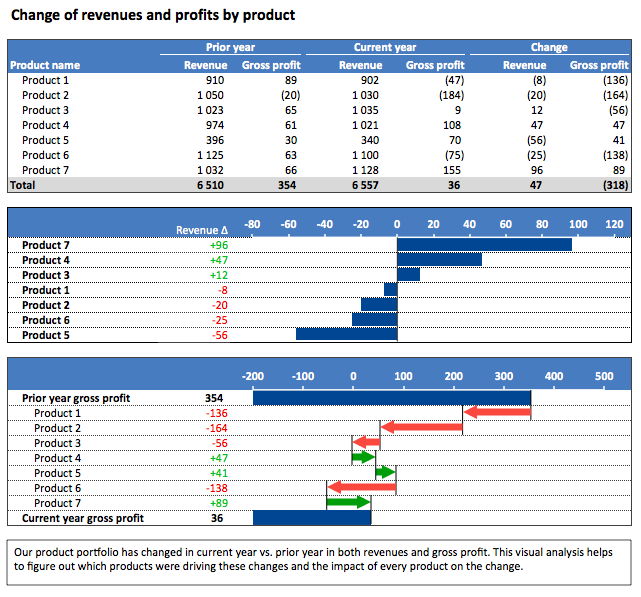
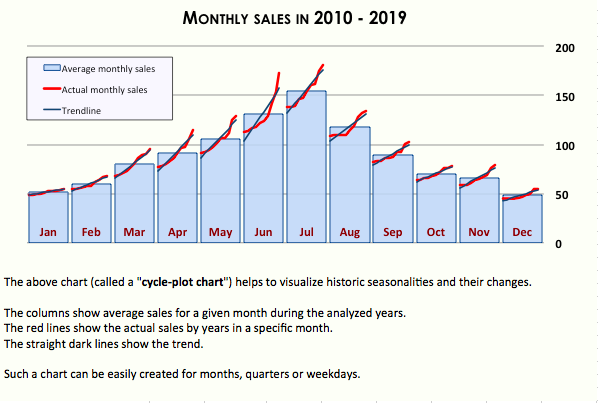
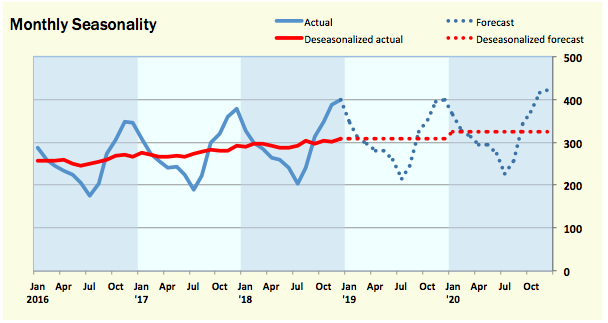
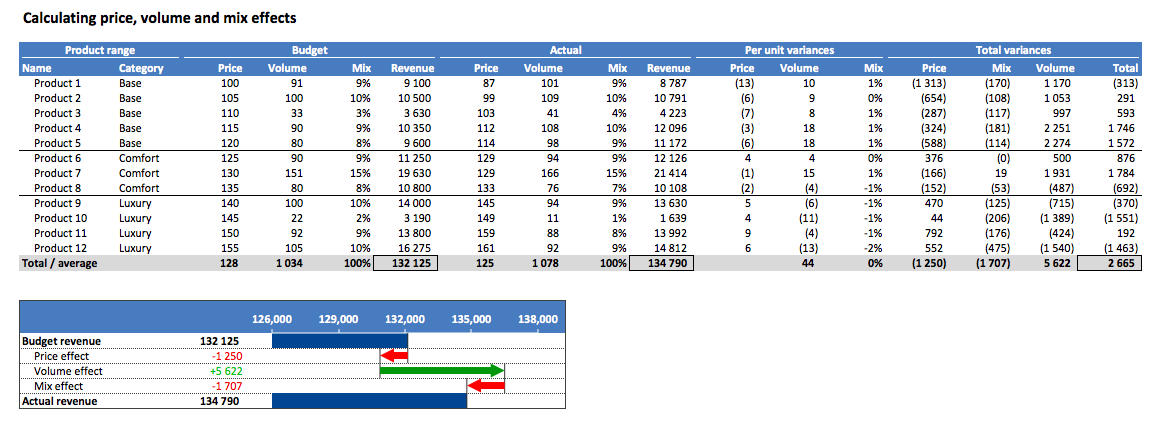
Analyse historic sales data, understand seasonality patterns, calculate price, volume and mix effect on revenue (profit) variations, develop proper forecasts
When a wide-scope analysis of sales is required
n/a
