Originally published: 06/09/2021 08:31
Last version published: 07/10/2021 15:47
Publication number: ELQ-64234-3
View all versions & Certificate
Last version published: 07/10/2021 15:47
Publication number: ELQ-64234-3
View all versions & Certificate

Price Volume Mix Excel Template
Price Volume mix Analysis in Excel with additional categories (Mix variance, new products and discontinued product) + compare custom periods + easy data load
price volume mix analysisprice volume analysisdashboard price volumeimpact priceimpact volumeprice analysispricing modelssales mixvolume price mix analysis
Description
When looking at revenue or profit variance, a simple analysis can be misleading since we have different things that can impact the result: change in prices, change in quantity sold, change the volume mix of products etc.
To have a better insight about what is driving up or down revenues or profits, a Price Volume Mix Analysis is a very useful way. Compared to more traditional Price Volume Mix Analyses, in this template you have an advanced calculation that adds more categories to have better insights:
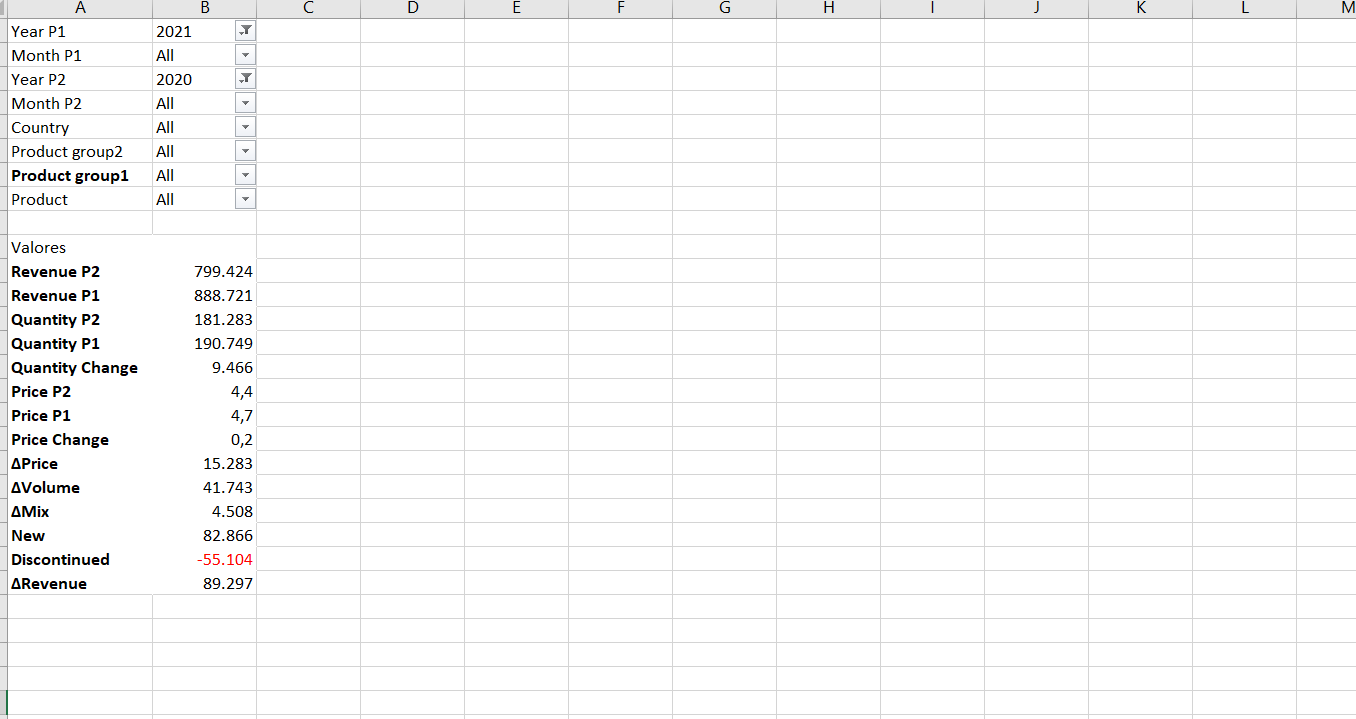
- Prince Variance: impact on revenue due to price changes
- Volume Variance: impact on revenue due to volume changes
- Mix Variance: impact on revenue due to a change in the mix of products
- New: impact on revenue due to new products
- Discontinued: impact on revenue due to products sold in the previous period but not in the present one (or the reference one)
Besides, this template has other two advantages compared to other templates:
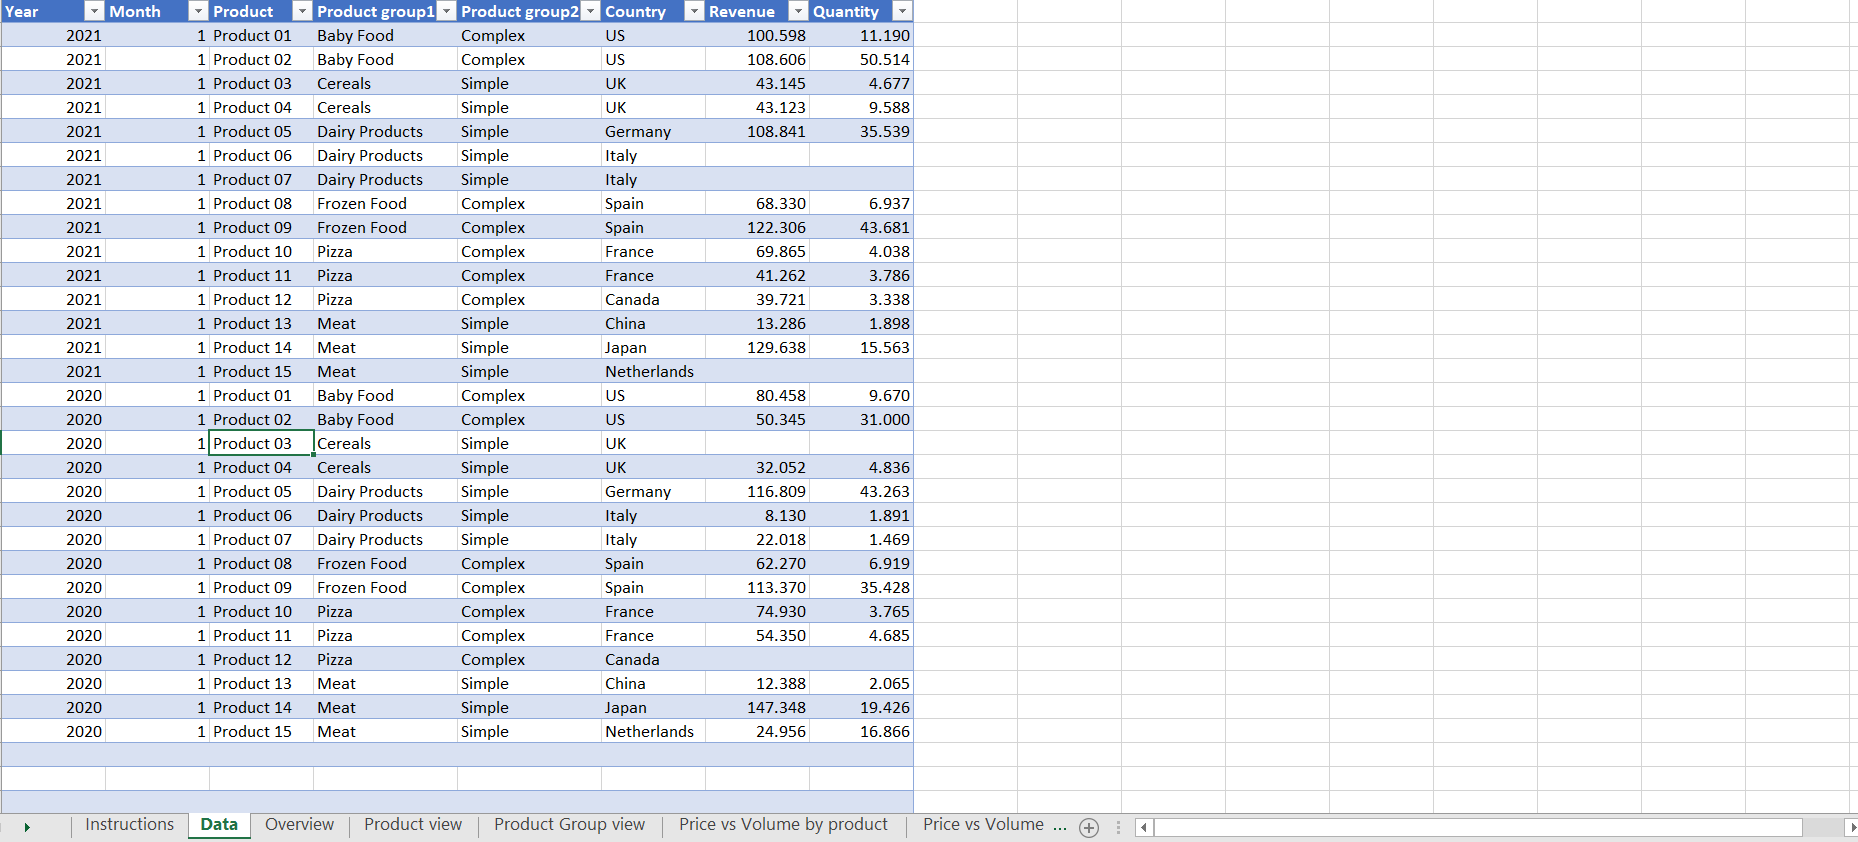
- the Data entry uses a table similar to the data extraction you may have from transactional systems or in your reports. It is a transactional format where you load a column with dates besides other columns of data. This means that you don't have to specify which period you want to compare before uploading your data, you can decide and customize it later.
- Once the data is updated, you can select with filters Period 1 and Period 2 as the reference and comparing period. Besides, you have other filters in the report to segment your results (product groups, country etc.)
- You can exploit the data model by using a free pivot table to create additional tables and charts if you need to.
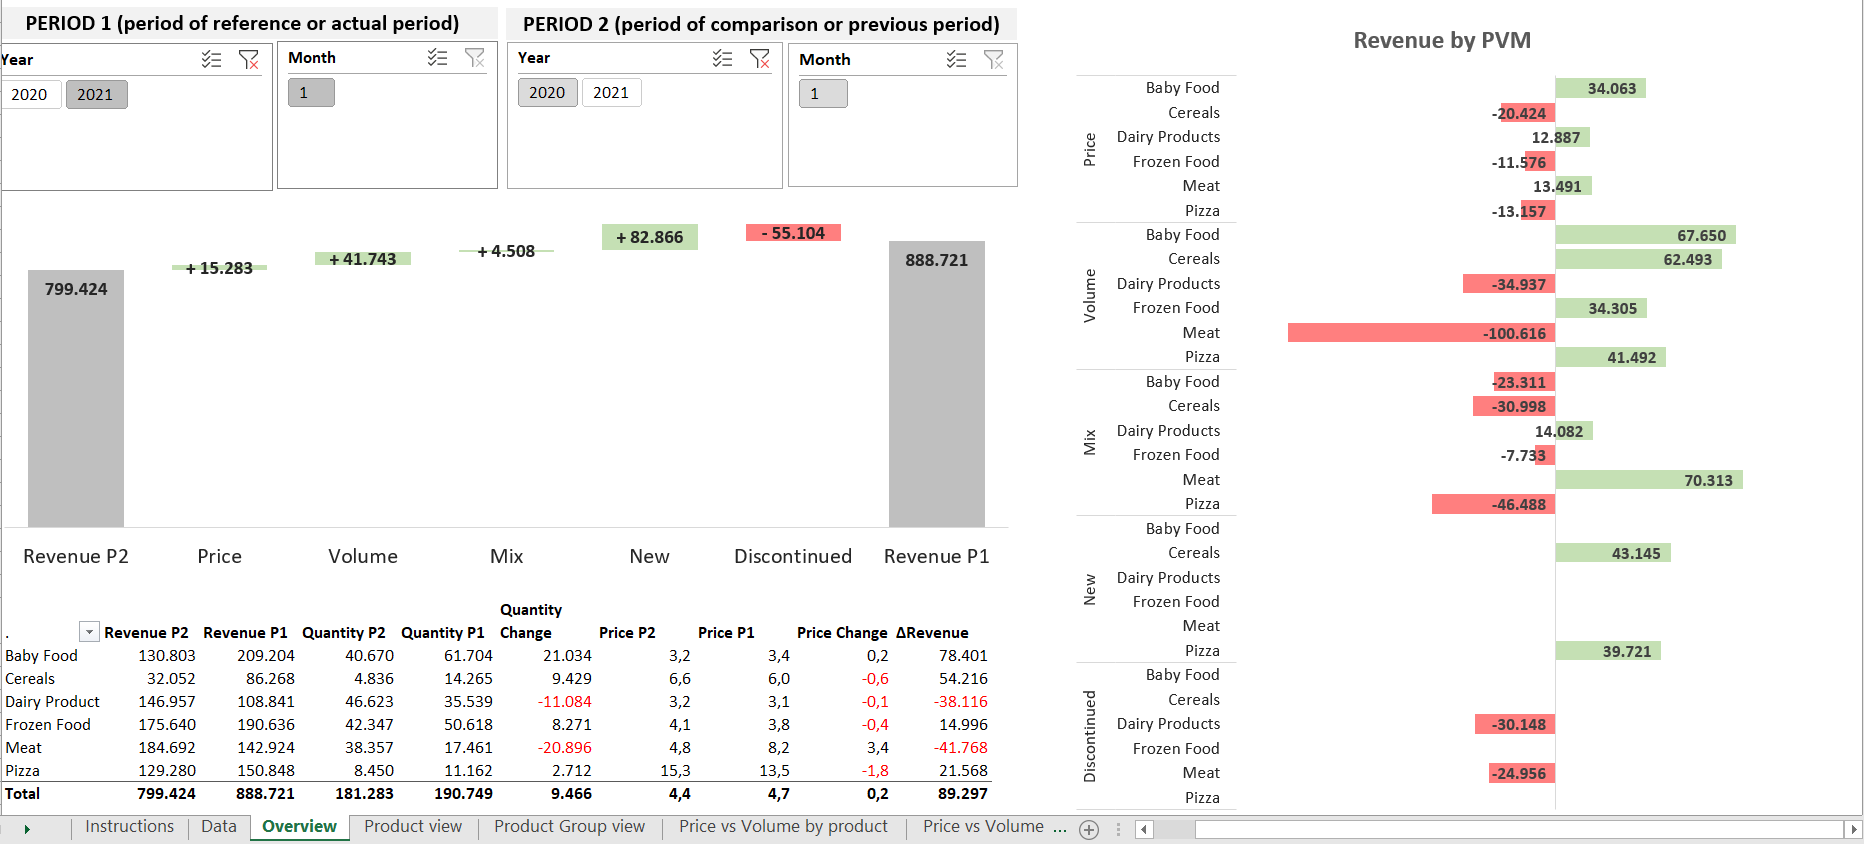
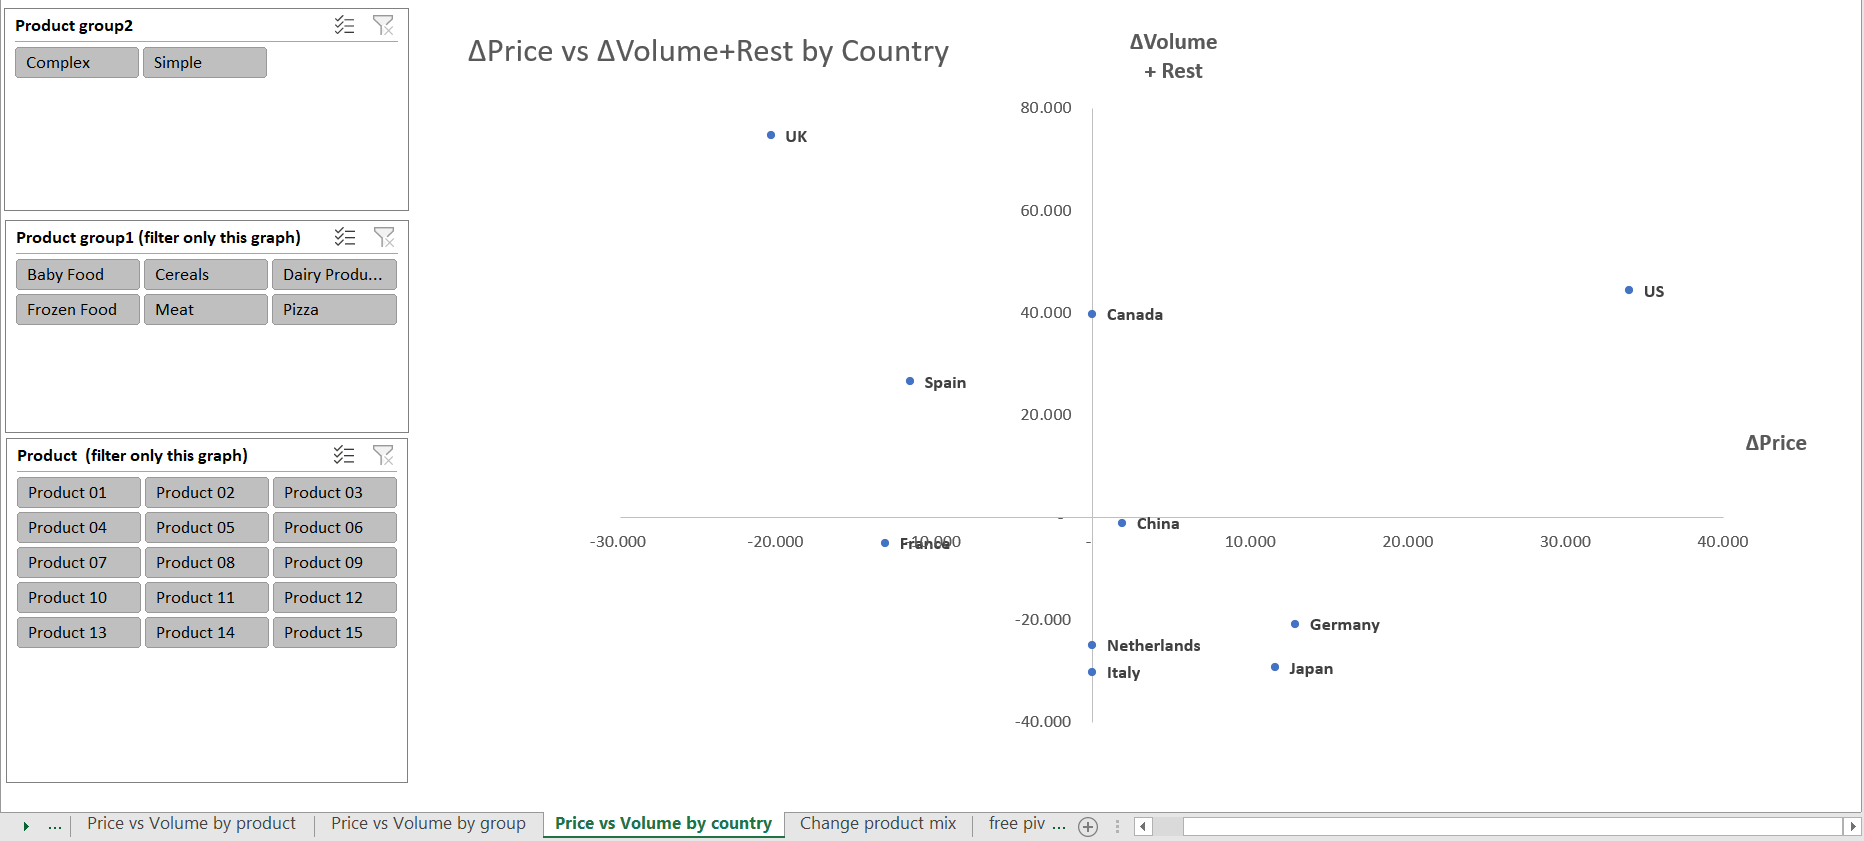
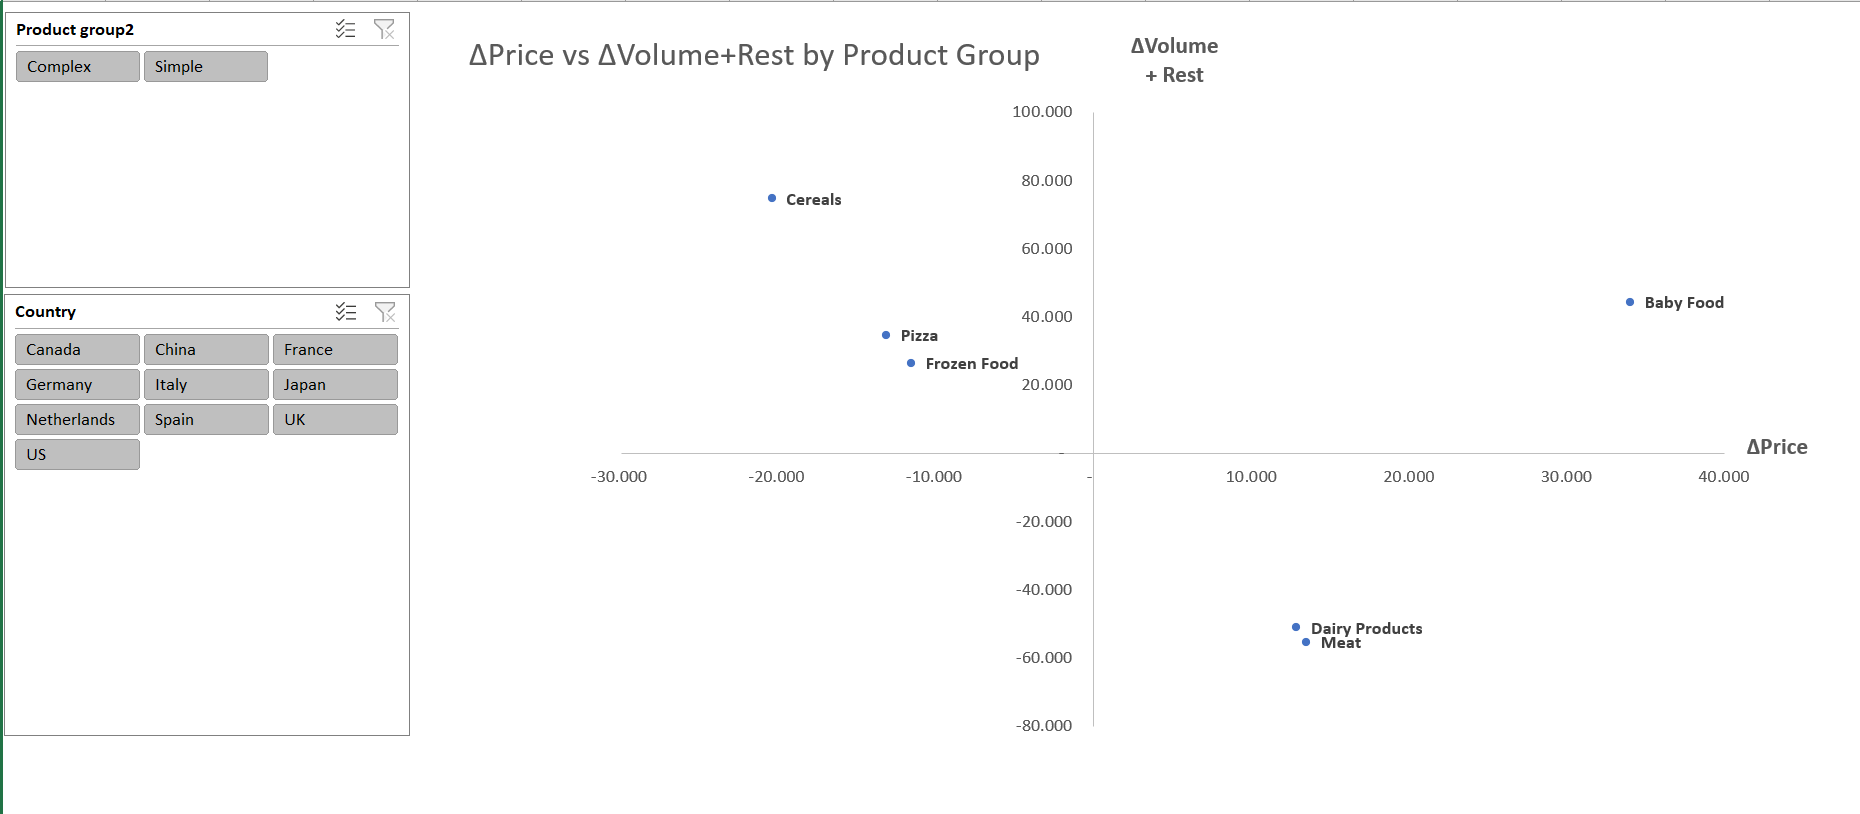
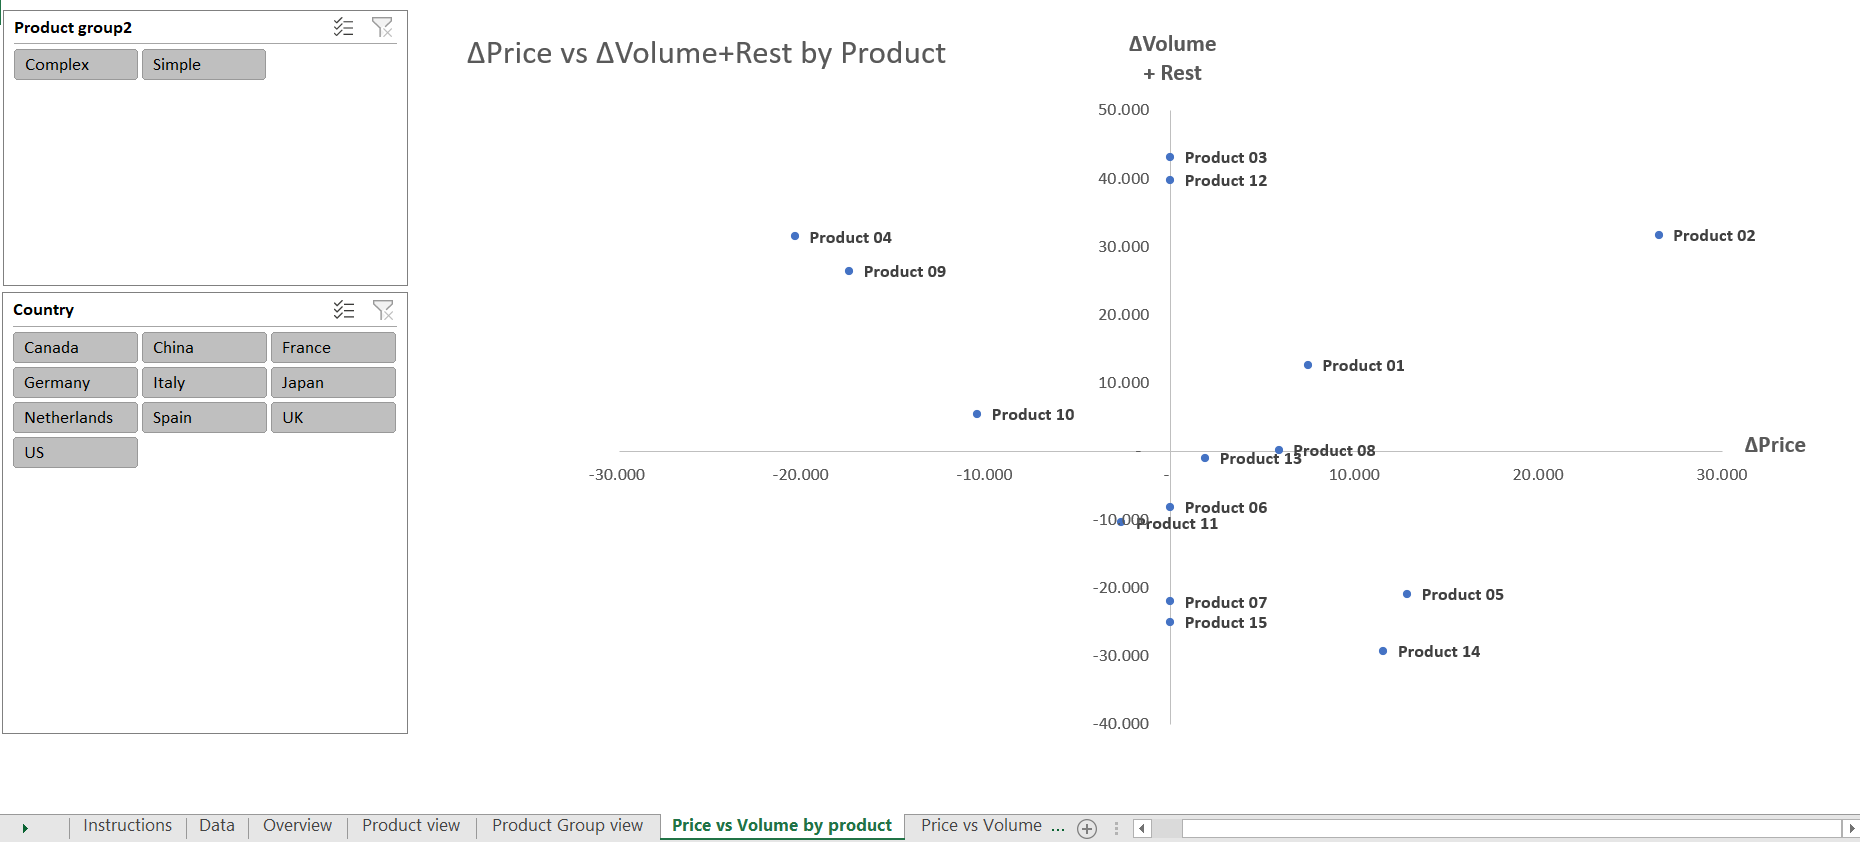
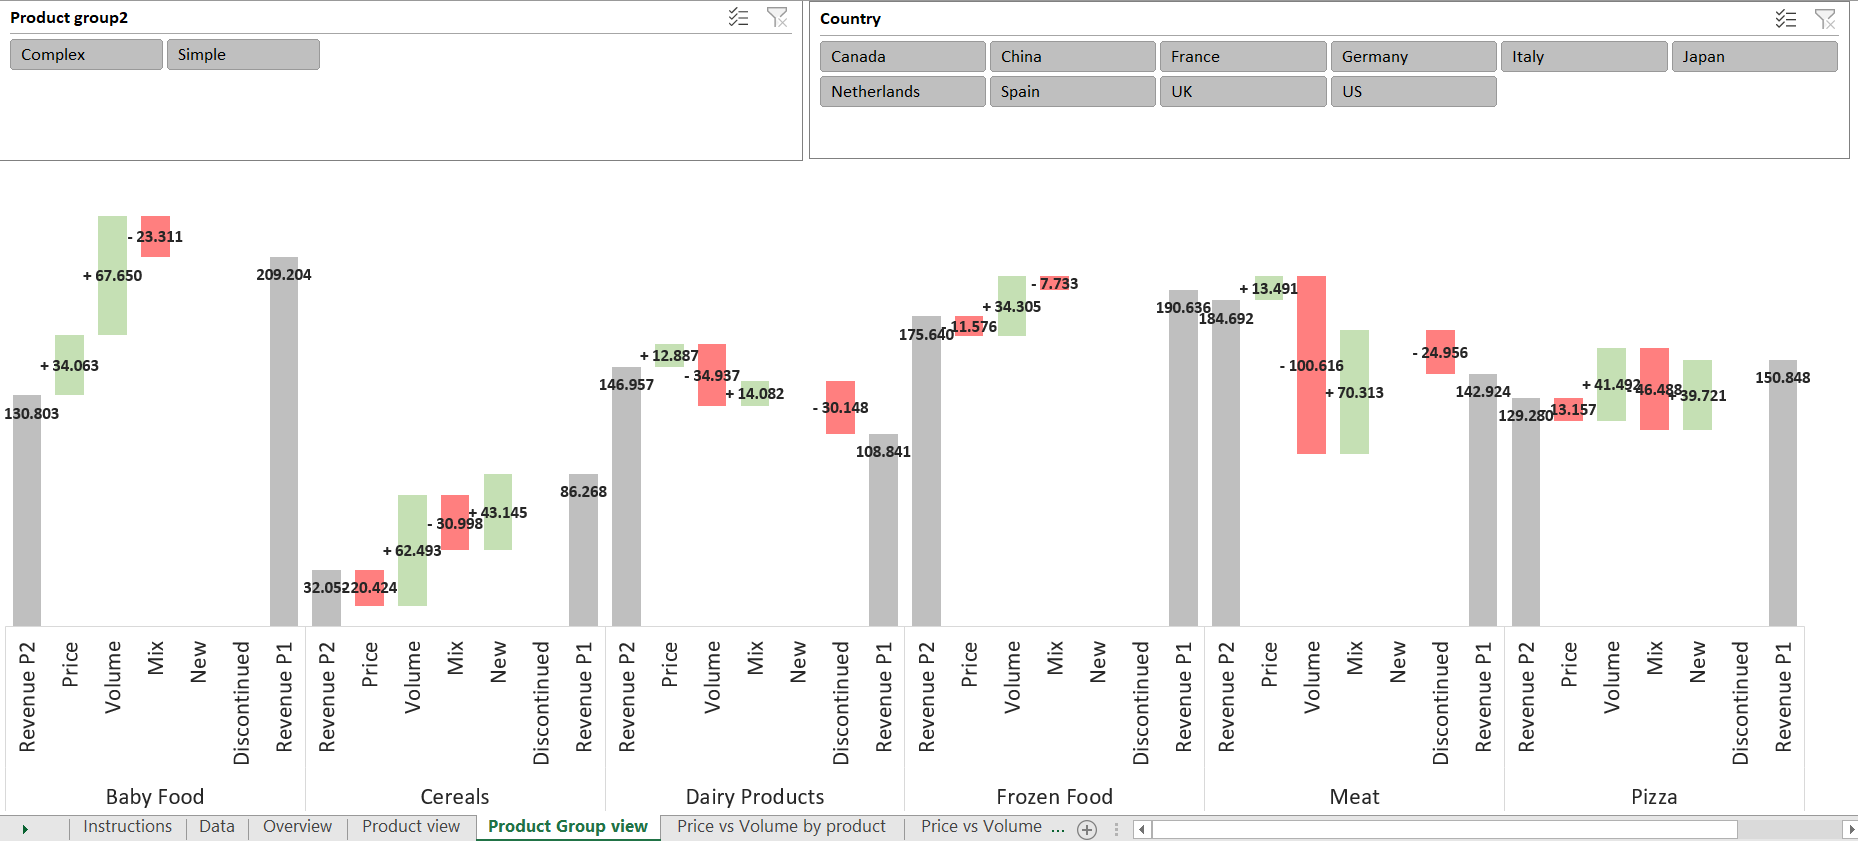
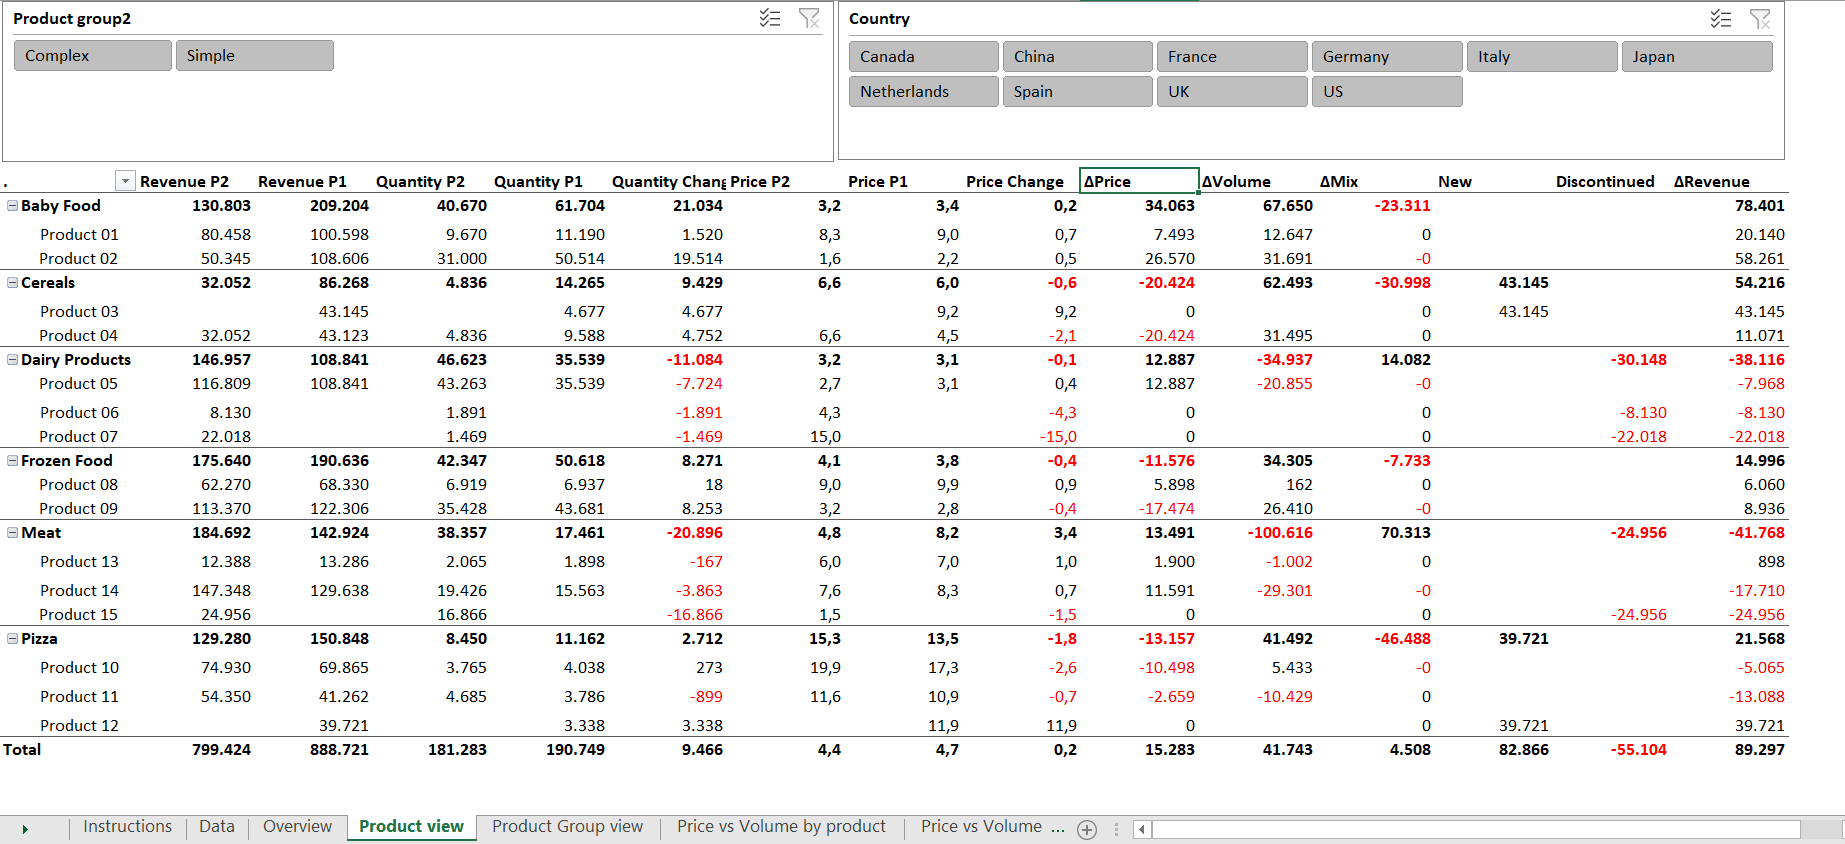
This report includes a general overview as the main dashboard, and a series of other visualizations where the data is analyzed by product group, country, product etc.
Here you have the instructions to use the template:
1- Insert data in the sheet "Data" using the proposed format. You need to add at least Year, Product, Revenue, Quantity. The data you don't have can be left blank
* instead of revenue you can use Gross Profit or other Profit measures, then the results will be about the Volume-Price+ mix for Profit
2- Go to the main Excel menu, click "Data" and "Refresh All"
3- In the "Overview" sheet select Period 1 (the period of reference or actual period) and Period 2 (the period of comparison or previous period). This template allows to compare personalized period of time
* this selection will impact all the other charts and tables except for the Pivot table in the sheet "free pivot table"
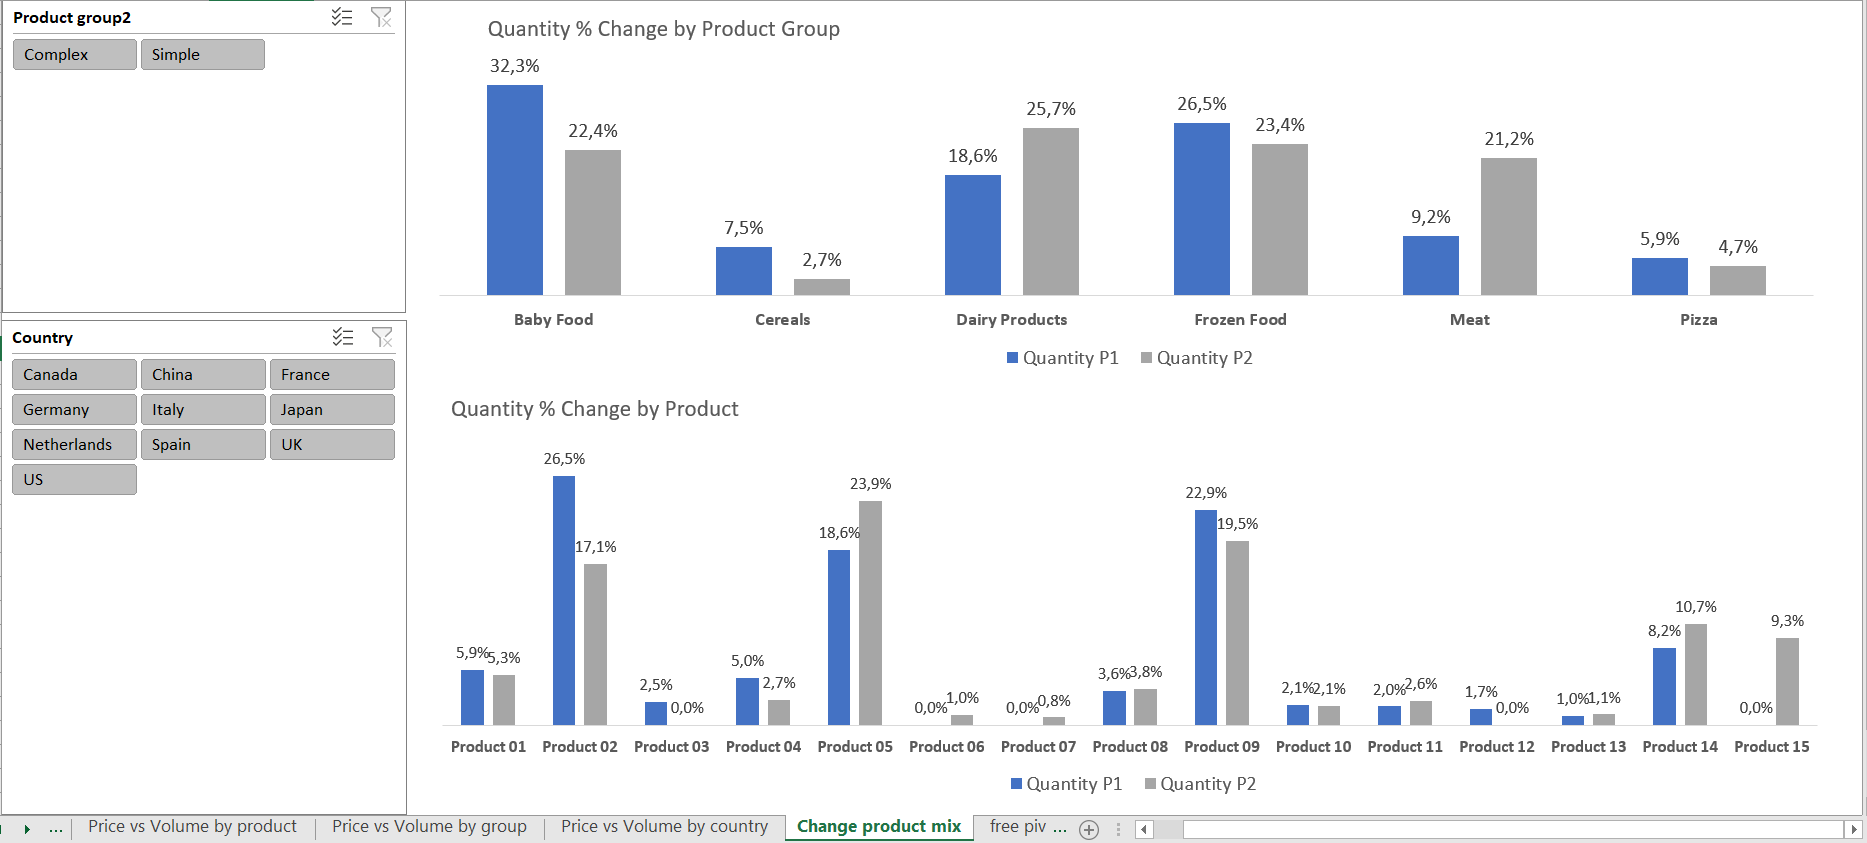
4- In the rest of the sheets (except for "free pivot table") you have filters about the second product group category and country. If you filled this data you will have them.
* all these filters (unless clearly specified) are connected, this means that if you filter US in "Product View" it will be filtered also in "Product Group view" and vice versa (but they don't change "Overview")
5- Analyze the data in the different sheets or create new tables using "free pivot table"
* if you need a personalized template, please contact me, I'll be happy to help you.
When looking at revenue or profit variance, a simple analysis can be misleading since we have different things that can impact the result: change in prices, change in quantity sold, change the volume mix of products etc.
To have a better insight about what is driving up or down revenues or profits, a Price Volume Mix Analysis is a very useful way. Compared to more traditional Price Volume Mix Analyses, in this template you have an advanced calculation that adds more categories to have better insights:
- Prince Variance: impact on revenue due to price changes
- Volume Variance: impact on revenue due to volume changes
- Mix Variance: impact on revenue due to a change in the mix of products
- New: impact on revenue due to new products
- Discontinued: impact on revenue due to products sold in the previous period but not in the present one (or the reference one)
Besides, this template has other two advantages compared to other templates:
- the Data entry uses a table similar to the data extraction you may have from transactional systems or in your reports. It is a transactional format where you load a column with dates besides other columns of data. This means that you don't have to specify which period you want to compare before uploading your data, you can decide and customize it later.
- Once the data is updated, you can select with filters Period 1 and Period 2 as the reference and comparing period. Besides, you have other filters in the report to segment your results (product groups, country etc.)
- You can exploit the data model by using a free pivot table to create additional tables and charts if you need to.
This report includes a general overview as the main dashboard, and a series of other visualizations where the data is analyzed by product group, country, product etc.
Here you have the instructions to use the template:
1- Insert data in the sheet "Data" using the proposed format. You need to add at least Year, Product, Revenue, Quantity. The data you don't have can be left blank
* instead of revenue you can use Gross Profit or other Profit measures, then the results will be about the Volume-Price+ mix for Profit
2- Go to the main Excel menu, click "Data" and "Refresh All"
3- In the "Overview" sheet select Period 1 (the period of reference or actual period) and Period 2 (the period of comparison or previous period). This template allows to compare personalized period of time
* this selection will impact all the other charts and tables except for the Pivot table in the sheet "free pivot table"
4- In the rest of the sheets (except for "free pivot table") you have filters about the second product group category and country. If you filled this data you will have them.
* all these filters (unless clearly specified) are connected, this means that if you filter US in "Product View" it will be filtered also in "Product Group view" and vice versa (but they don't change "Overview")
5- Analyze the data in the different sheets or create new tables using "free pivot table"
* if you need a personalized template, please contact me, I'll be happy to help you.
This Best Practice includes
1 Excel template
