

Originally published: 19/11/2021 15:55
Last version published: 26/11/2021 14:40
Publication number: ELQ-88983-2
View all versions & Certificate
Last version published: 26/11/2021 14:40
Publication number: ELQ-88983-2
View all versions & Certificate

Real Estate Acquisition (Commercial & Industrial) Excel Financial Model
Download our easy-to-use Real Estate (Commercial & Industrial)Deal Sizer to quickly analyze acquisition opportunities.
Our mission is to be the industrial leader and pioneer in our business domainFollow 12
real estateacquisition financeexcel pro forma templateacquisitionthree financial statementsdashboardfinancial modelnet present valuecash flow statement
Description
# Real Estate Acquisition (Commercial & Industrial) Excel Financial Model
The Real Estate (C&I) Acquisition Model offers the financial analysis of existing and new Real Estate Commercial & Industrial Acquisition investments. The Commercial Real Estate Industry has seen a boom through the last decade. As a Non-residential Real Estate Industry player, you may add a new line of business by acquiring a close competitor or a newly built high rise and utilize this model for better business analysis and forecasting.
The Real Estate (C&I) Acquisition Model consists of three financial statements: Monthly Income Statement, Yearly Income Statement, Balance Sheet, and Cashflow Statement. Along with the decision-making tools such as; Break-Even Analysis, Project Valuation, Diagnostic Tools, Startup Summary, and various Charts & Graphs.
# Key Inputs of Real Estate Acquisition (Commercial & Industrial) Excel Financial Model
1: Investment Sources
2: Property Acquisition Cost
3: Rental Analysis
4: Debt-Investment Ratio
5: Rental Income
6: Vacancy Ratio
7: Exit Strategy
8: Tax Rate
9: Renovation Cost Table
10: Operational Expense
# Key Features of Real Estate Acquisition (Commercial & Industrial) Excel Financial Model
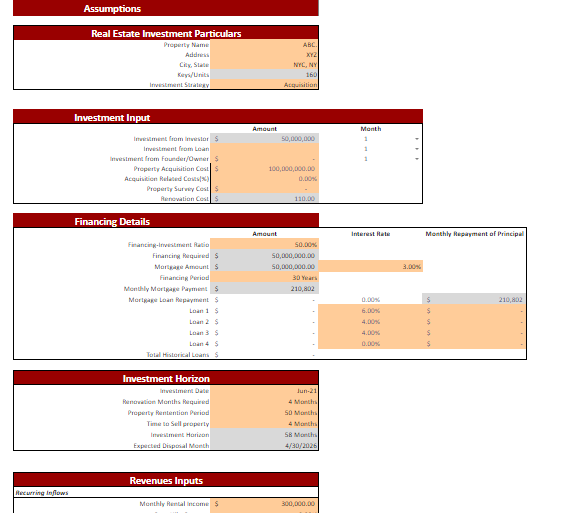
1: Input Sheet
The Input Sheet specifies all the required inputs necessary to compute three financial statements. First, whenever an investor buys an existing building, it has to be renovated as per one’s need and business ideology; Real Estate Apartment Acquisition Model Financial Model does cater to this by adding a fully loaded renovation cost structure plan in a separate sheet under the operational cost head, which will be covering below. Second, to calculate the true cost of financing the project, the model asks for a loan-value ratio. Then, it automatically calculates the financing amount to be arranged by the owner. Third, monthly borrowing cost is also calculated spontaneously just by entering financing terms and mortgage rates.
Similarly, the investment holding period is ascertained if the user enters its time to renovate, retain and then market to sell. This three-phase holding period is dynamic enough to cater to the delay in investor experiences while selling the property in the future. Revenue generation for a structure is primarily based on rental income, and that too comes with vacant days in a year.
Apparently, an unoccupied unit is a cut on revenue. Therefore it is safe to assume as cost charged against business revenues. Just like the model facilitates determining true property acquisition cost if an investor wants to sell the property in the future, the model adjusts future sales price and all relevant costs needed to dispose of the asset.
Real Estate Apartment Acquisition Model Financial financial model template contains inputs that, when changed, impact the calculations and, therefore, it changes all relevant sheets. As a result, this financial model always has built-in flexibility to display different outcomes or final estimates based on this sheet’s changes.
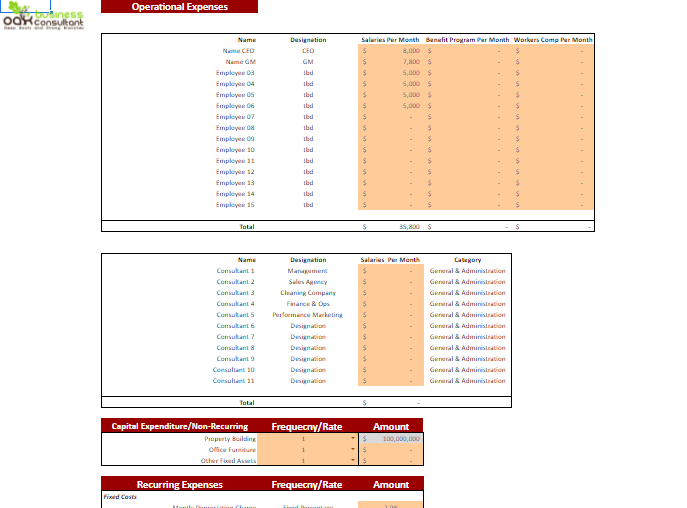
2: Operating Expense
The operational expense sheet addresses expected recurring and non-recurring expenditures, which the owner must account for while deciding to invest in a Commercial & Industrial real estate venture. Operating expenses start from employees’ and consultants’ overhead costs. An investor can add various employees to this sheet. Employees benefit worker compensation provision is also there. The model also incorporates expected cash outflows caused by hiring external business advisors or consultants to revamp business strategy.
The capital expenditure section includes long-term investment in property building itself, office furniture, and any additional expense. One key feature of our model in Capital Expenditure calculation is, it gives users an option to choose in which month out of 60 months outflow occurs. Thus, it is more flexible rather than just one-time Capital Expenditure input as offered anywhere else.
Recurring expenses kept arising throughout the year, so this model gives special attention to various recurring charges. The fixed expense includes insurance and depreciation charged on fixed assets. Insurance expense includes a fixed percentage rise that is editable by the user if desired so. Operating cost and management-related costs are in the recurring expense head; with an option of a monthly rate hike, the user can foresee expenses rising in the future.
3: Renovation Cost
As discussed above, the investor/ user might have to renovate the property after the initial purchase. That renovation expense adds to the input sheet because renovation expense is considered an initial outflow. The components of total renovation cost appear in detail in the sheet operational expenses. Every item in the renovation cost is discretionary, which means it is up to the user to entre expense in all renovation cost items or skip some.
All expenses are every month, for instance, labor, steelworks, door works, HVAC, plumbing, home appliances, wall decoration, roof installation, and many others. And the month ends where the user enters renovation months in the input sheet; after that month, no renovation cost adds to the business. Rental revenues start from the very next month of the last renovation month.
For convenient user guidance, the Real Estate Acquisition Financial Model Excel (Commercial & Industrial) has featured two sheets where users can enter/edit/alter any input to get desired results. These sheets are “Input and operational expense sheet, All the input cells are colored orange, and calculated cells are color gray, just for the sake of making calculations more understandable and can be traced back to the source.
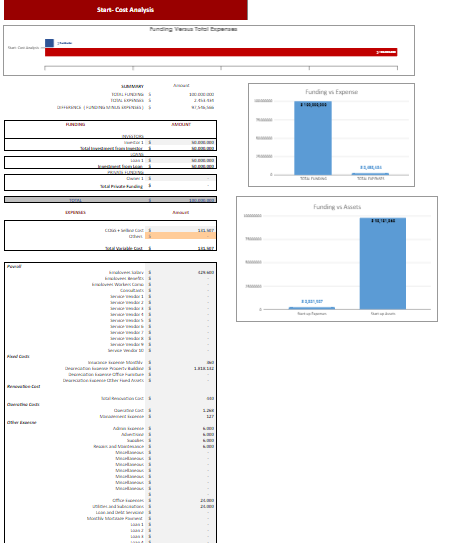
4: Startup Summary
A start-up summary tab includes the total cost incurred at the start of the business and capital expenditure. And how much cash injected by the company so far. and it also helps you take a realistic view of your idea. And double-check whether the business has enough funds to support operations.
The startup summary sheet provides a quick look at funding needs, fixed and variable expenses, funding sources. And how the funds will cost. This sheet is a handy and time-saving tool. To analyze which cost is to free up the limited funding available at the investor’s discretion.
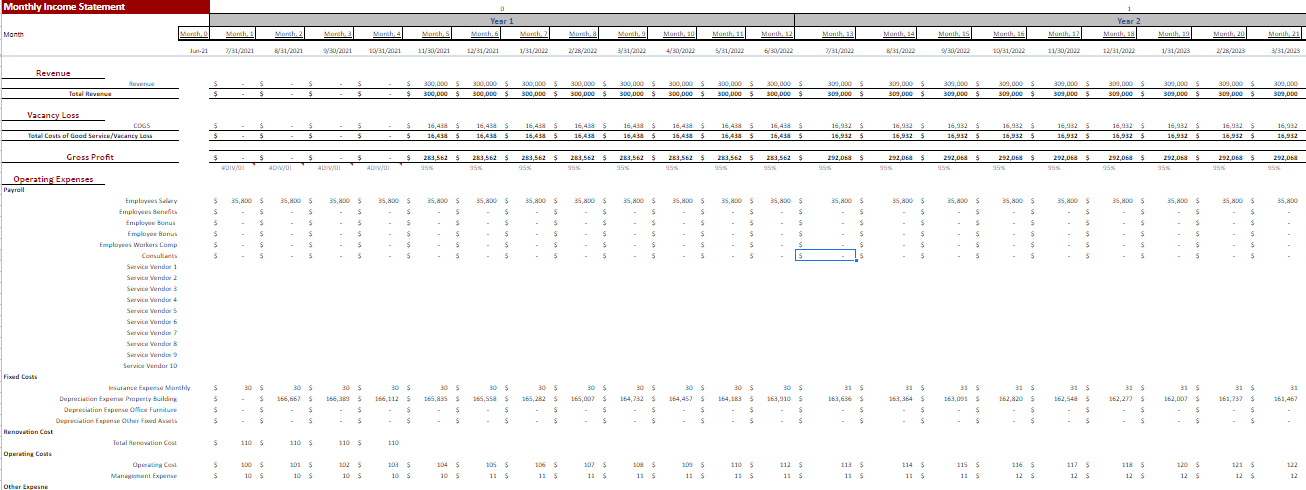
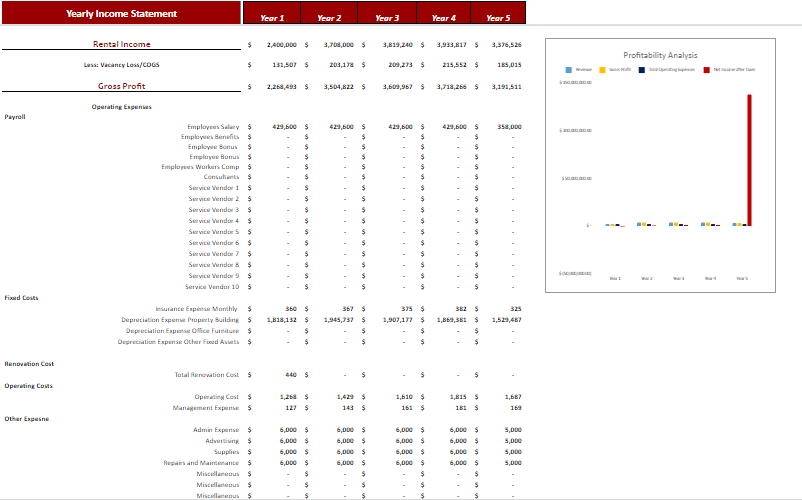
5: Monthly & Yearly Income Statement
The Real Estate Acquisition Model (Commercial & Industrial) Financial Model provides the monthly and yearly income statement structure and a framework for creating a full corporate forecasting model tailored to your particular business.
A vital feature of the Real Estate Acquisition Model (Commercial & Industrial) Financial Model is that it is “integrated,” which means that the Income Statement accurately captures the connection and inter-linkages of the various line business items. An integrated financial model is powerful. Since it enables the Financial Model user to change any assumption in one part of the statement. To see how it impacts investors template other parts accurately and consistently.
The monthly Income Statement sheet of the Real Estate Acquisition Model (Commercial & Industrial) Financial Model Template is ideal for those who require regular reporting and details. Additionally, Income Statement contains all revenue streamlines with gross earnings, net earnings linked with a revenue analysis sheet to ensure accurate reporting. Oak Business Consultants understands every business’s goal. Therefore, we have developed a mechanism that helps business owners determine whether they are making profits or otherwise.
Furthermore, the Yearly Income Statement gives you complete insights into revenue and general & administrative expenses. The Yearly Income Statement also contains several graphs, assumptions, ratios, margins, net profit, earnings, cost of services, and profit after tax.
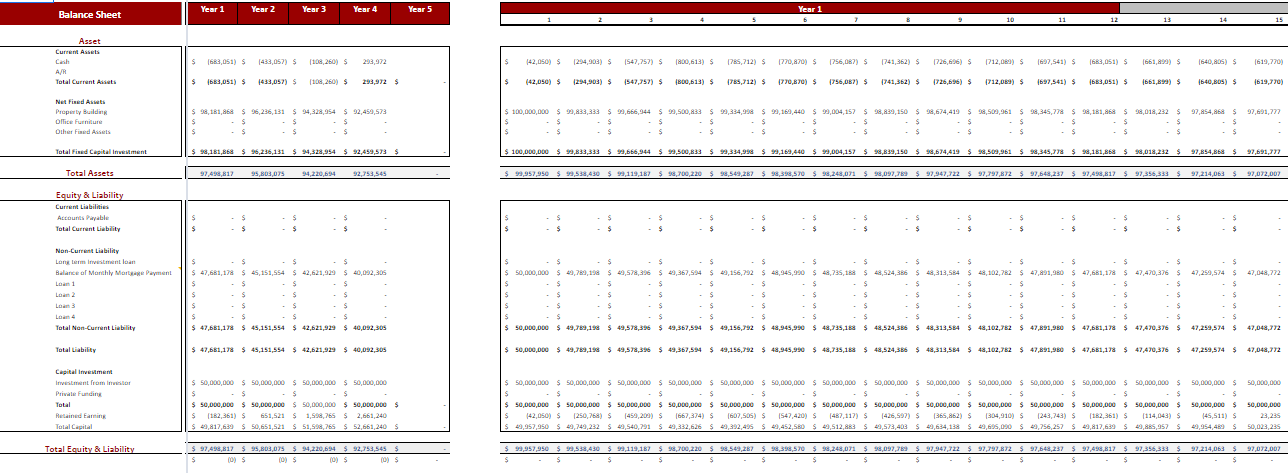
6: Balance Sheet
This balance sheet enables you to analyze your position of current assets, fixed assets, liabilities, and equity. It also allows you to monitor your accounts receivable, accounts payable, accrued expenses, etc. Therefore this specific, financial model gives you the perfect space to analyze your critical financial balance accounts.
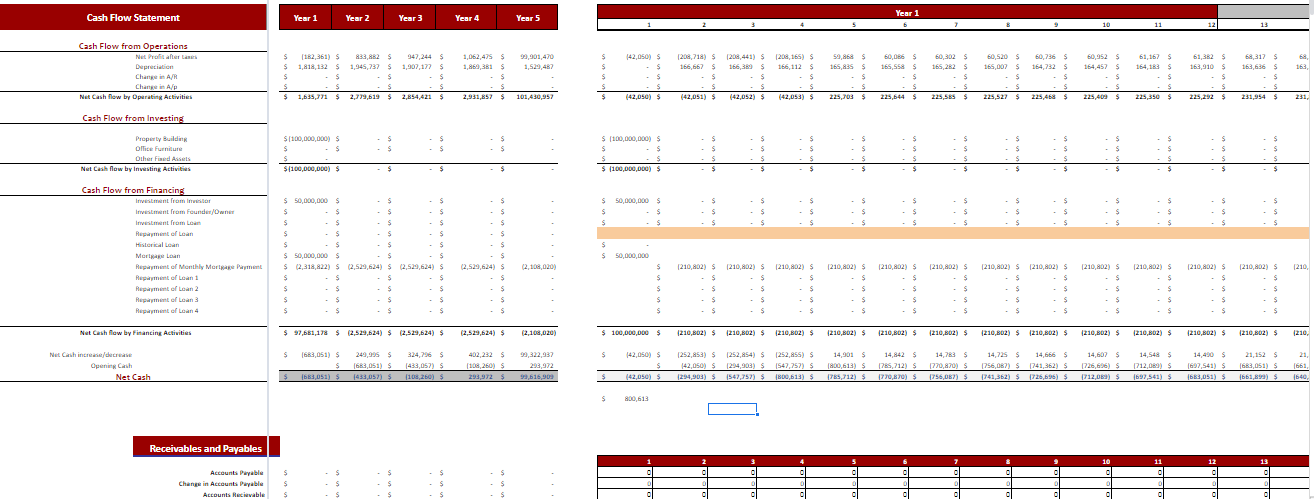
7: Cash Flow Statement
The Cash Flow Statement is the vital part of the three statements that report the cash spent and generated during a specific period. The Cash Flow Statements connect cash rotation between the income statement and balance sheet.
# Three main sections Cash Flow Statement:
1: Operating Activities: We have included all cash in and out related to the operations of the business.
2: Investing Activities: Any cash from the disposal of an asset and acquisition and investments appear in this section linked to the inputs and fixed asset tab.
3: Financing Activities: We have separately made a loan-related tab where you can enter all loan-related information thee. The tab connects to Financing Activities of Cash Flow Statement.
The Cash Flow Statement in our Model contains a dedicated sheet to monitor and analyze your company cash-ins and out. This cash flow statement relies on several key inputs, such as Payable and Receivable Days, yearly income, working capital, long-term debt, net cash, etc. This calculation then computes your net cash flow, beginning and end cash balances. It’s a perfect template for your company’s cash flow management.
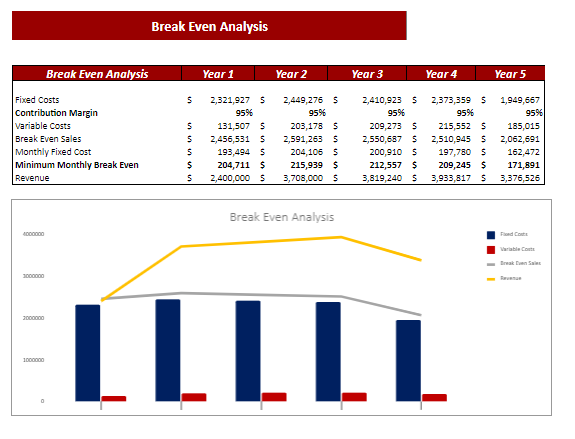
8: Break-Even Analysis
A break-even analysis can help you measure how different scenarios might play out financially. For example, if you increase the marketing budget or add another employee to the payroll, how many extra sales will recover that additional expense?
As a coup, we have included a Break-even analysis to our Financial Model, which will help the user determine sales. The break-even analysis will help you know at a glance the profits generated at the various sales levels. The Break-Even Analysis refers to the point where your total sales contribution refers to fixed cost at zero profit and loss. This Technique consists of marginal costing, which behaves differently at various levels of output activity.
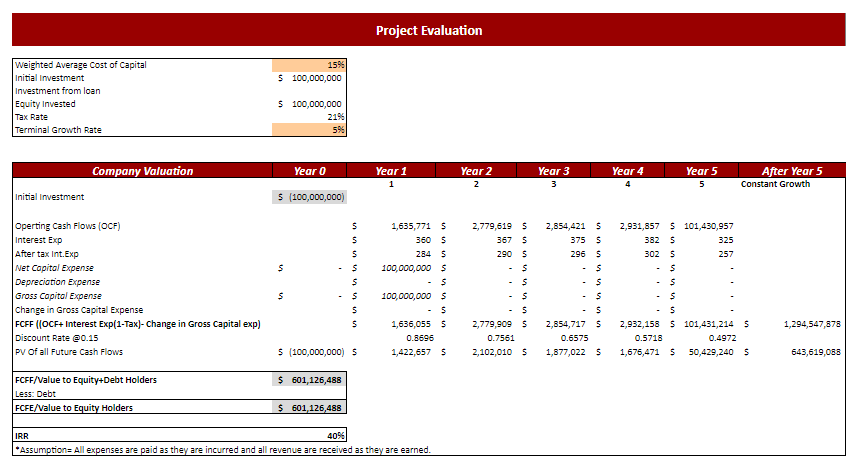
9: Project Evaluation
The project valuation sheet is critical. Because it gives the directional strategy to an investor, either the project should be investing in or not? This sheet is fully linked to all financial statements projected earlier and asks for little input from the user. WACC, the weighted average cost of capital, is discretionary and needs to be put in by the investor itself, keeping in view all equity and debt holders’ costs. The initial investment is the total project cost that the user has added to the input sheet. Equity and debt values in that project investment amount took from loan-value ratios, which the user defines in the input sheet.
The terminal growth rate is the rate that users foresee a business may earn after a five-year forecast. This rate is hardcoded by the user, keeping in view a specific industry, country, and region in mind. The sole purpose of the project valuation sheet is to use the DCF model to discount back all future expected cash flows of the firm at a discount rate or WACC (set by user).
Then determine the NPV/ free cash flows to the firm (both equity and debt holders); to see if the project has positive or negative net cash flows. Debt/ loan amount is minus to arrive at free cash flows to equity holders. Finally, IRR equals IRR function to see if the project’s IRR is greater than or less than the discount rate.
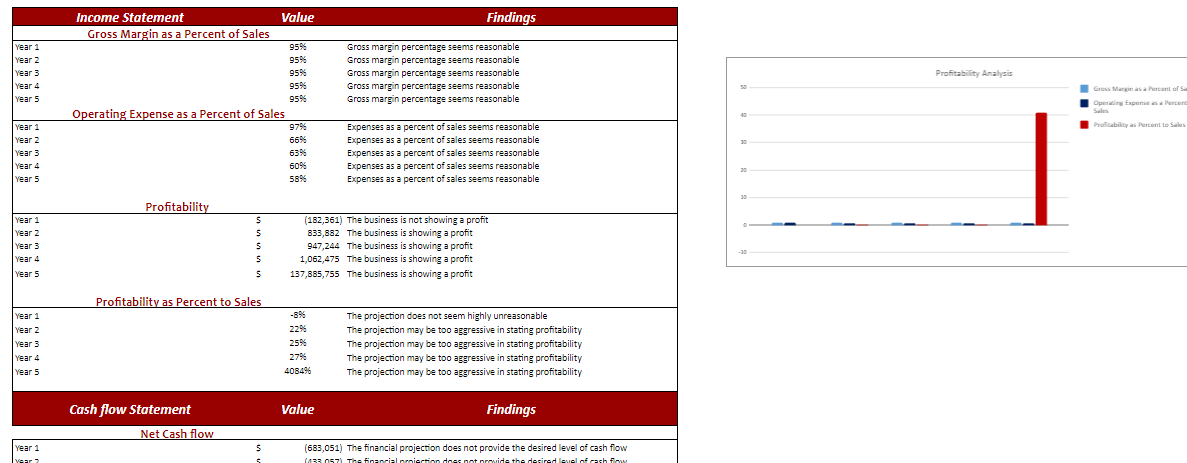
10: Diagnostic Sheet
The diagnostic tool sheet again is a compact pitch book for fund generation marketing strategy. Here probable investors can quickly analyze and access profit margins, cash flows, and break-even metrics to decide. For example, suppose to invest in this business or not. All the outcomes of the dashboard and diagnostic tool sheets show with no user interference. Thus saving time and cost for the business owner. In addition, this Diagnostic sheet automatically calculates the data such as the Profitability ratio, Net operating expense ratio. That will provide financial commentary about the company’s financials.
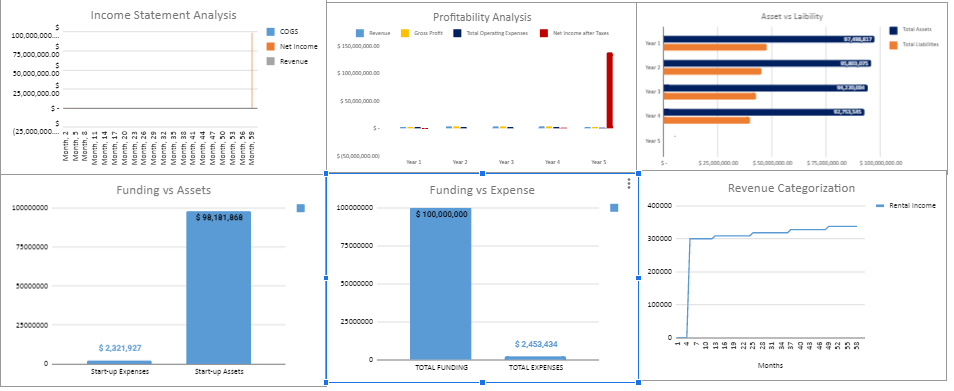
11: Dashboard
Users and readers respond and process visual graphs better than data. The dashboard provides you a graphical management tool that helps track all your relevant financial KPIs. It also Improves cash flow management and net revenue in detail to meet the financial objectives of your business.
# Benefits Of Our Real Estate Acquisition (Commercial & Industrial) Excel Financial Model
1: Encapsulate Company Performance- The Real Estate Acquisition Model (Commercial & Industrial) Financial Model analysis simplifies a company’s financial statements. It allows the user to express critical profitability and financial position information in just a few numbers. For example, the company’s net profit margin encapsulates the net effect of a company’s revenues and all expenses. Thus, it will enable the user to conclude a company’s profitability without going through lengthy accounts statements.
2: Bottom Line – A Real Estate Acquisition Model (Commercial & Industrial) Financial Model can be the key to your company’s better and informed future. Succeeding to plan your Company’s finances well will mean overall success in making wise investment decisions, purchasing the right operating assets, control costs, and determining company valuation.
3: Accommodates Investors – This model provides valuation and performance analysis charts. It enables the investors and banks to determine the company’s worth considering lending funds to your company.
4: Based on Financial Principles – We did in-depth research on an Online Real Estate Acquisition Model (Commercial & Industrial) Financial Model Template. So this financial model makes with logically correct financial and economic principles and assumptions.
5: Properly Integrated – The model assumptions and calculations are correlated. So the change in the main sheet will automatically lead to the change in all related sheets easily.
6: Visualization Tool – This Financial model also prepares a clear communication of the quantitative outcomes, as obtained by calculations via various graphs and charts. Therefore, the user does not need to pay much attention to the financial model’s inner workings.
# How To Use Real Estate Acquisition (Commercial & Industrial) Excel Financial Model
For the purpose of making this model easy to use, Oak Business Consultant has designed this Financial Model Template with maximum care. Each cell has a color code, and the input areas are all highlighted in peach color.
The User is only required to input data in color cells. All other cells are either helping calculations or results of the model. Therefore there is no need to change any other cell except colored cells.
# More About Financial Modelling:
Contact our expert if you are confused about buying our template. The experts can provide you a 15 min DEMO of the financial model.
# Consultation:
If you are not sure about the numbers, you can hire us as your consultants. We have a pool of Financial Experts who could advise numbers like growth rate, first-year operational expenses, employee headcount, sales capacity, etc.
# Real Estate Acquisition (Commercial & Industrial) Excel Financial Model
The Real Estate (C&I) Acquisition Model offers the financial analysis of existing and new Real Estate Commercial & Industrial Acquisition investments. The Commercial Real Estate Industry has seen a boom through the last decade. As a Non-residential Real Estate Industry player, you may add a new line of business by acquiring a close competitor or a newly built high rise and utilize this model for better business analysis and forecasting.
The Real Estate (C&I) Acquisition Model consists of three financial statements: Monthly Income Statement, Yearly Income Statement, Balance Sheet, and Cashflow Statement. Along with the decision-making tools such as; Break-Even Analysis, Project Valuation, Diagnostic Tools, Startup Summary, and various Charts & Graphs.
# Key Inputs of Real Estate Acquisition (Commercial & Industrial) Excel Financial Model
1: Investment Sources
2: Property Acquisition Cost
3: Rental Analysis
4: Debt-Investment Ratio
5: Rental Income
6: Vacancy Ratio
7: Exit Strategy
8: Tax Rate
9: Renovation Cost Table
10: Operational Expense
# Key Features of Real Estate Acquisition (Commercial & Industrial) Excel Financial Model
1: Input Sheet
The Input Sheet specifies all the required inputs necessary to compute three financial statements. First, whenever an investor buys an existing building, it has to be renovated as per one’s need and business ideology; Real Estate Apartment Acquisition Model Financial Model does cater to this by adding a fully loaded renovation cost structure plan in a separate sheet under the operational cost head, which will be covering below. Second, to calculate the true cost of financing the project, the model asks for a loan-value ratio. Then, it automatically calculates the financing amount to be arranged by the owner. Third, monthly borrowing cost is also calculated spontaneously just by entering financing terms and mortgage rates.
Similarly, the investment holding period is ascertained if the user enters its time to renovate, retain and then market to sell. This three-phase holding period is dynamic enough to cater to the delay in investor experiences while selling the property in the future. Revenue generation for a structure is primarily based on rental income, and that too comes with vacant days in a year.
Apparently, an unoccupied unit is a cut on revenue. Therefore it is safe to assume as cost charged against business revenues. Just like the model facilitates determining true property acquisition cost if an investor wants to sell the property in the future, the model adjusts future sales price and all relevant costs needed to dispose of the asset.
Real Estate Apartment Acquisition Model Financial financial model template contains inputs that, when changed, impact the calculations and, therefore, it changes all relevant sheets. As a result, this financial model always has built-in flexibility to display different outcomes or final estimates based on this sheet’s changes.
2: Operating Expense
The operational expense sheet addresses expected recurring and non-recurring expenditures, which the owner must account for while deciding to invest in a Commercial & Industrial real estate venture. Operating expenses start from employees’ and consultants’ overhead costs. An investor can add various employees to this sheet. Employees benefit worker compensation provision is also there. The model also incorporates expected cash outflows caused by hiring external business advisors or consultants to revamp business strategy.
The capital expenditure section includes long-term investment in property building itself, office furniture, and any additional expense. One key feature of our model in Capital Expenditure calculation is, it gives users an option to choose in which month out of 60 months outflow occurs. Thus, it is more flexible rather than just one-time Capital Expenditure input as offered anywhere else.
Recurring expenses kept arising throughout the year, so this model gives special attention to various recurring charges. The fixed expense includes insurance and depreciation charged on fixed assets. Insurance expense includes a fixed percentage rise that is editable by the user if desired so. Operating cost and management-related costs are in the recurring expense head; with an option of a monthly rate hike, the user can foresee expenses rising in the future.
3: Renovation Cost
As discussed above, the investor/ user might have to renovate the property after the initial purchase. That renovation expense adds to the input sheet because renovation expense is considered an initial outflow. The components of total renovation cost appear in detail in the sheet operational expenses. Every item in the renovation cost is discretionary, which means it is up to the user to entre expense in all renovation cost items or skip some.
All expenses are every month, for instance, labor, steelworks, door works, HVAC, plumbing, home appliances, wall decoration, roof installation, and many others. And the month ends where the user enters renovation months in the input sheet; after that month, no renovation cost adds to the business. Rental revenues start from the very next month of the last renovation month.
For convenient user guidance, the Real Estate Acquisition Financial Model Excel (Commercial & Industrial) has featured two sheets where users can enter/edit/alter any input to get desired results. These sheets are “Input and operational expense sheet, All the input cells are colored orange, and calculated cells are color gray, just for the sake of making calculations more understandable and can be traced back to the source.
4: Startup Summary
A start-up summary tab includes the total cost incurred at the start of the business and capital expenditure. And how much cash injected by the company so far. and it also helps you take a realistic view of your idea. And double-check whether the business has enough funds to support operations.
The startup summary sheet provides a quick look at funding needs, fixed and variable expenses, funding sources. And how the funds will cost. This sheet is a handy and time-saving tool. To analyze which cost is to free up the limited funding available at the investor’s discretion.
5: Monthly & Yearly Income Statement
The Real Estate Acquisition Model (Commercial & Industrial) Financial Model provides the monthly and yearly income statement structure and a framework for creating a full corporate forecasting model tailored to your particular business.
A vital feature of the Real Estate Acquisition Model (Commercial & Industrial) Financial Model is that it is “integrated,” which means that the Income Statement accurately captures the connection and inter-linkages of the various line business items. An integrated financial model is powerful. Since it enables the Financial Model user to change any assumption in one part of the statement. To see how it impacts investors template other parts accurately and consistently.
The monthly Income Statement sheet of the Real Estate Acquisition Model (Commercial & Industrial) Financial Model Template is ideal for those who require regular reporting and details. Additionally, Income Statement contains all revenue streamlines with gross earnings, net earnings linked with a revenue analysis sheet to ensure accurate reporting. Oak Business Consultants understands every business’s goal. Therefore, we have developed a mechanism that helps business owners determine whether they are making profits or otherwise.
Furthermore, the Yearly Income Statement gives you complete insights into revenue and general & administrative expenses. The Yearly Income Statement also contains several graphs, assumptions, ratios, margins, net profit, earnings, cost of services, and profit after tax.
6: Balance Sheet
This balance sheet enables you to analyze your position of current assets, fixed assets, liabilities, and equity. It also allows you to monitor your accounts receivable, accounts payable, accrued expenses, etc. Therefore this specific, financial model gives you the perfect space to analyze your critical financial balance accounts.
7: Cash Flow Statement
The Cash Flow Statement is the vital part of the three statements that report the cash spent and generated during a specific period. The Cash Flow Statements connect cash rotation between the income statement and balance sheet.
# Three main sections Cash Flow Statement:
1: Operating Activities: We have included all cash in and out related to the operations of the business.
2: Investing Activities: Any cash from the disposal of an asset and acquisition and investments appear in this section linked to the inputs and fixed asset tab.
3: Financing Activities: We have separately made a loan-related tab where you can enter all loan-related information thee. The tab connects to Financing Activities of Cash Flow Statement.
The Cash Flow Statement in our Model contains a dedicated sheet to monitor and analyze your company cash-ins and out. This cash flow statement relies on several key inputs, such as Payable and Receivable Days, yearly income, working capital, long-term debt, net cash, etc. This calculation then computes your net cash flow, beginning and end cash balances. It’s a perfect template for your company’s cash flow management.
8: Break-Even Analysis
A break-even analysis can help you measure how different scenarios might play out financially. For example, if you increase the marketing budget or add another employee to the payroll, how many extra sales will recover that additional expense?
As a coup, we have included a Break-even analysis to our Financial Model, which will help the user determine sales. The break-even analysis will help you know at a glance the profits generated at the various sales levels. The Break-Even Analysis refers to the point where your total sales contribution refers to fixed cost at zero profit and loss. This Technique consists of marginal costing, which behaves differently at various levels of output activity.
9: Project Evaluation
The project valuation sheet is critical. Because it gives the directional strategy to an investor, either the project should be investing in or not? This sheet is fully linked to all financial statements projected earlier and asks for little input from the user. WACC, the weighted average cost of capital, is discretionary and needs to be put in by the investor itself, keeping in view all equity and debt holders’ costs. The initial investment is the total project cost that the user has added to the input sheet. Equity and debt values in that project investment amount took from loan-value ratios, which the user defines in the input sheet.
The terminal growth rate is the rate that users foresee a business may earn after a five-year forecast. This rate is hardcoded by the user, keeping in view a specific industry, country, and region in mind. The sole purpose of the project valuation sheet is to use the DCF model to discount back all future expected cash flows of the firm at a discount rate or WACC (set by user).
Then determine the NPV/ free cash flows to the firm (both equity and debt holders); to see if the project has positive or negative net cash flows. Debt/ loan amount is minus to arrive at free cash flows to equity holders. Finally, IRR equals IRR function to see if the project’s IRR is greater than or less than the discount rate.
10: Diagnostic Sheet
The diagnostic tool sheet again is a compact pitch book for fund generation marketing strategy. Here probable investors can quickly analyze and access profit margins, cash flows, and break-even metrics to decide. For example, suppose to invest in this business or not. All the outcomes of the dashboard and diagnostic tool sheets show with no user interference. Thus saving time and cost for the business owner. In addition, this Diagnostic sheet automatically calculates the data such as the Profitability ratio, Net operating expense ratio. That will provide financial commentary about the company’s financials.
11: Dashboard
Users and readers respond and process visual graphs better than data. The dashboard provides you a graphical management tool that helps track all your relevant financial KPIs. It also Improves cash flow management and net revenue in detail to meet the financial objectives of your business.
# Benefits Of Our Real Estate Acquisition (Commercial & Industrial) Excel Financial Model
1: Encapsulate Company Performance- The Real Estate Acquisition Model (Commercial & Industrial) Financial Model analysis simplifies a company’s financial statements. It allows the user to express critical profitability and financial position information in just a few numbers. For example, the company’s net profit margin encapsulates the net effect of a company’s revenues and all expenses. Thus, it will enable the user to conclude a company’s profitability without going through lengthy accounts statements.
2: Bottom Line – A Real Estate Acquisition Model (Commercial & Industrial) Financial Model can be the key to your company’s better and informed future. Succeeding to plan your Company’s finances well will mean overall success in making wise investment decisions, purchasing the right operating assets, control costs, and determining company valuation.
3: Accommodates Investors – This model provides valuation and performance analysis charts. It enables the investors and banks to determine the company’s worth considering lending funds to your company.
4: Based on Financial Principles – We did in-depth research on an Online Real Estate Acquisition Model (Commercial & Industrial) Financial Model Template. So this financial model makes with logically correct financial and economic principles and assumptions.
5: Properly Integrated – The model assumptions and calculations are correlated. So the change in the main sheet will automatically lead to the change in all related sheets easily.
6: Visualization Tool – This Financial model also prepares a clear communication of the quantitative outcomes, as obtained by calculations via various graphs and charts. Therefore, the user does not need to pay much attention to the financial model’s inner workings.
# How To Use Real Estate Acquisition (Commercial & Industrial) Excel Financial Model
For the purpose of making this model easy to use, Oak Business Consultant has designed this Financial Model Template with maximum care. Each cell has a color code, and the input areas are all highlighted in peach color.
The User is only required to input data in color cells. All other cells are either helping calculations or results of the model. Therefore there is no need to change any other cell except colored cells.
# More About Financial Modelling:
Contact our expert if you are confused about buying our template. The experts can provide you a 15 min DEMO of the financial model.
# Consultation:
If you are not sure about the numbers, you can hire us as your consultants. We have a pool of Financial Experts who could advise numbers like growth rate, first-year operational expenses, employee headcount, sales capacity, etc.
This Best Practice includes
Excel File
