
Originally published: 01/03/2018 15:33
Last version published: 01/08/2019 15:26
Publication number: ELQ-25391-3
View all versions & Certificate
Last version published: 01/08/2019 15:26
Publication number: ELQ-25391-3
View all versions & Certificate

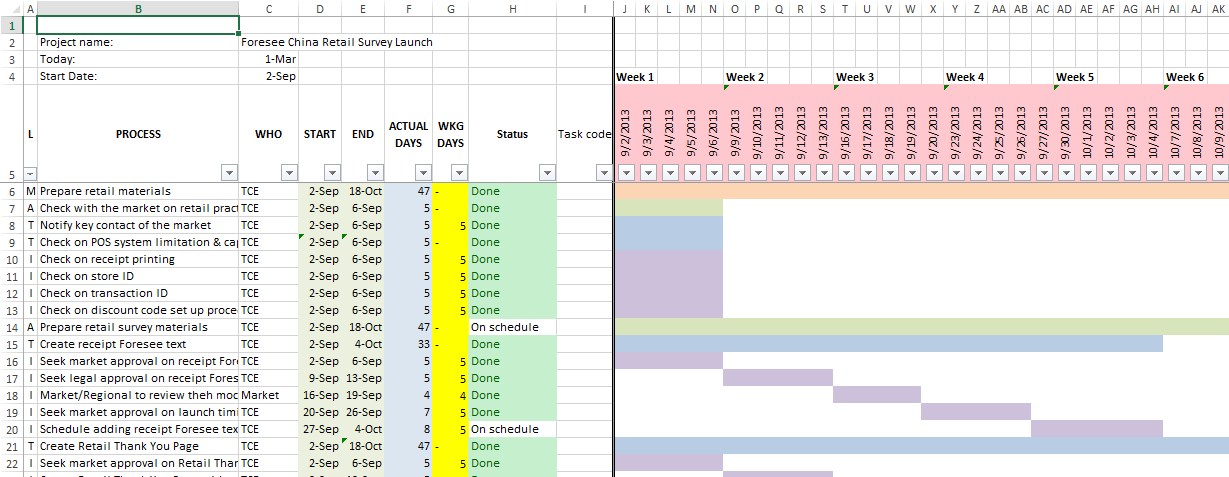
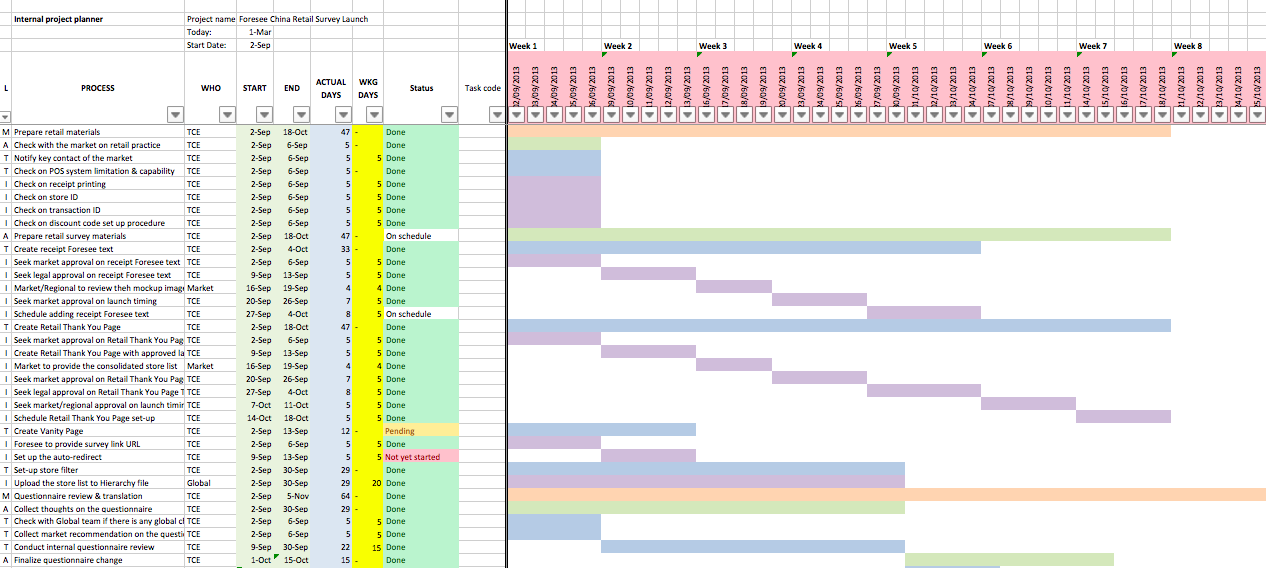
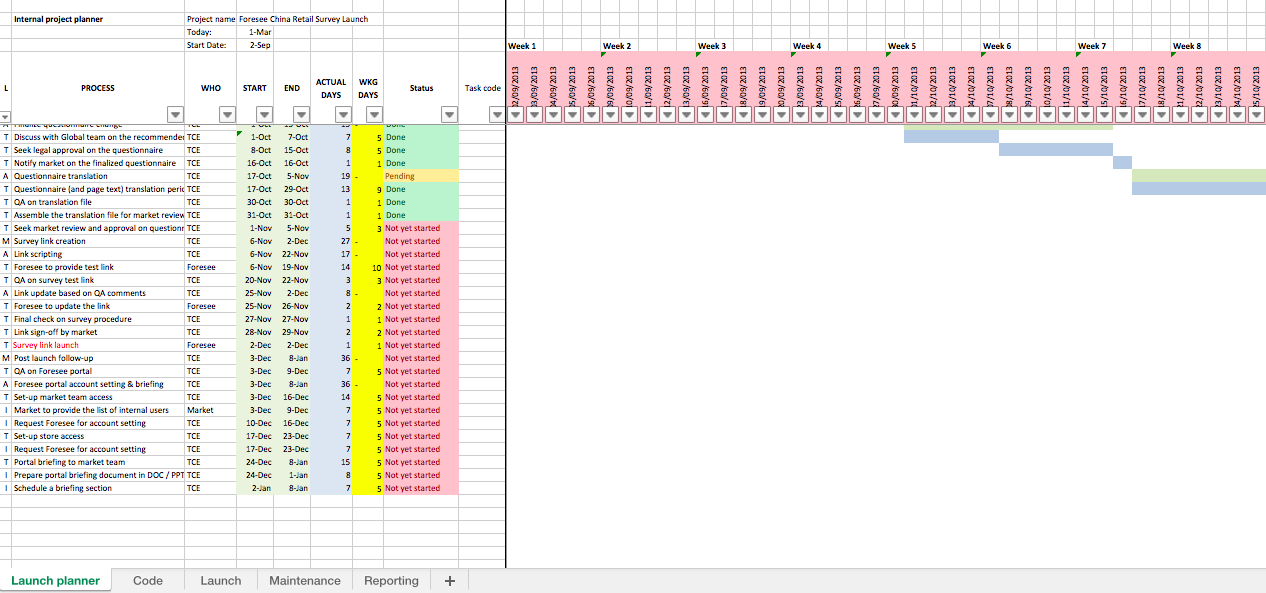
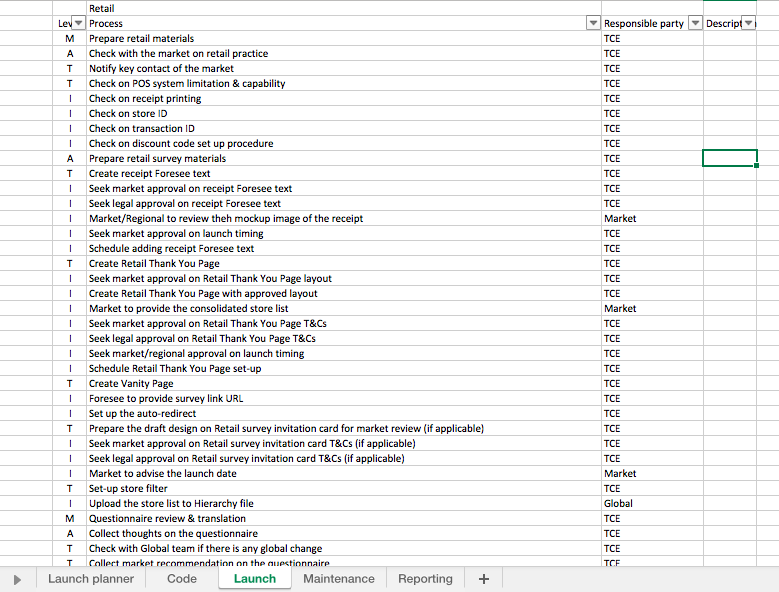
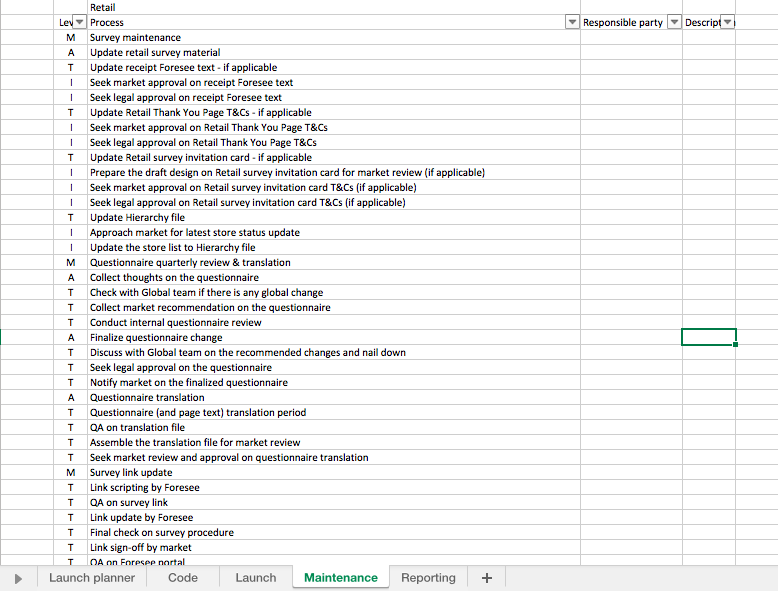
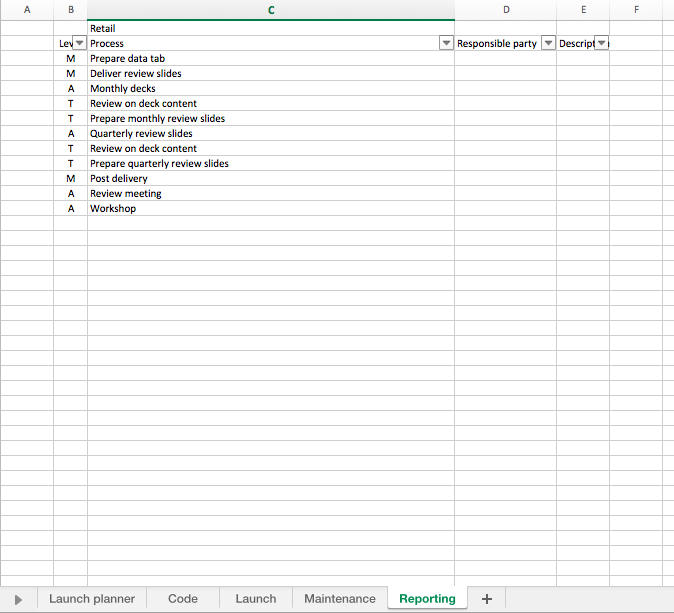
Project Timeline - Gantt Chart Excel Model
A Gantt chart template that is interactive with dates
