
Originally published: 28/06/2020 20:27
Publication number: ELQ-69289-1
View all versions & Certificate
Publication number: ELQ-69289-1
View all versions & Certificate

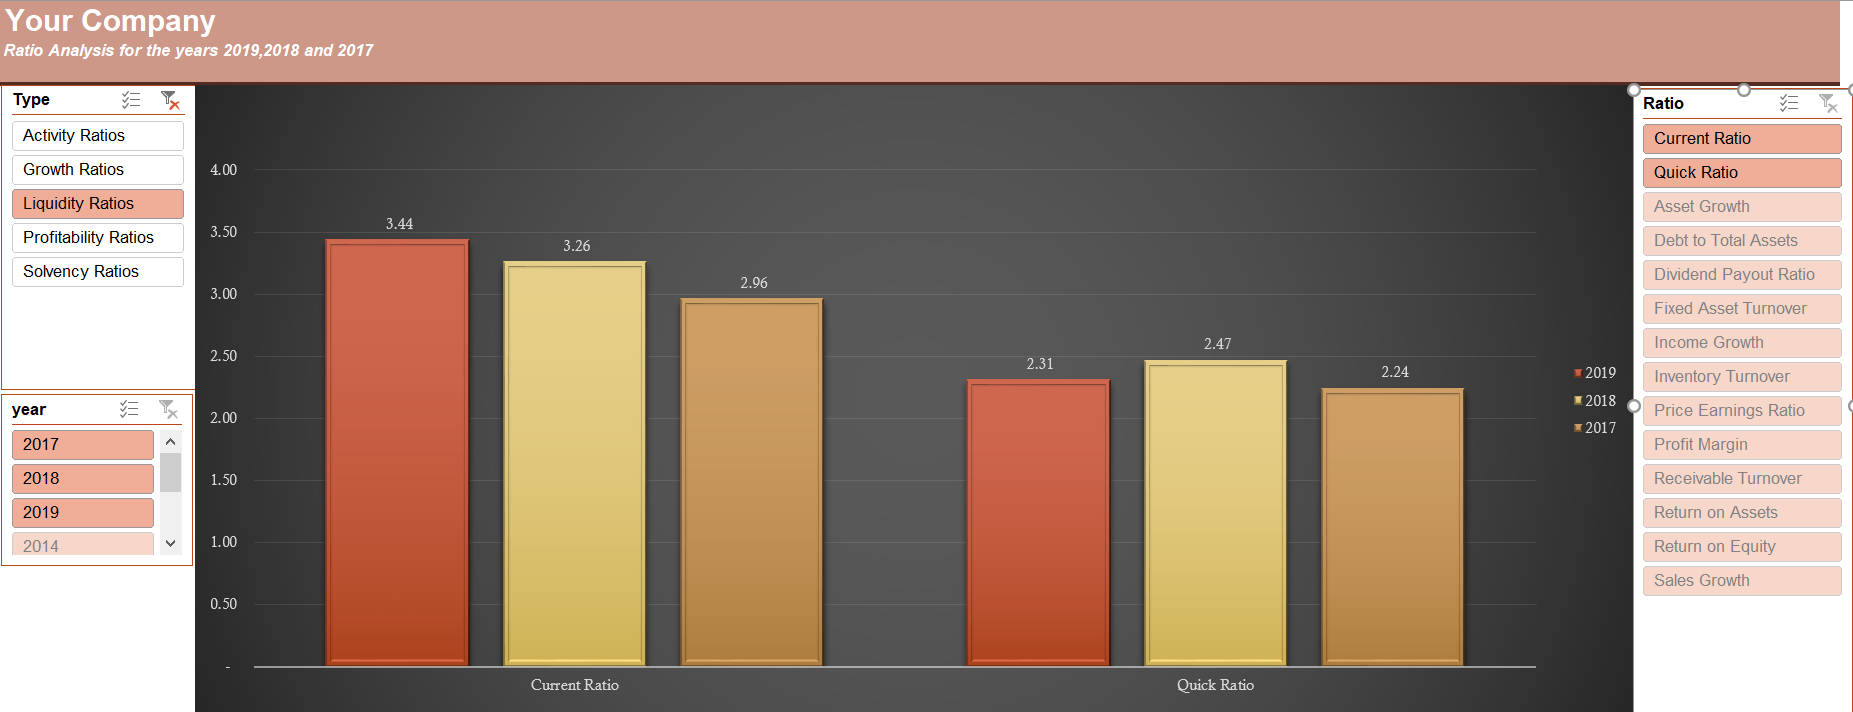
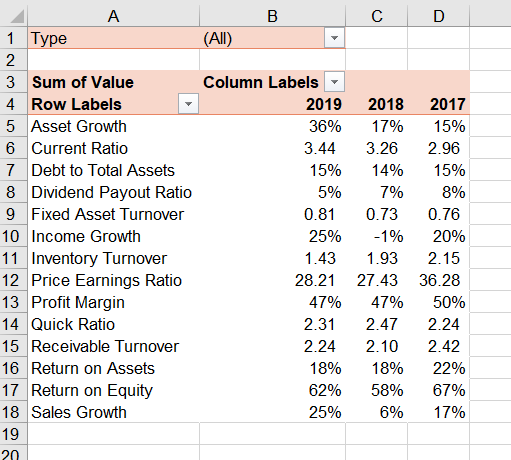
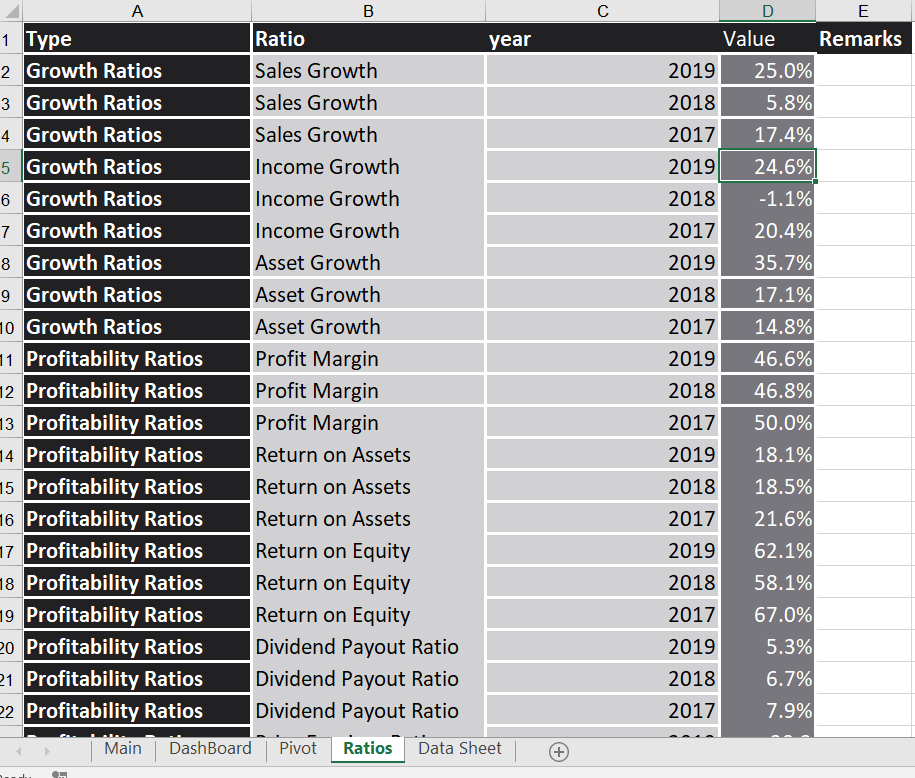
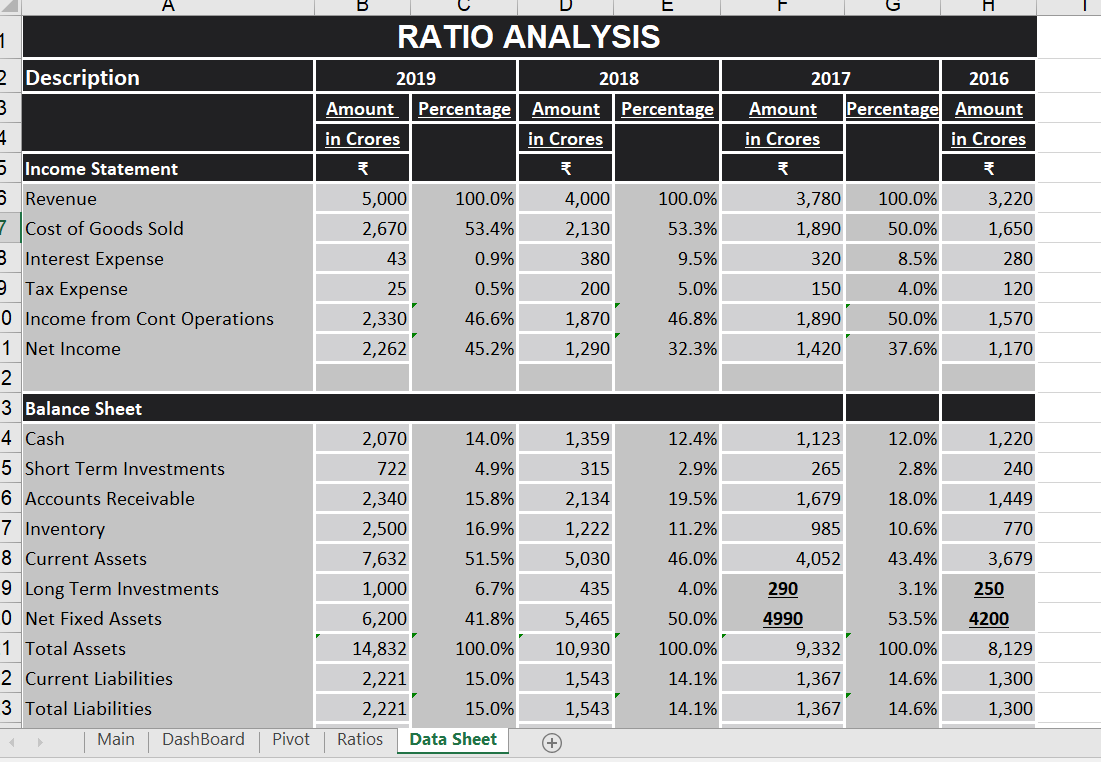
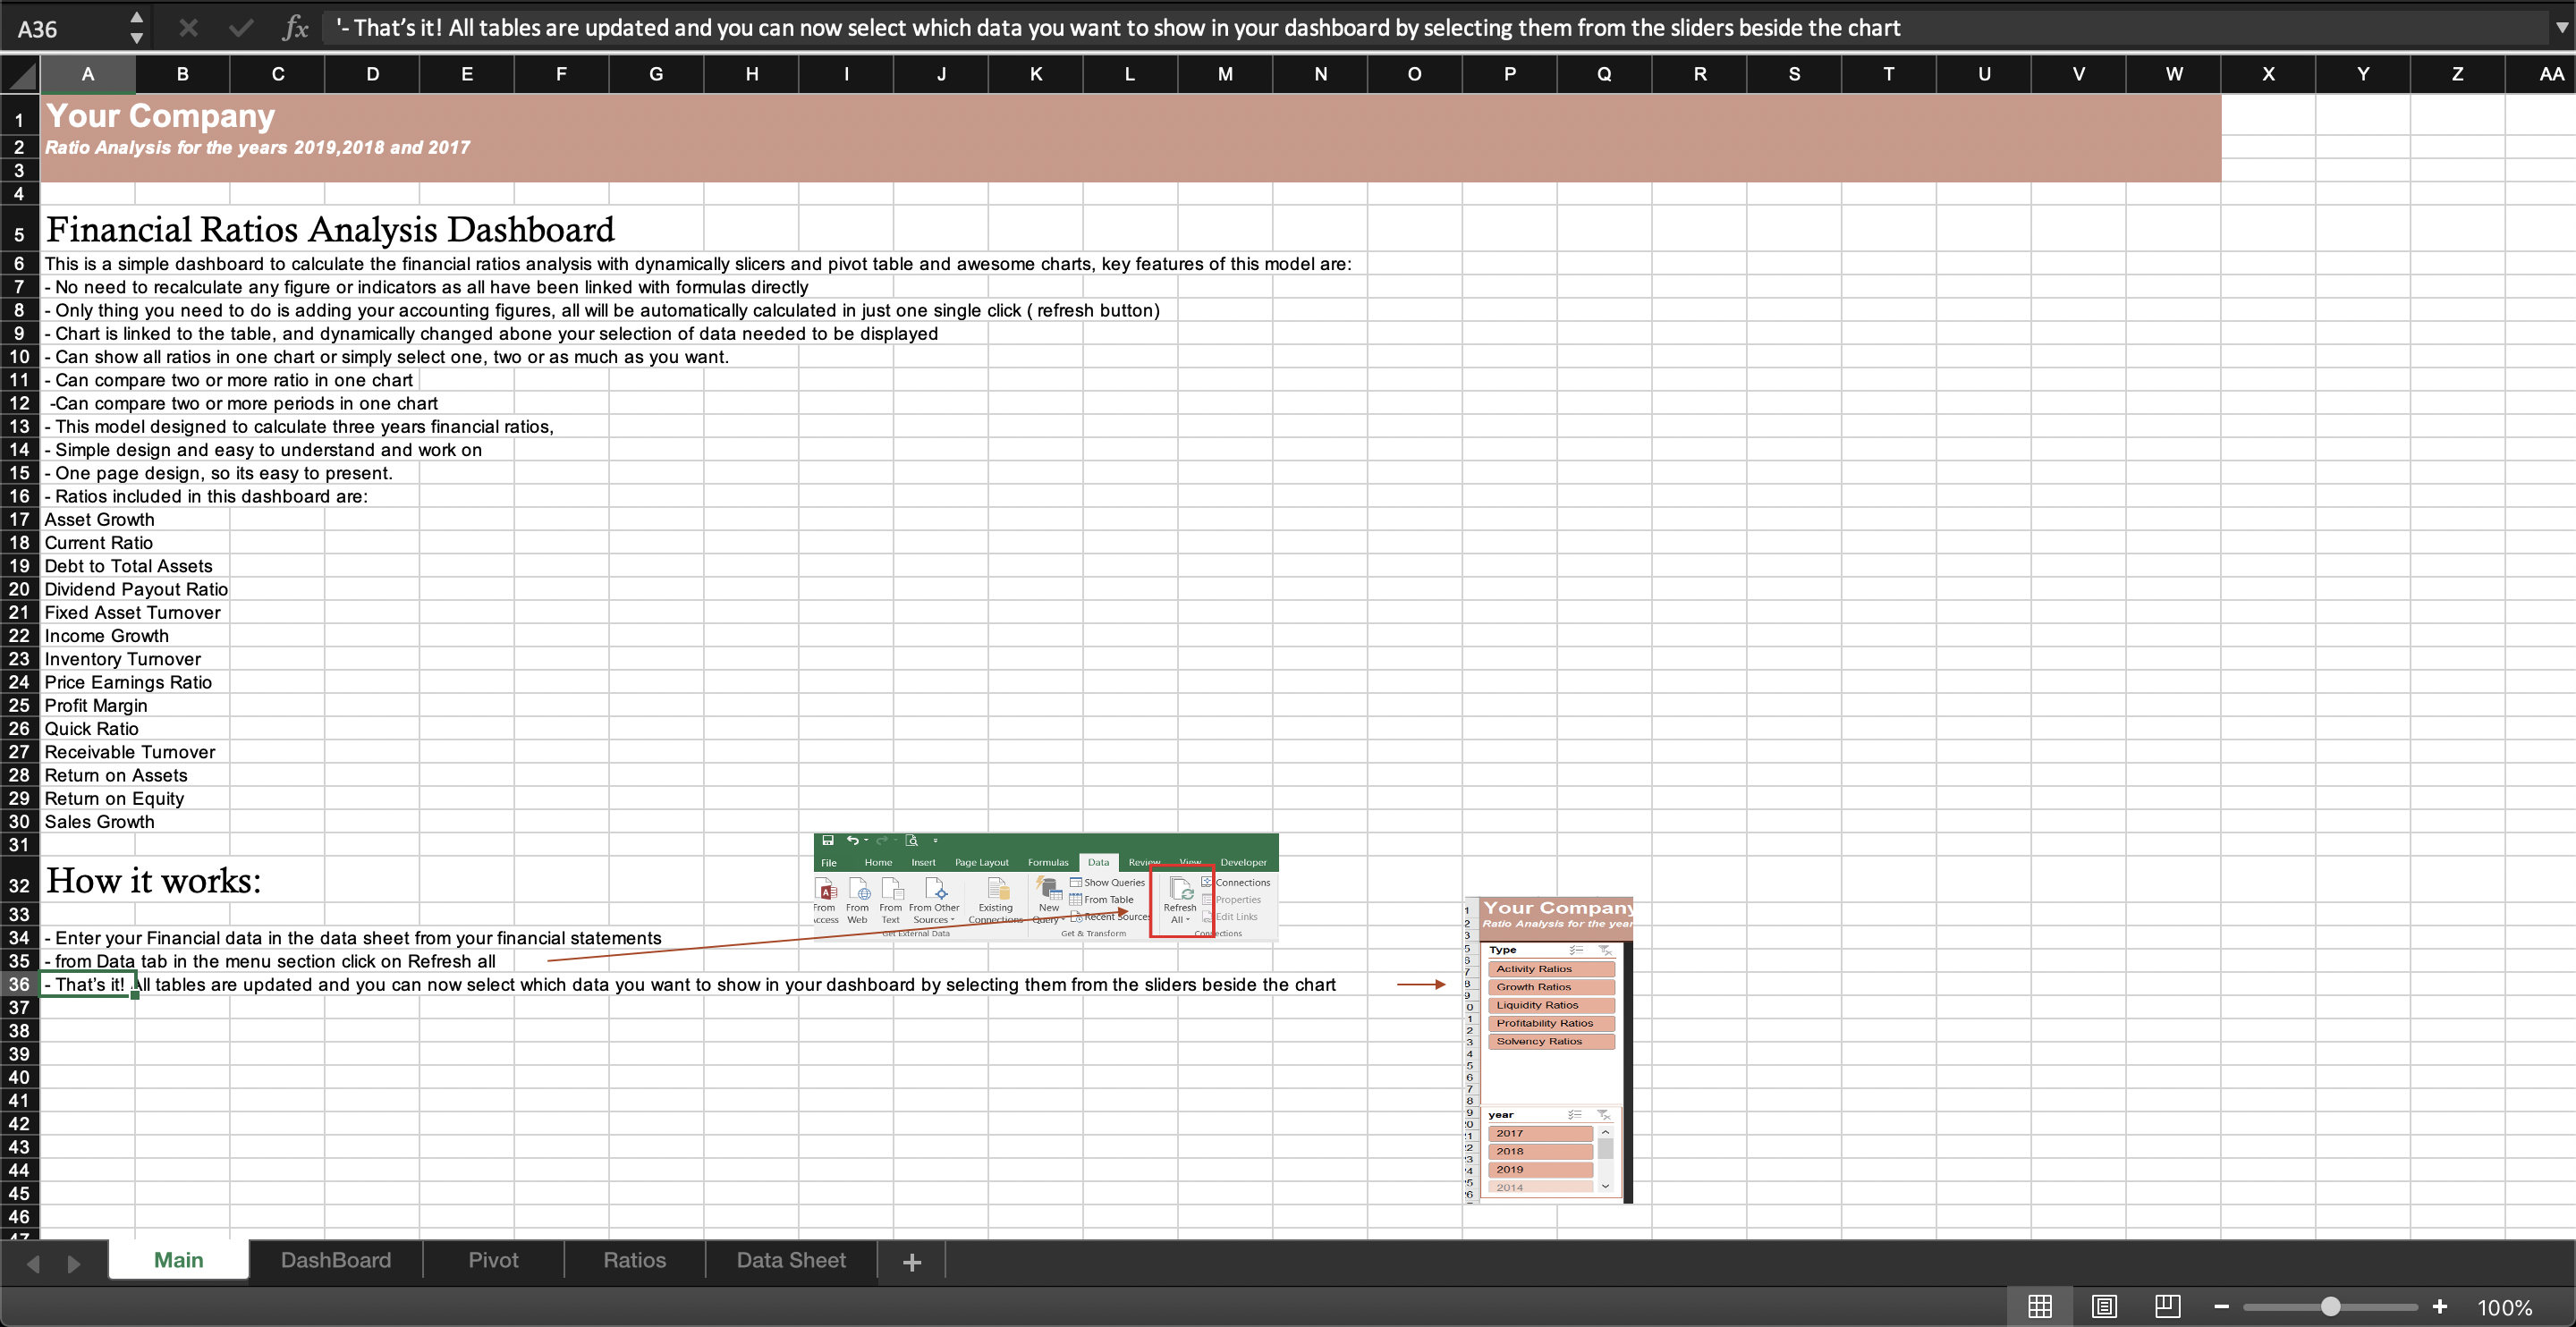
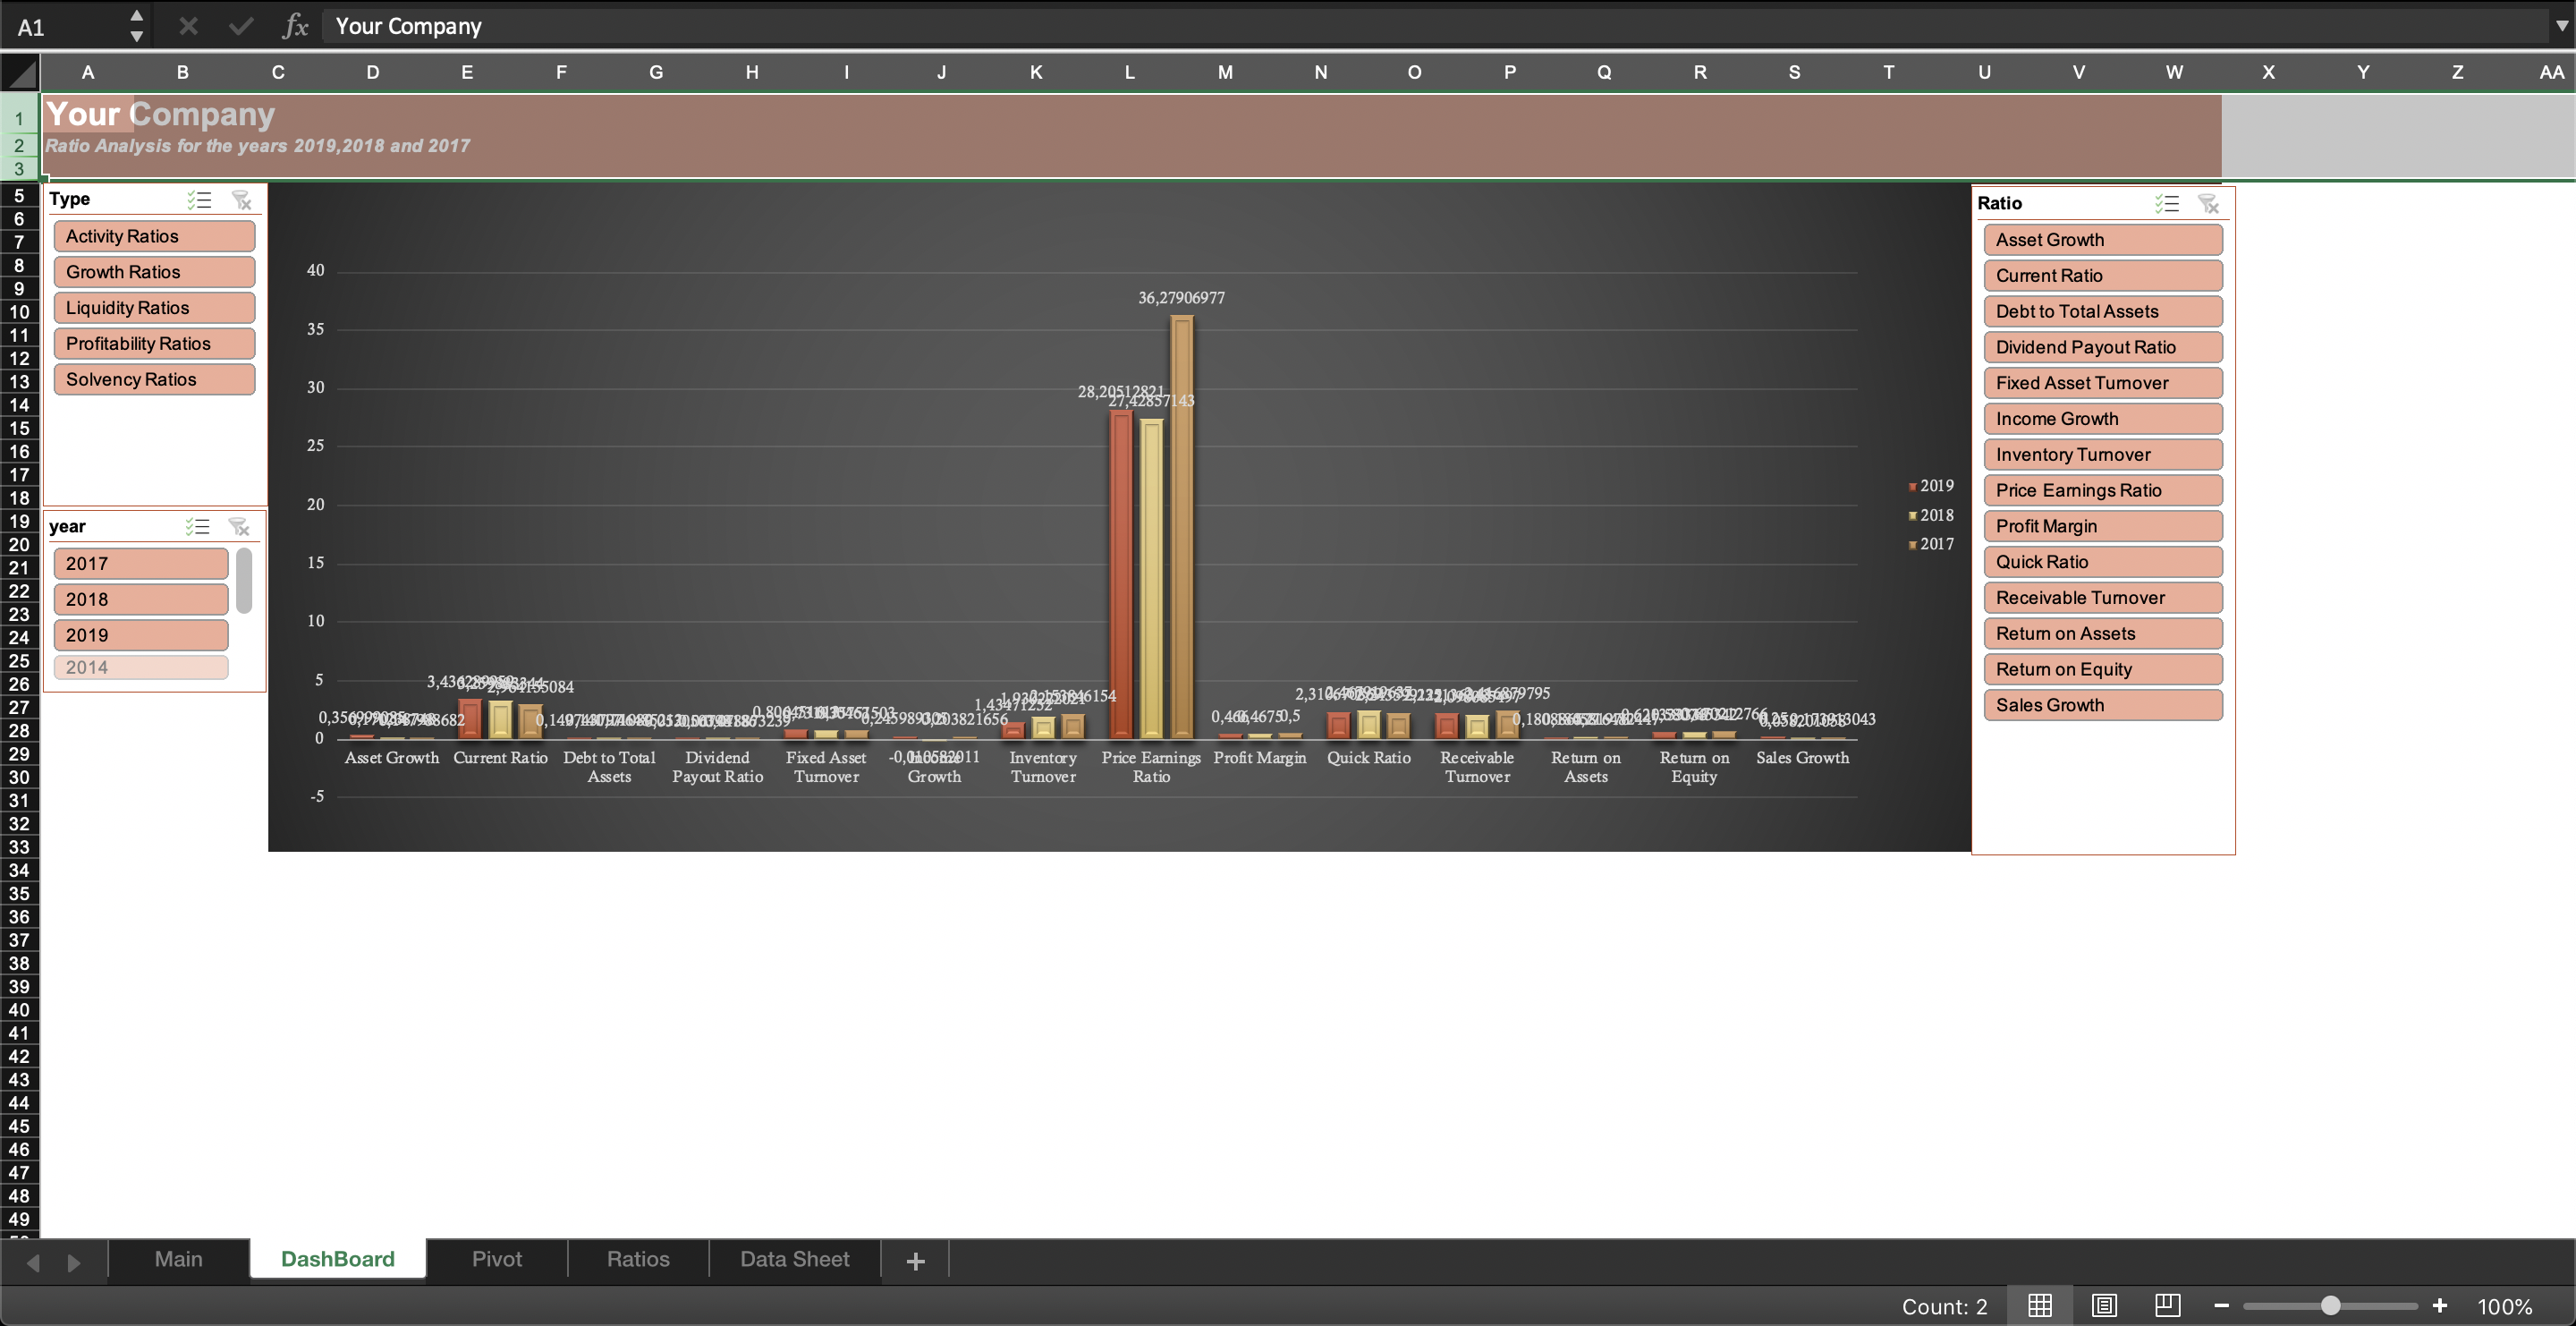
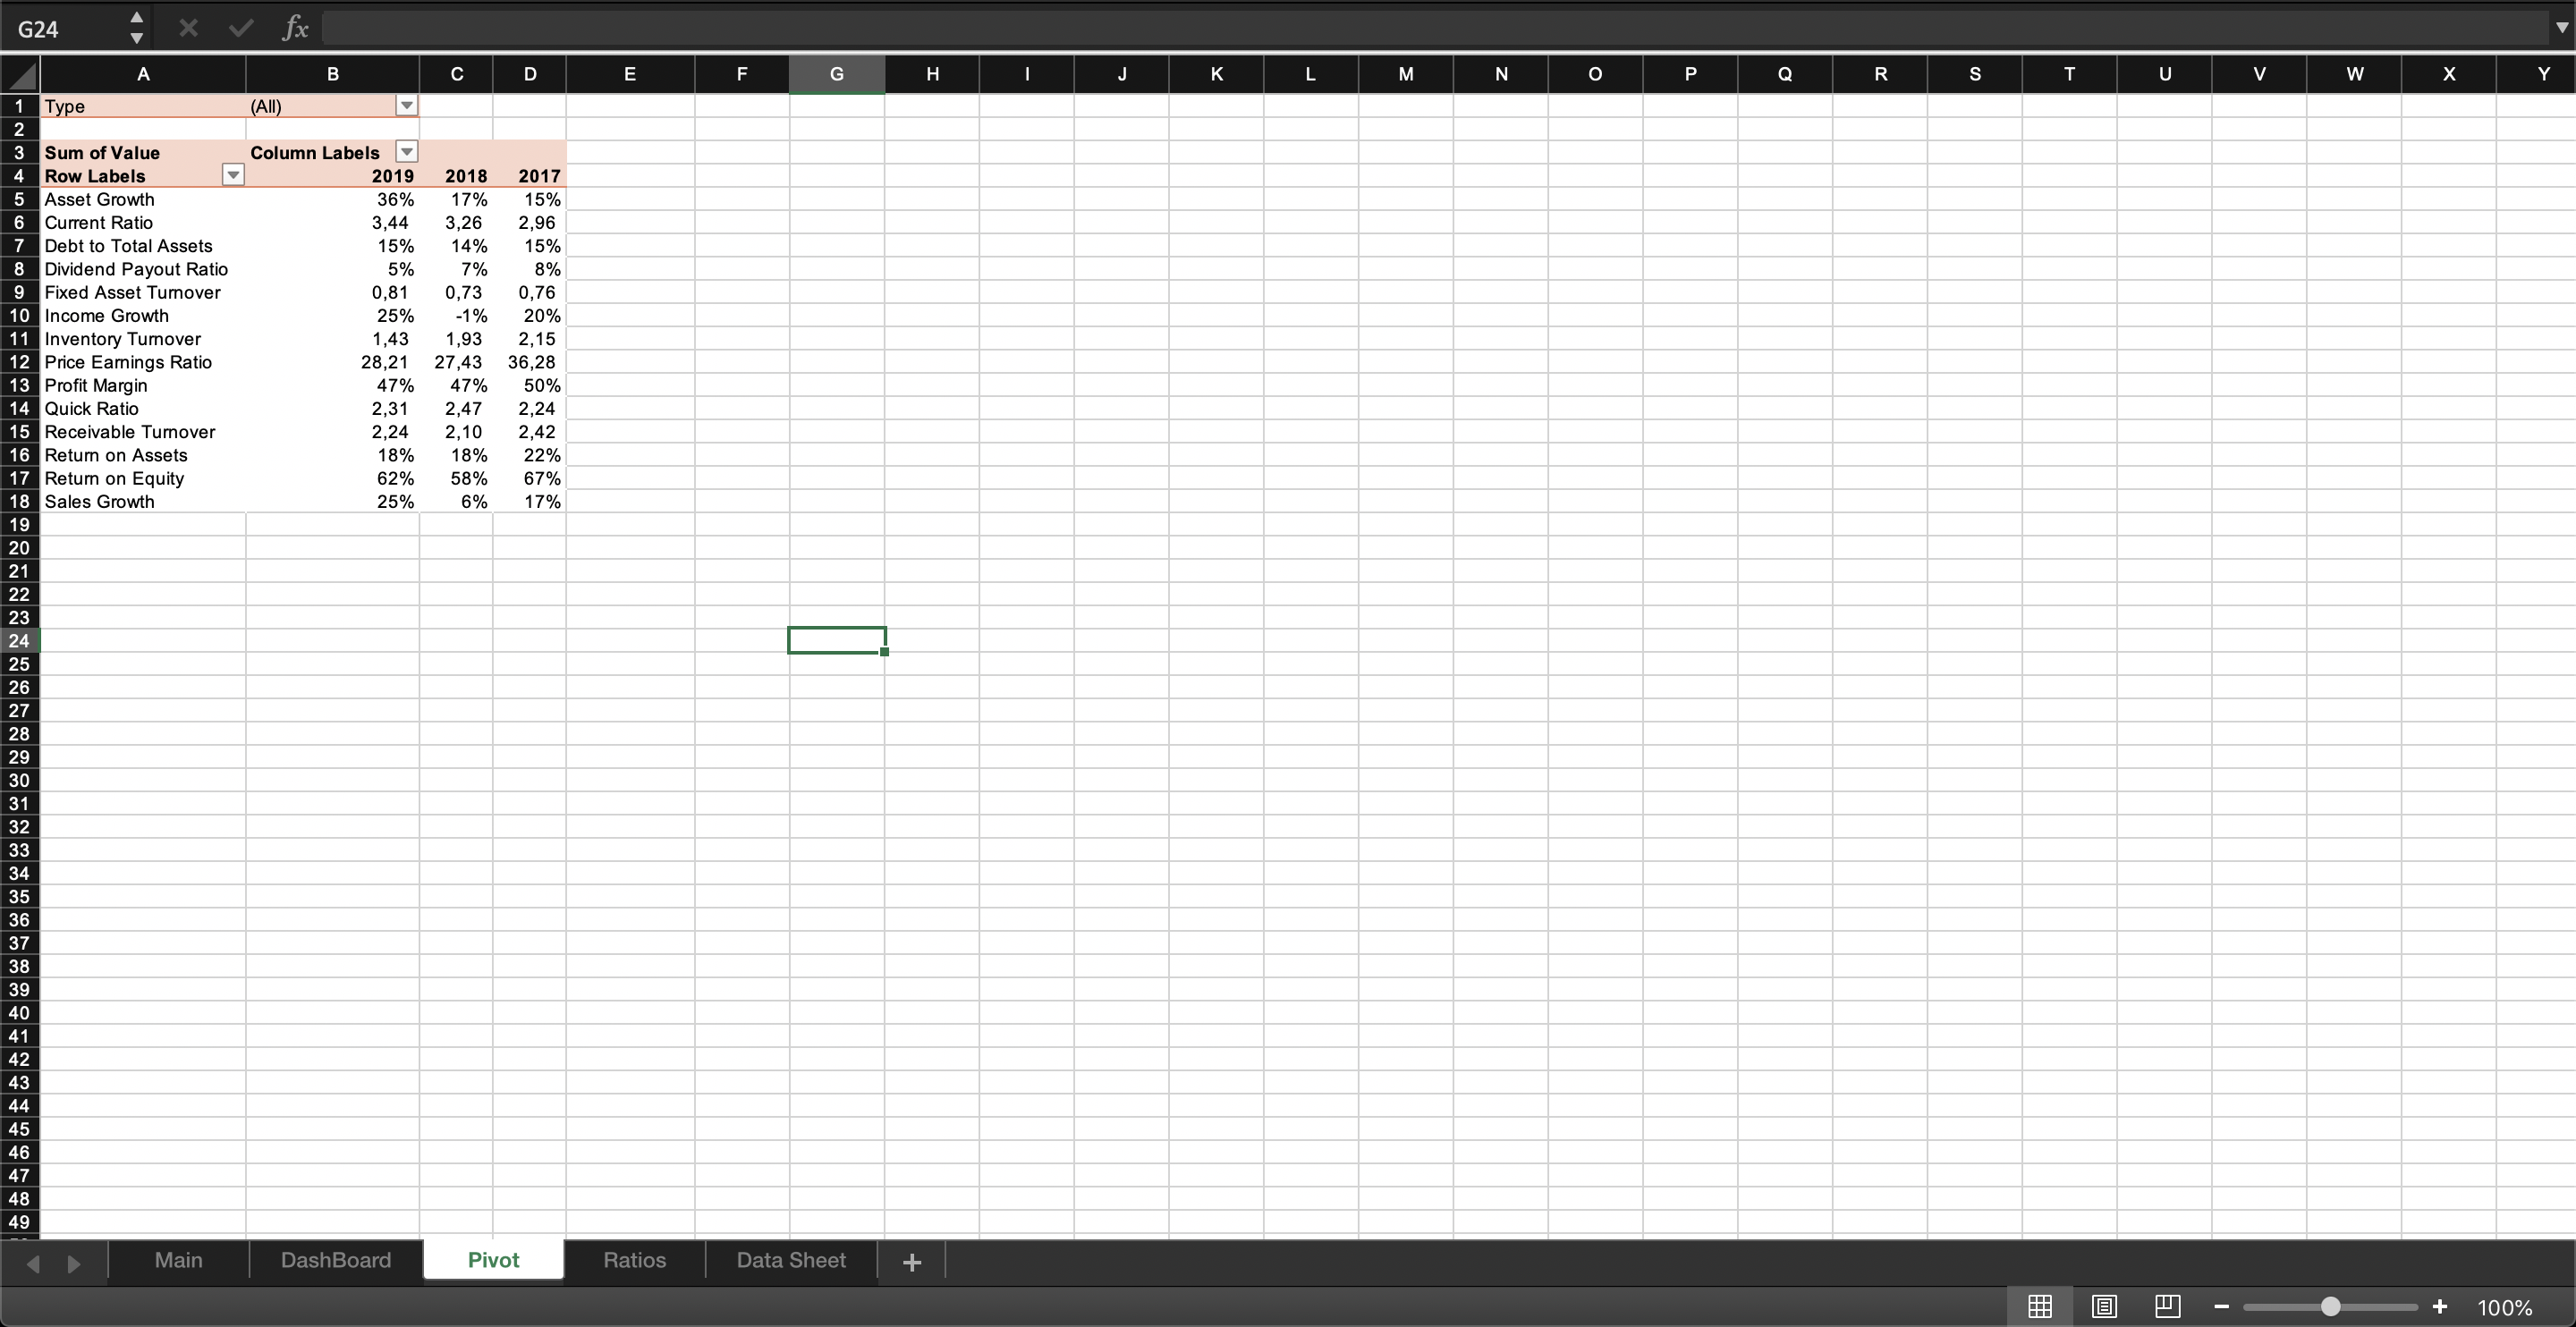
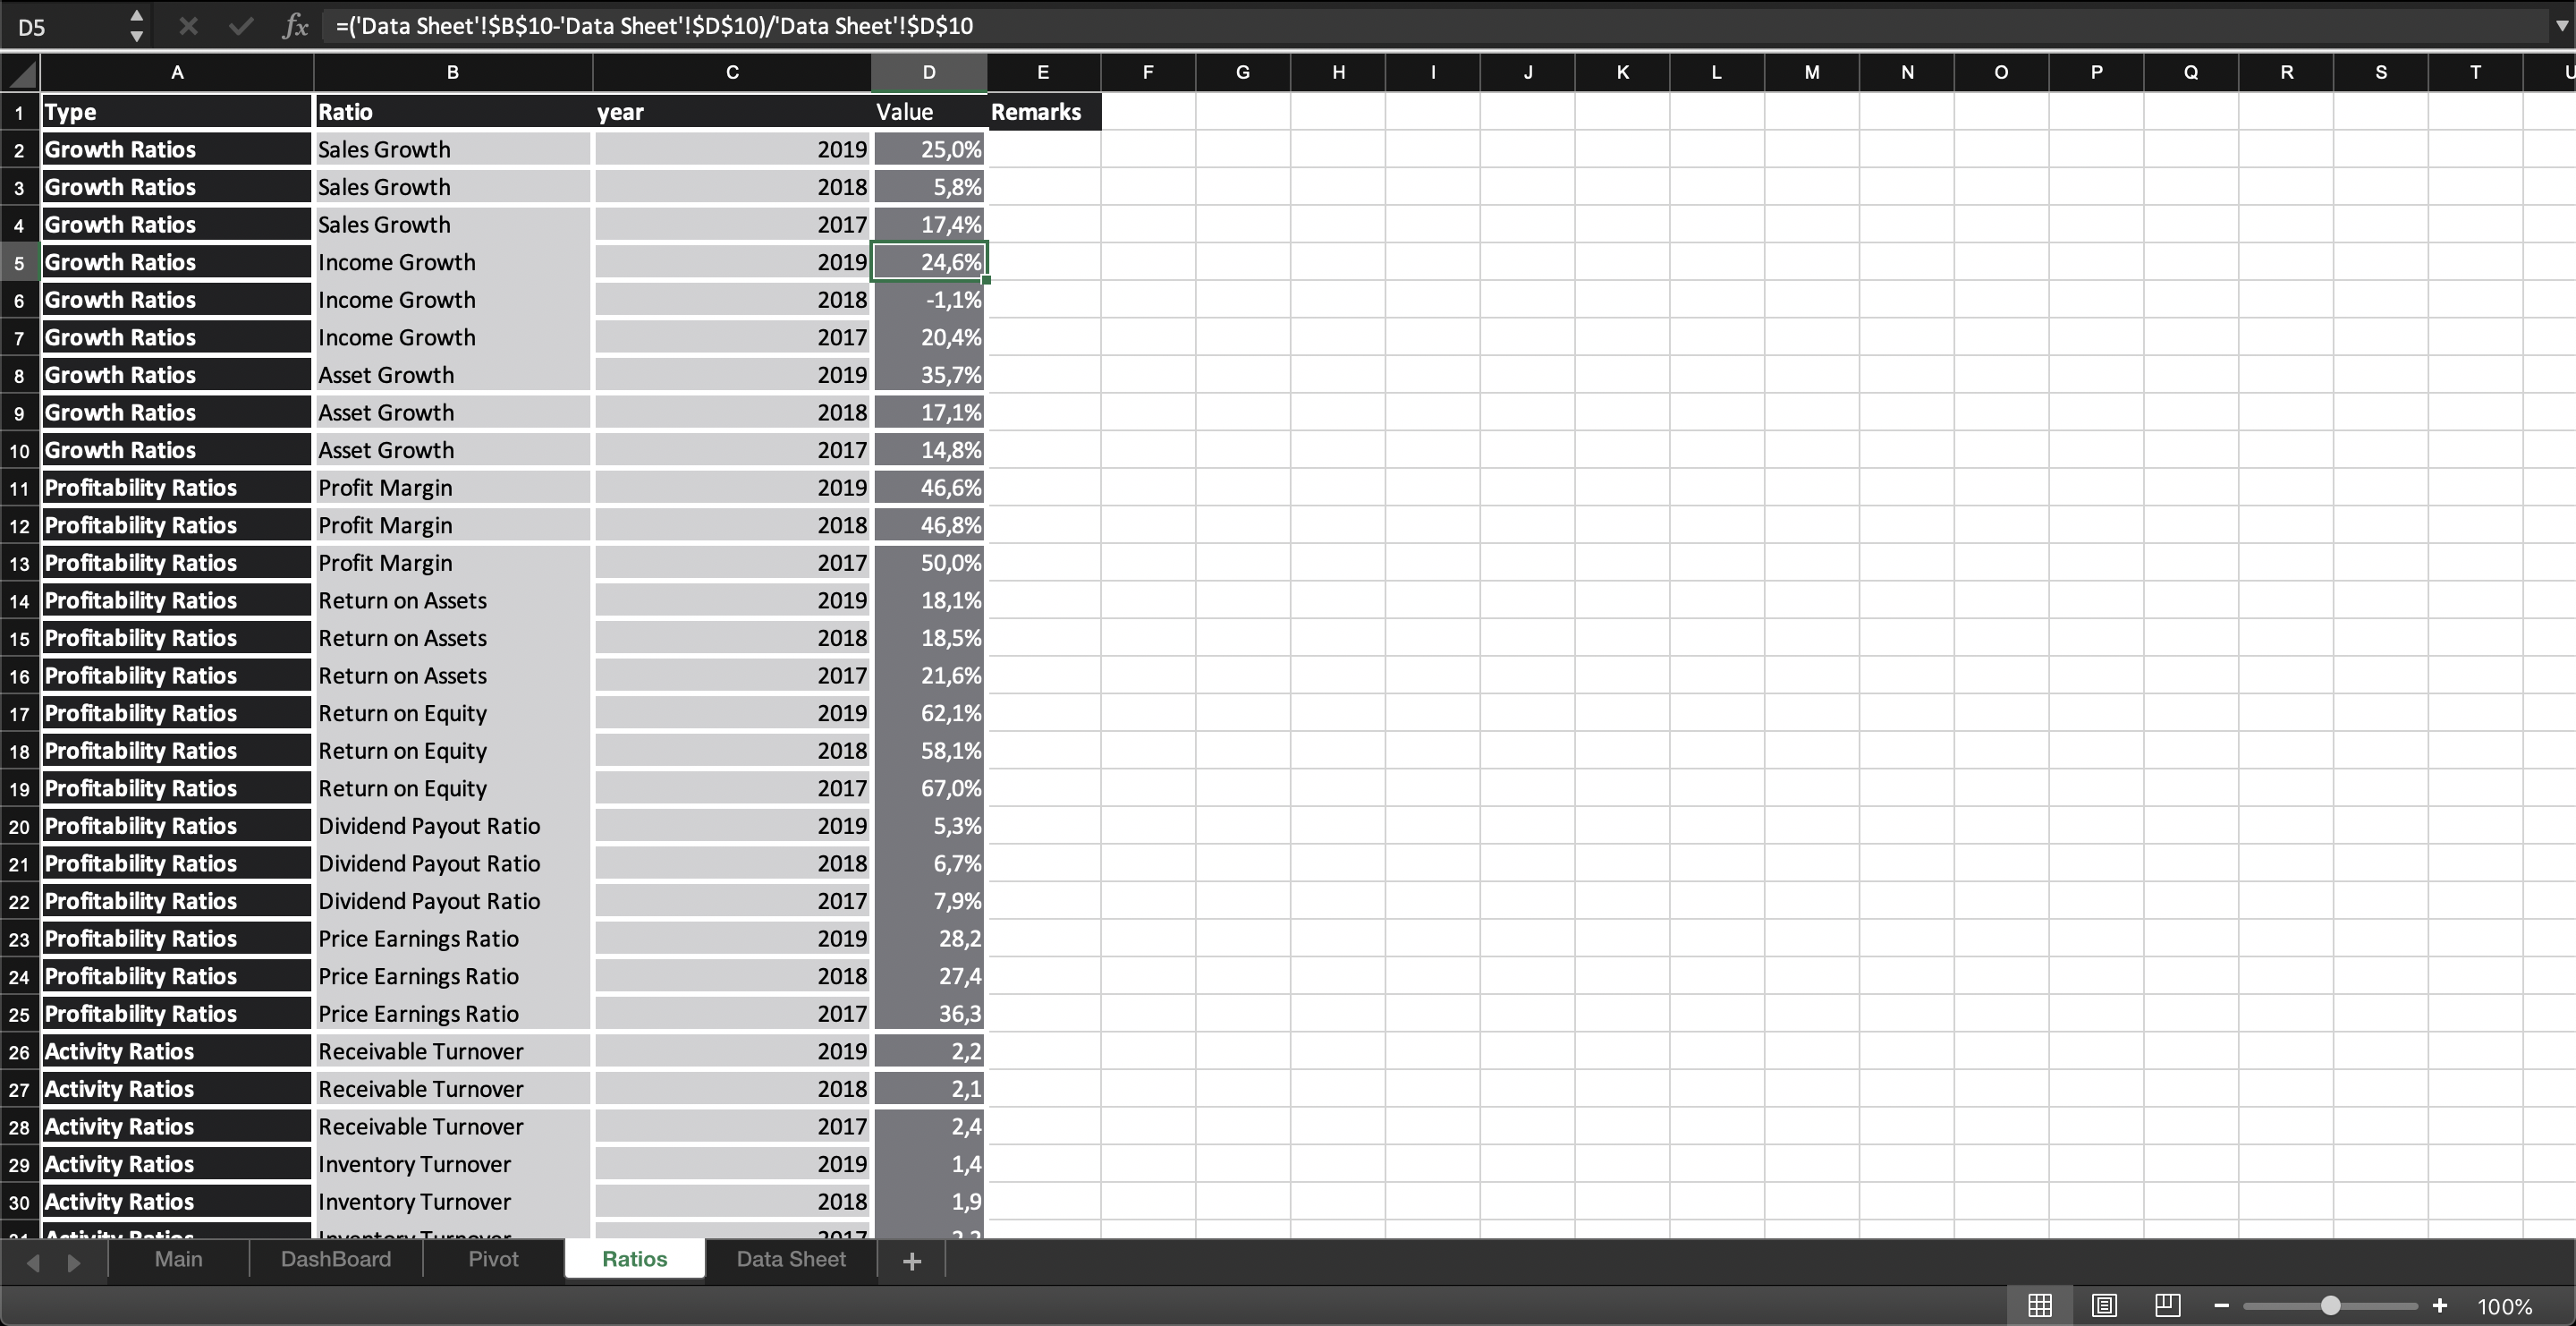
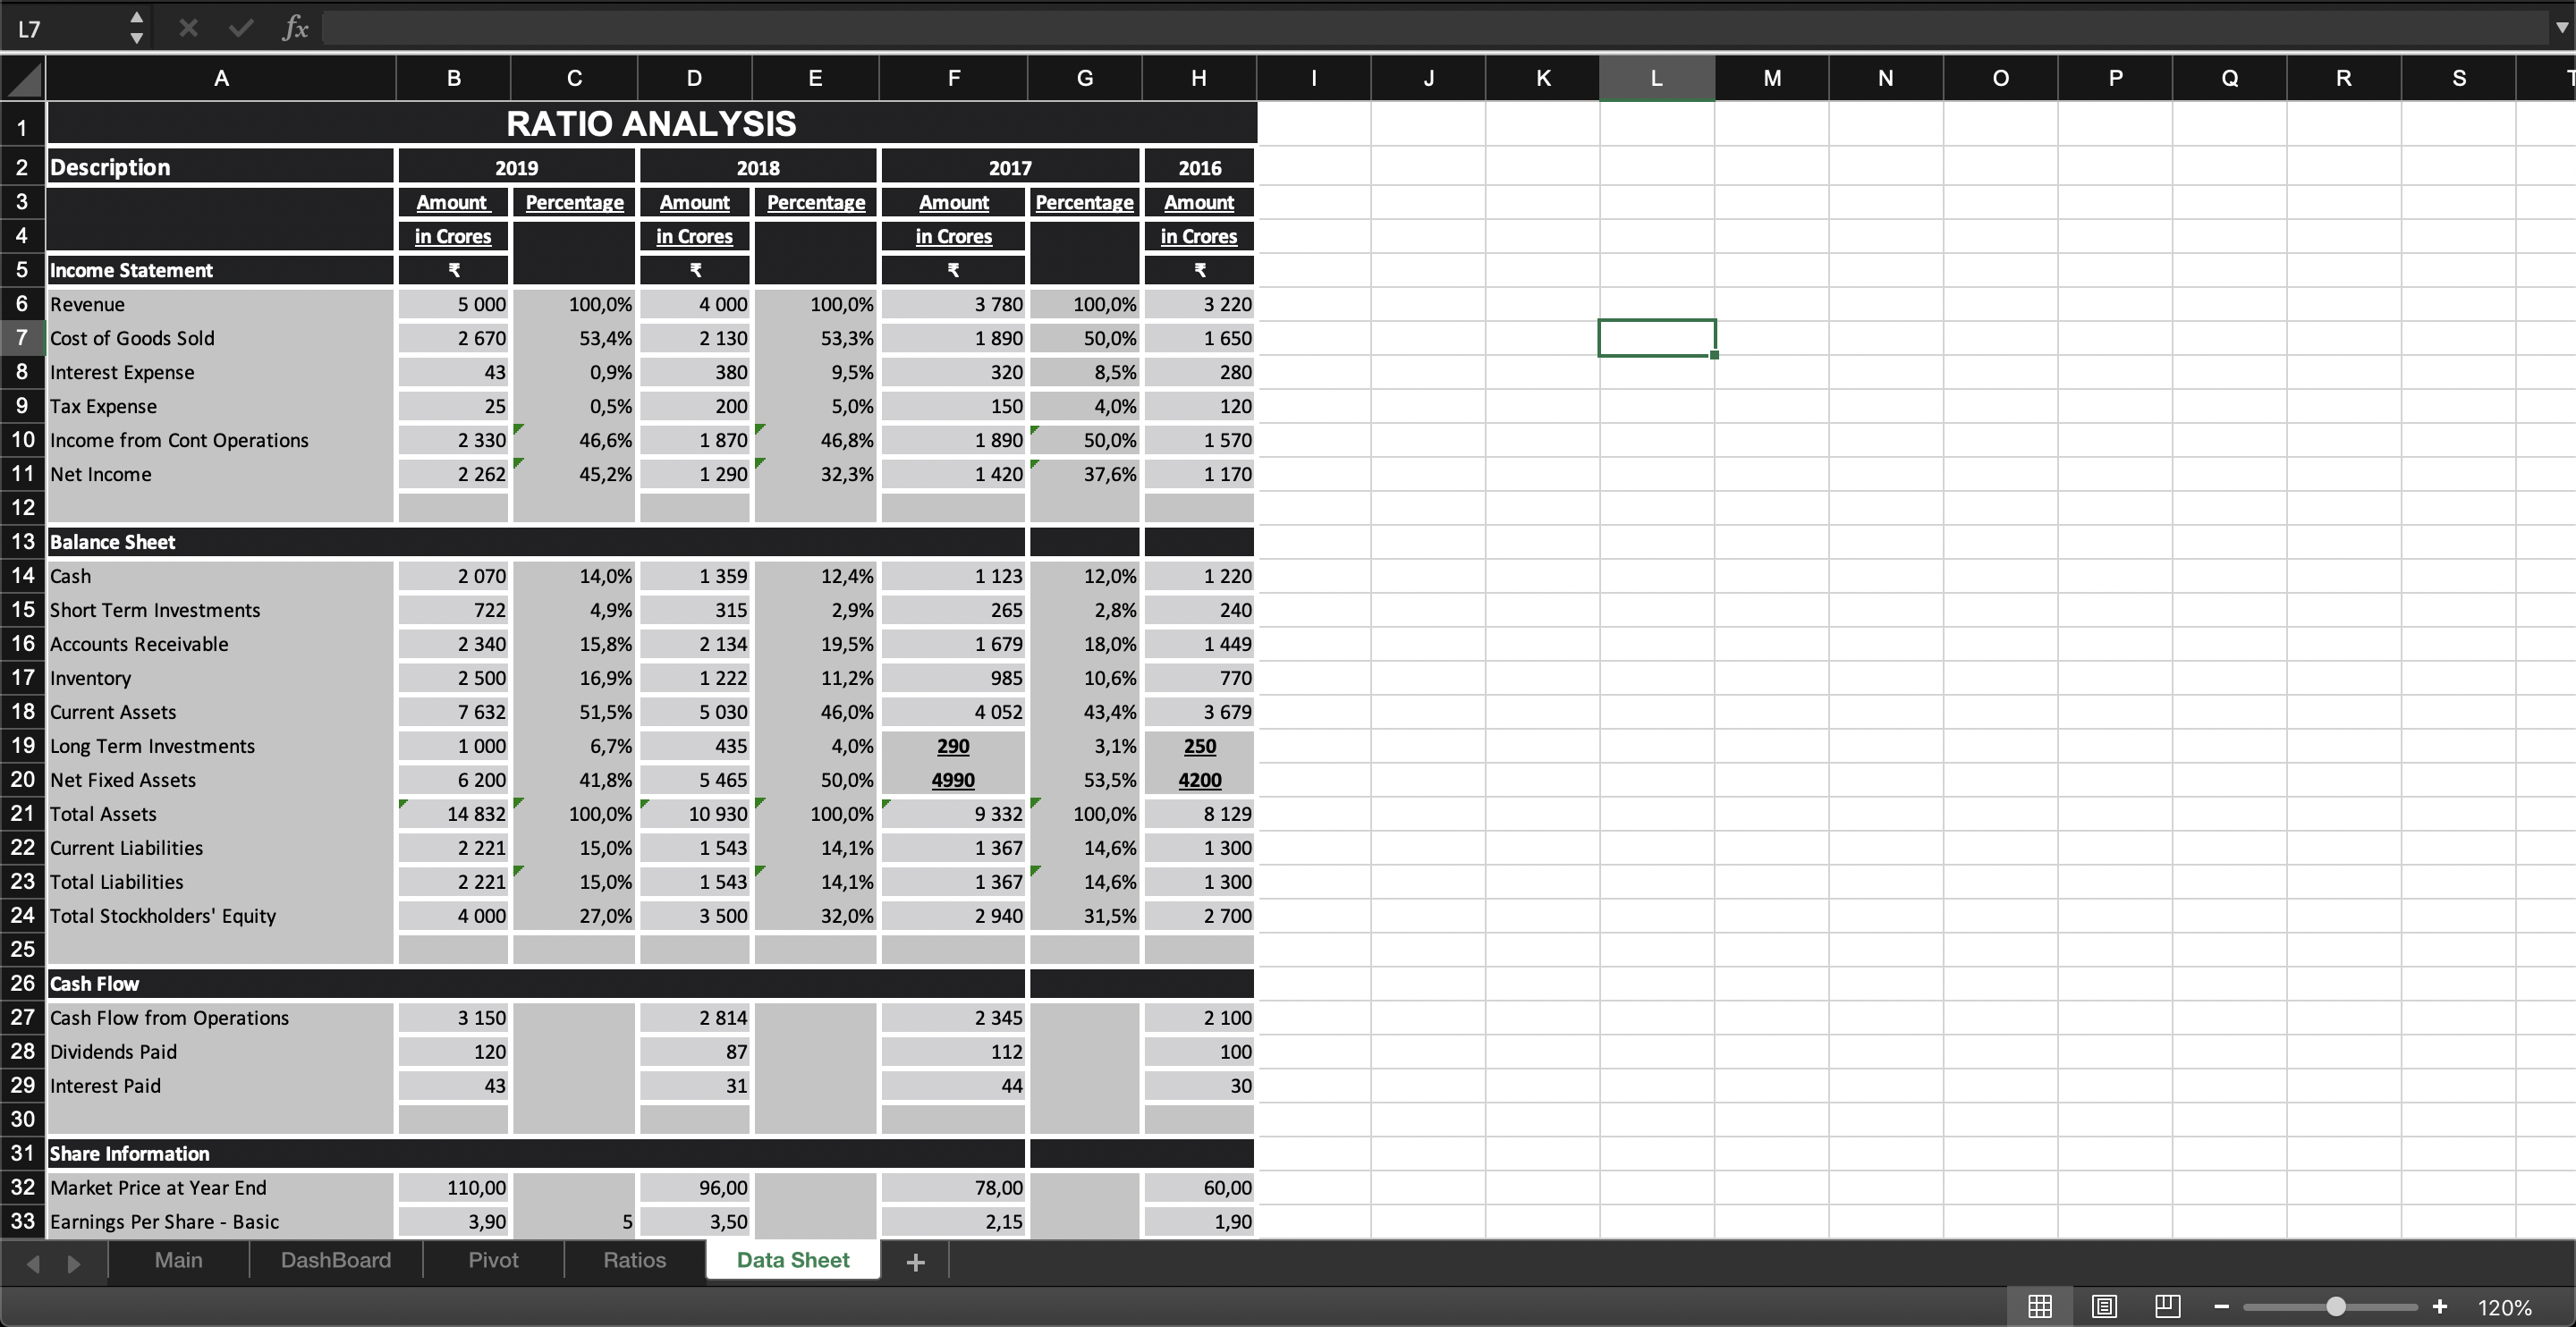
Financial Ratios Analysis Excel Dashboard
A simple Financial Rations Analysis Dashboard in Microsoft Excel.
Further information
Calculate the financial ratios with awesome chart and dynamic dashboard.
Analysis for financial data for any kind of companies.
