
Originally published: 28/06/2020 20:40
Publication number: ELQ-89022-1
View all versions & Certificate
Publication number: ELQ-89022-1
View all versions & Certificate

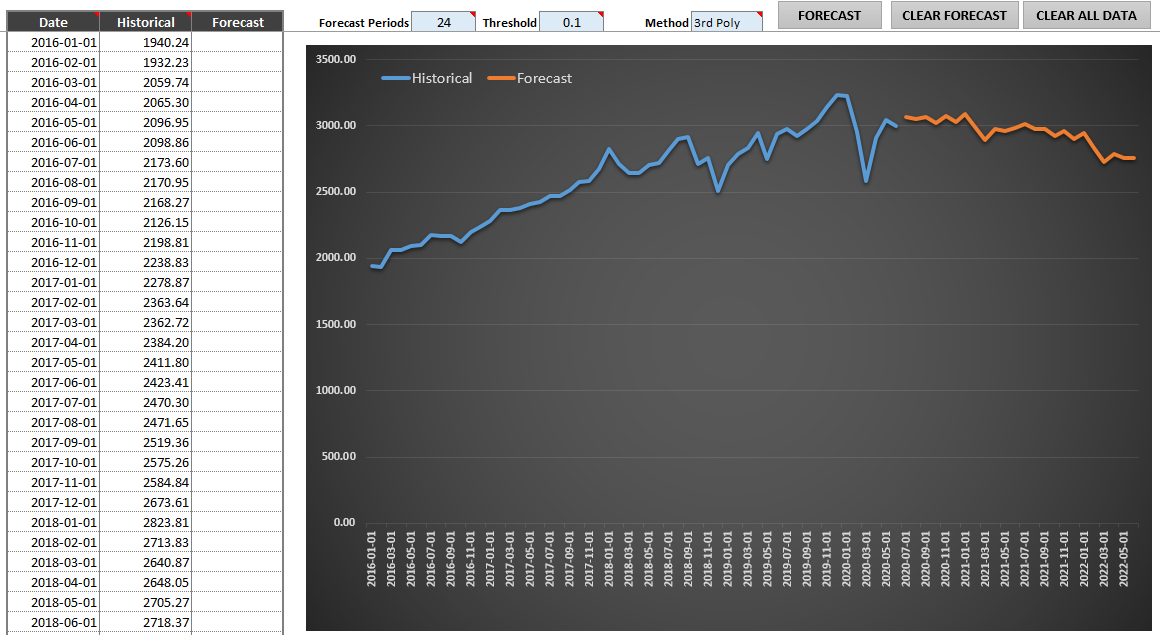
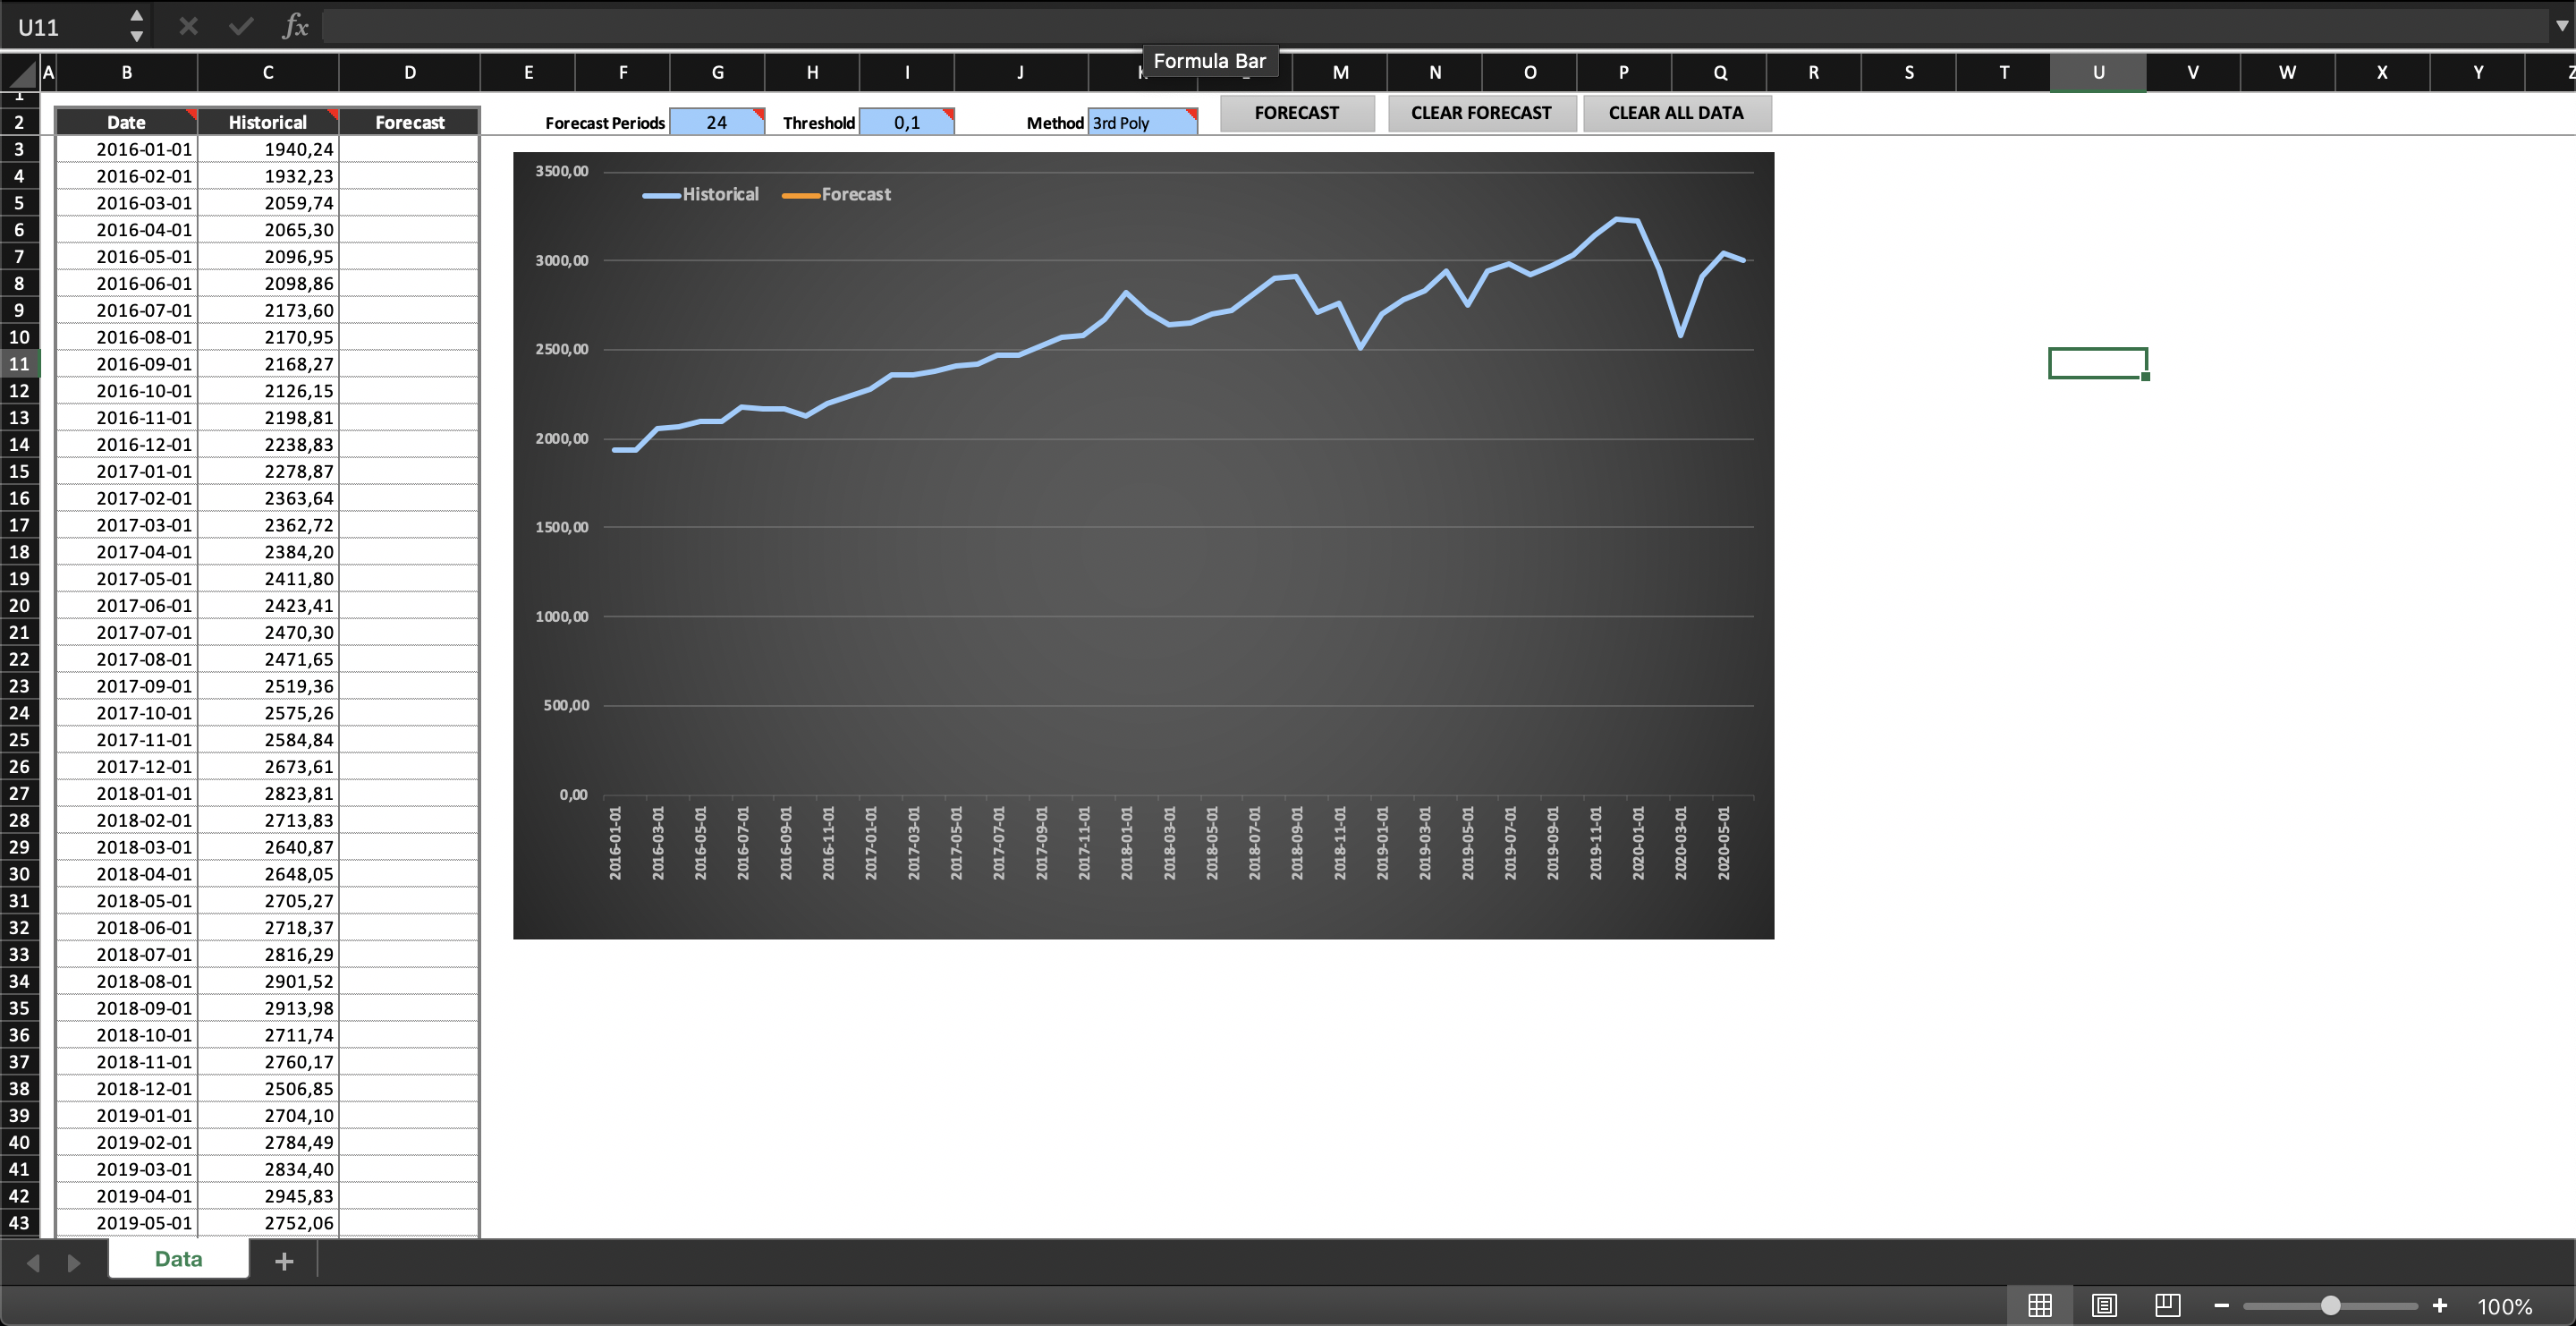
Seasonality Forecasting with Time Series Decomposition
Data forecasting with analysis of periodic variation in predicted data projections.
Purpose built Excel solutins for business and finanacial decision makingFollow 165
Business Spreadsheets offers you this Best Practice for free!
download for free
Add to bookmarks
Further information
Create forecasts with identified seasonality or risk variation within projections.
Financial data projections where repetitive variation such as seasonality is inherent.
Forecasting data where there is no discernible repetitive variation.
