Originally published: 24/07/2019 09:02
Last version published: 08/08/2019 20:39
Publication number: ELQ-84916-4
View all versions & Certificate
Last version published: 08/08/2019 20:39
Publication number: ELQ-84916-4
View all versions & Certificate

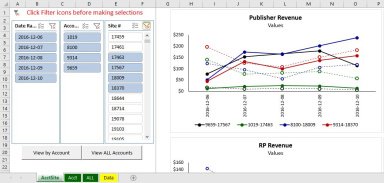
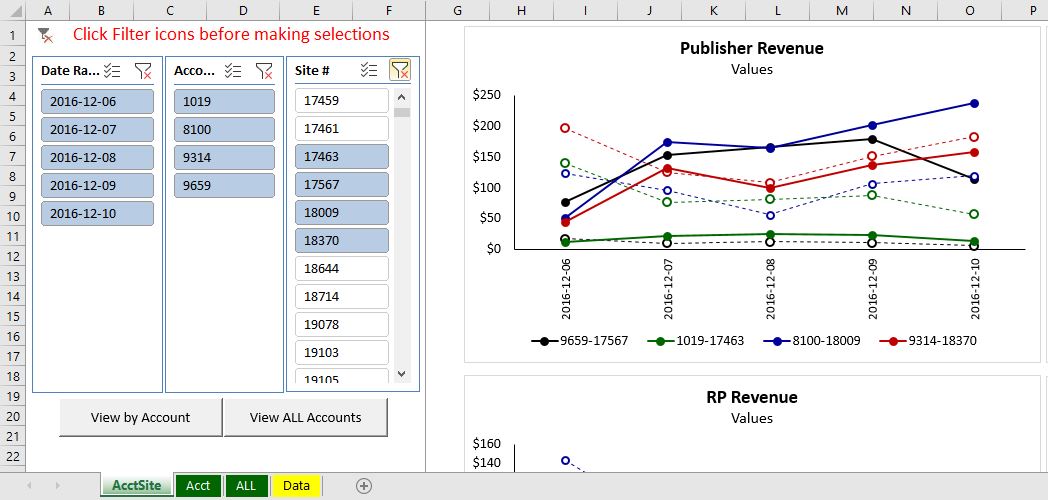
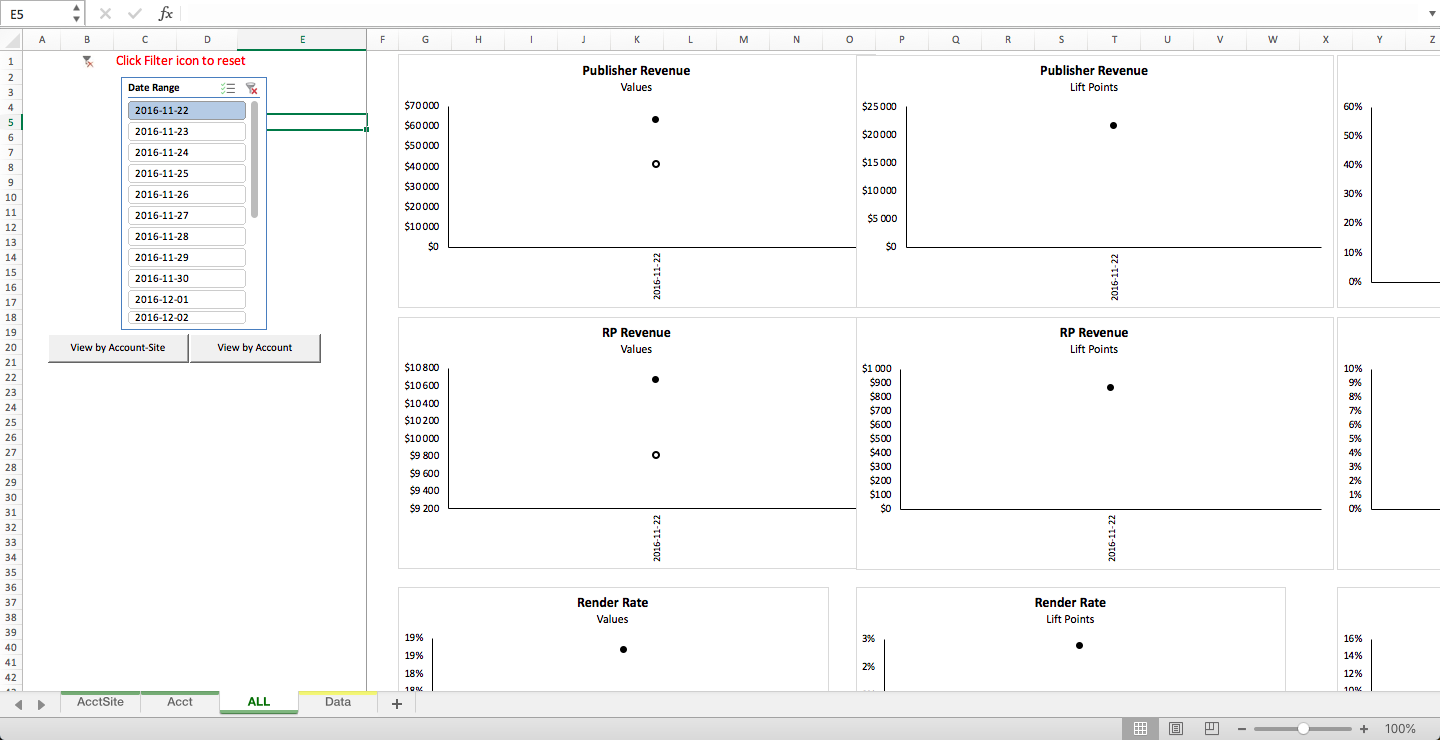
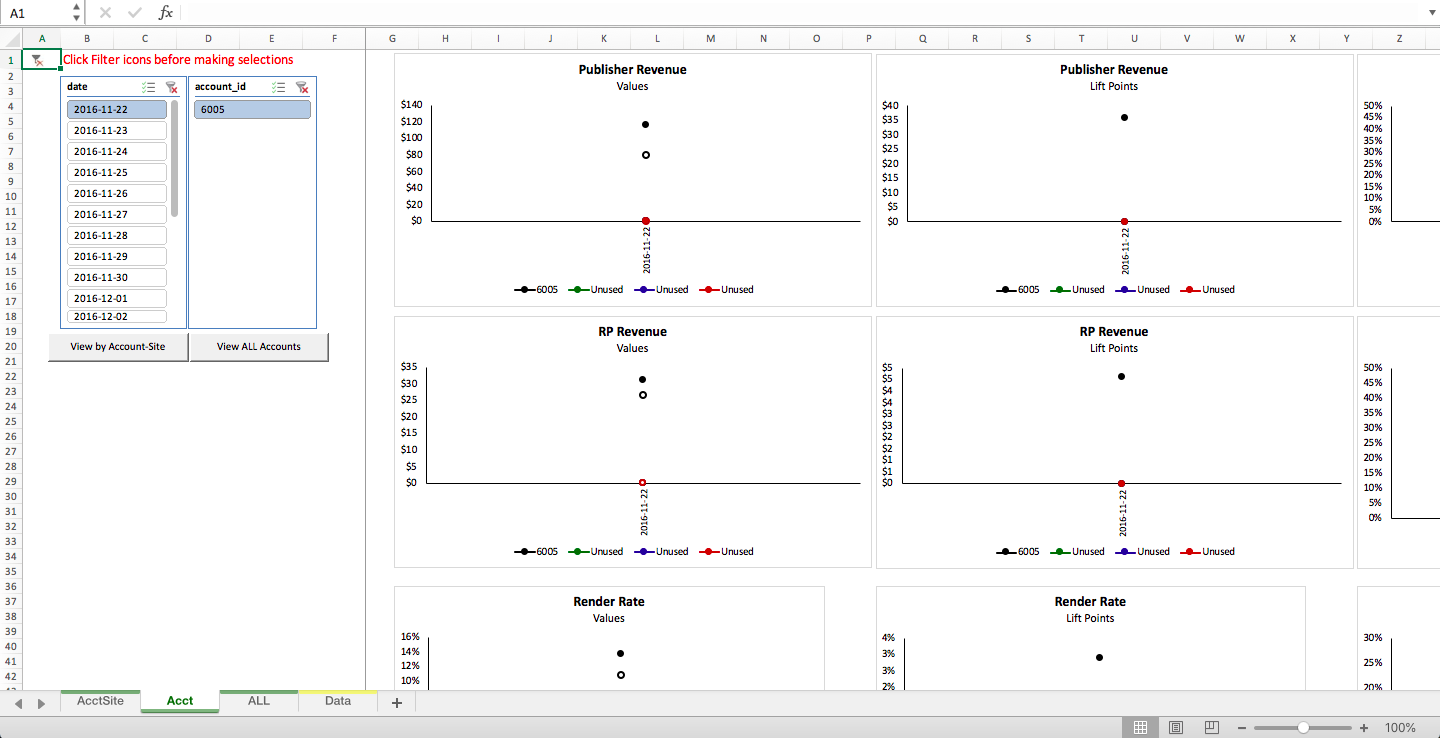
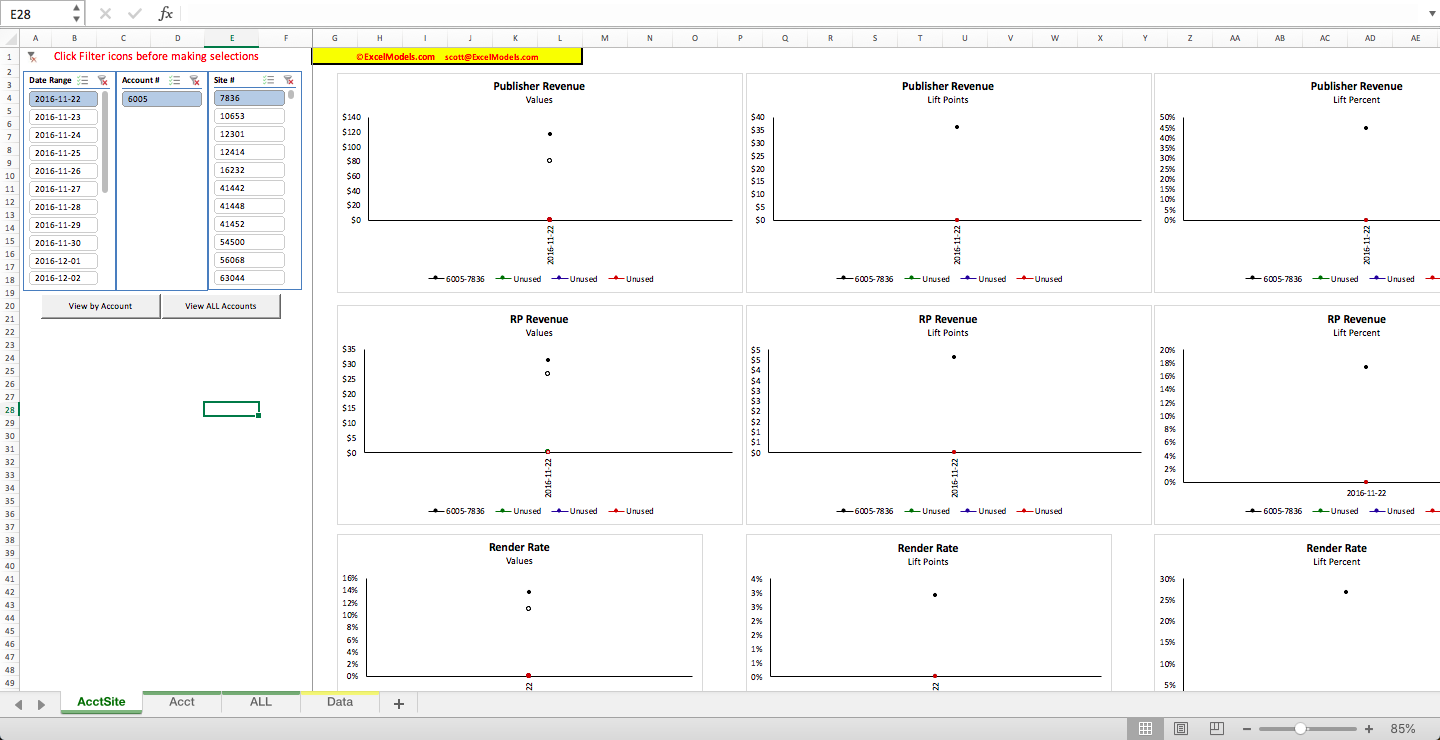
Dynamic Graphing in Excel (UNLOCKED)
Excel graphs that update and re-scale upon Pivot Table slicer click(s)
