Originally published: 29/05/2020 08:10
Publication number: ELQ-32687-1
View all versions & Certificate
Publication number: ELQ-32687-1
View all versions & Certificate

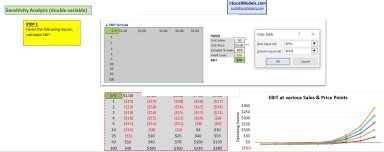
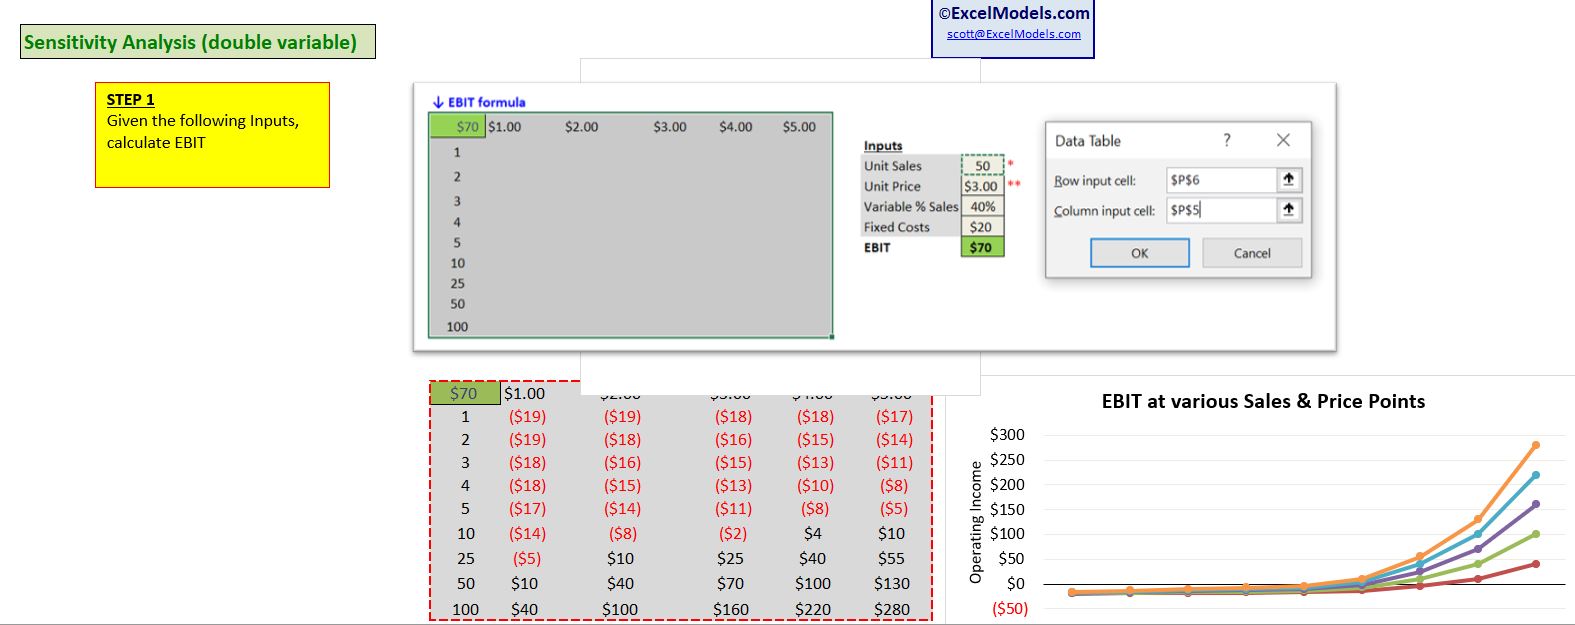
Sensitivity Analysis in Excel
A tutorial on using Excel's Data Tables to conduct Sensitivity Analysis on a P&L
