Originally published: 25/06/2020 06:41
Last version published: 25/03/2021 16:41
Publication number: ELQ-25560-7
View all versions & Certificate
Last version published: 25/03/2021 16:41
Publication number: ELQ-25560-7
View all versions & Certificate

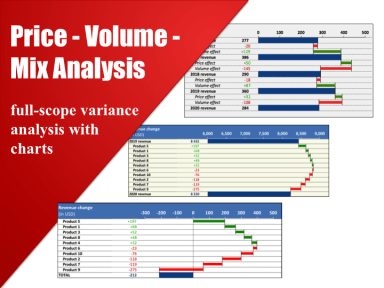
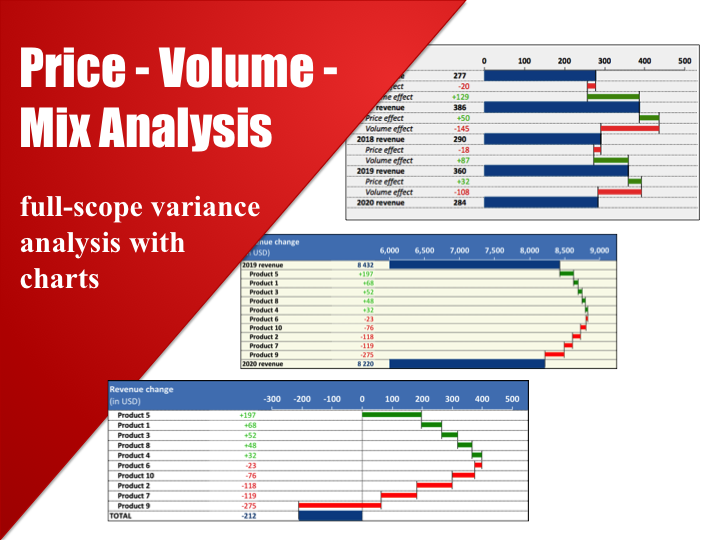
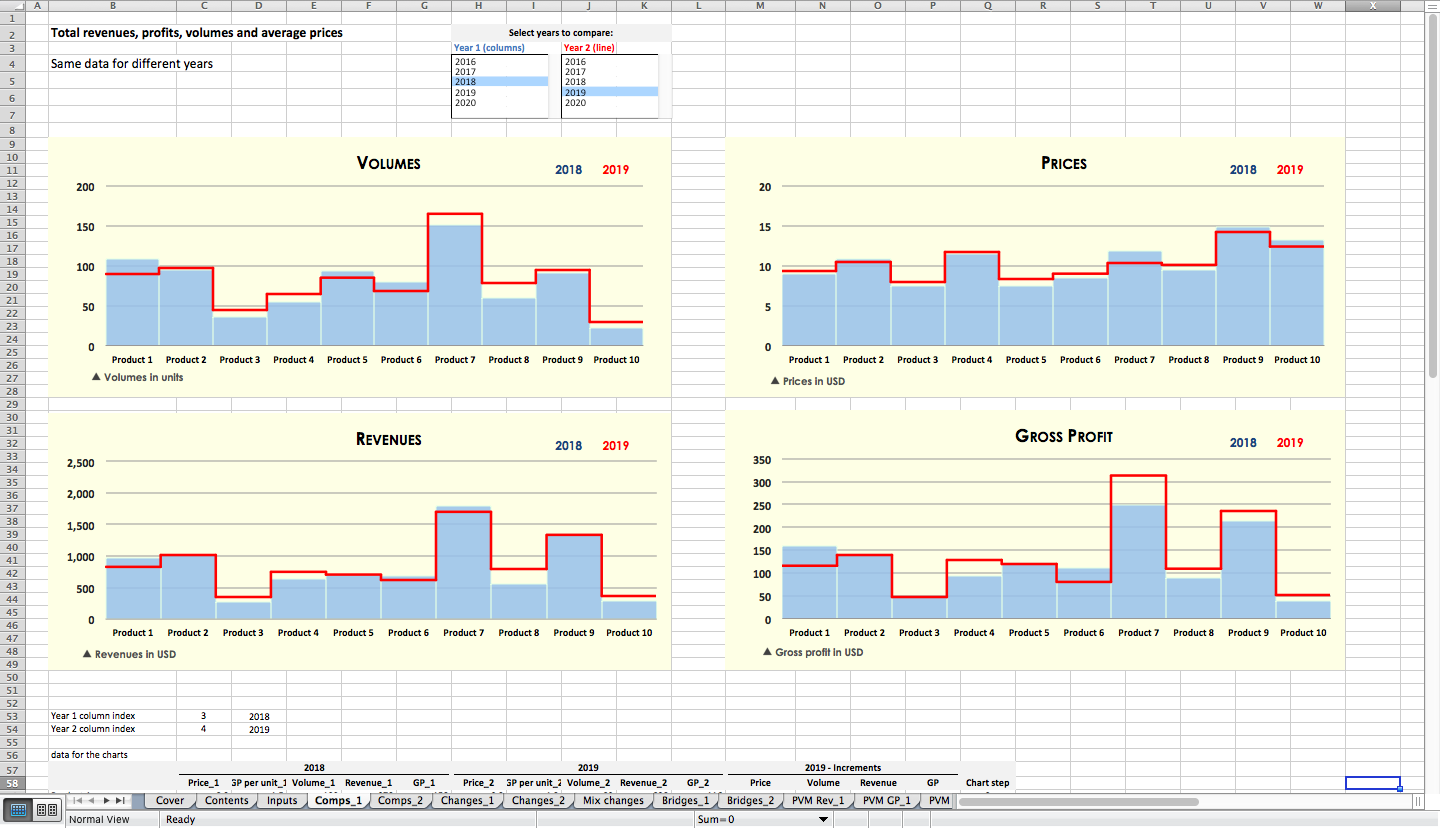
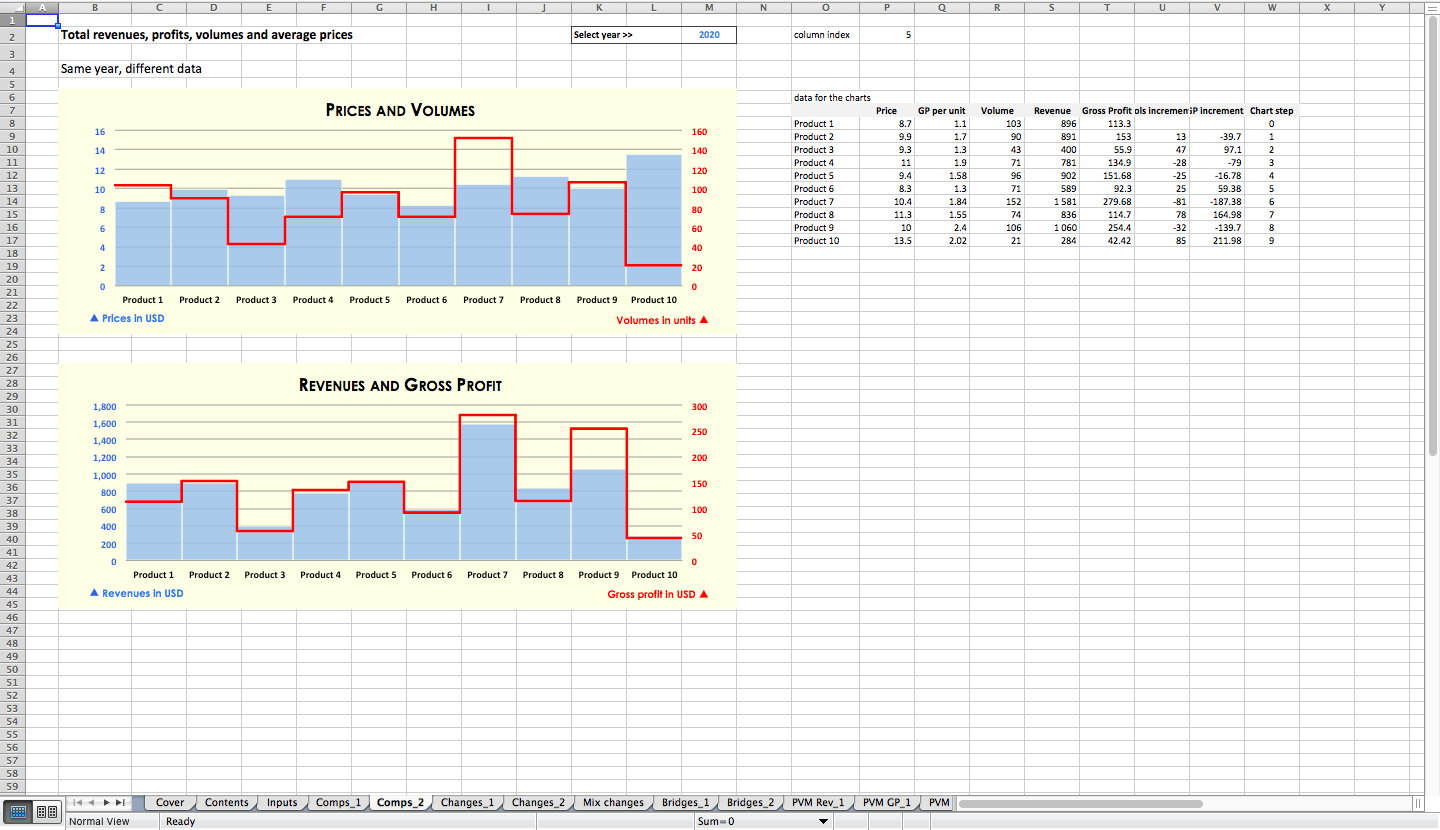
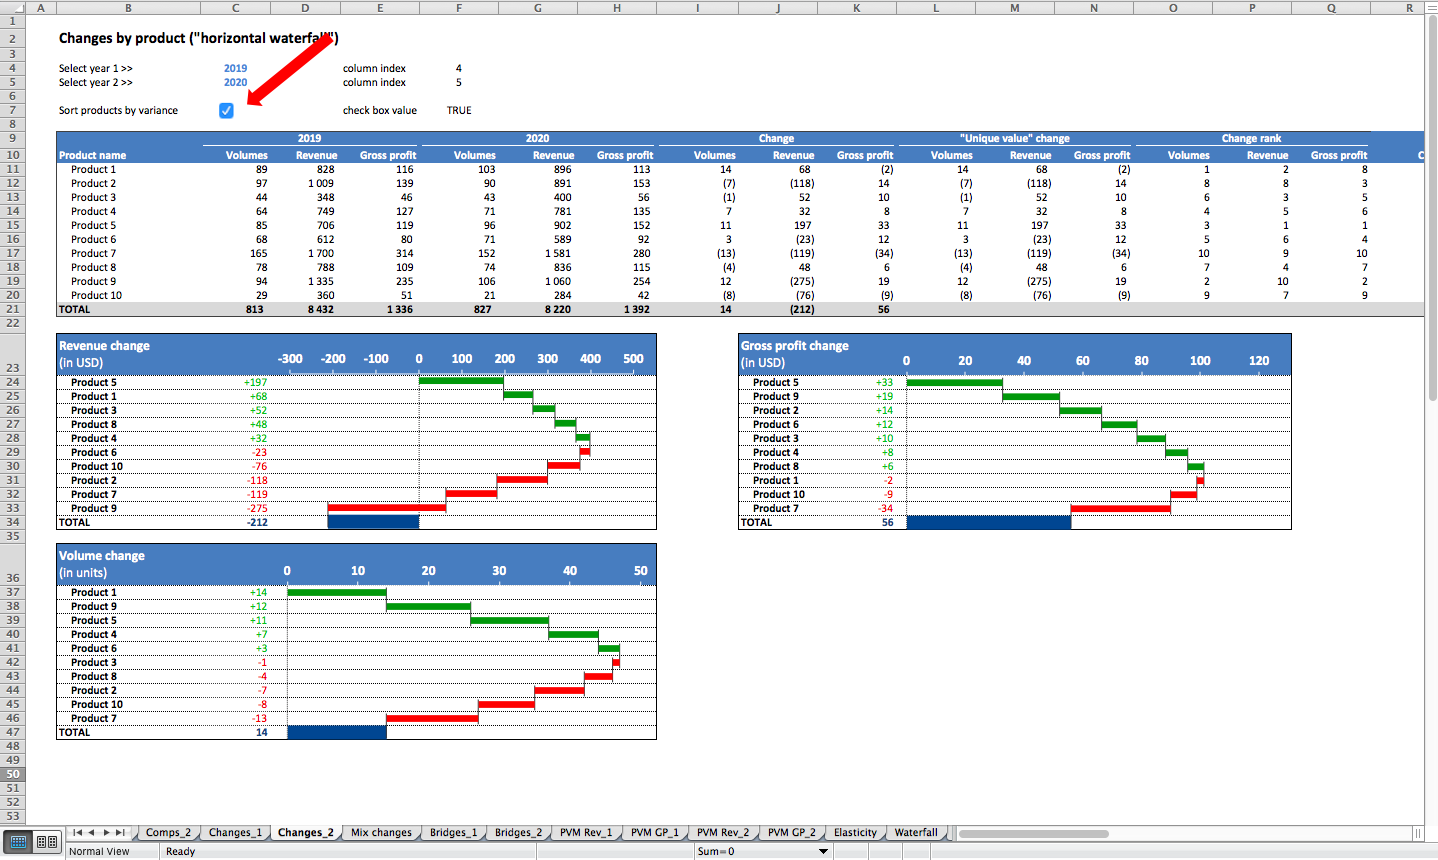
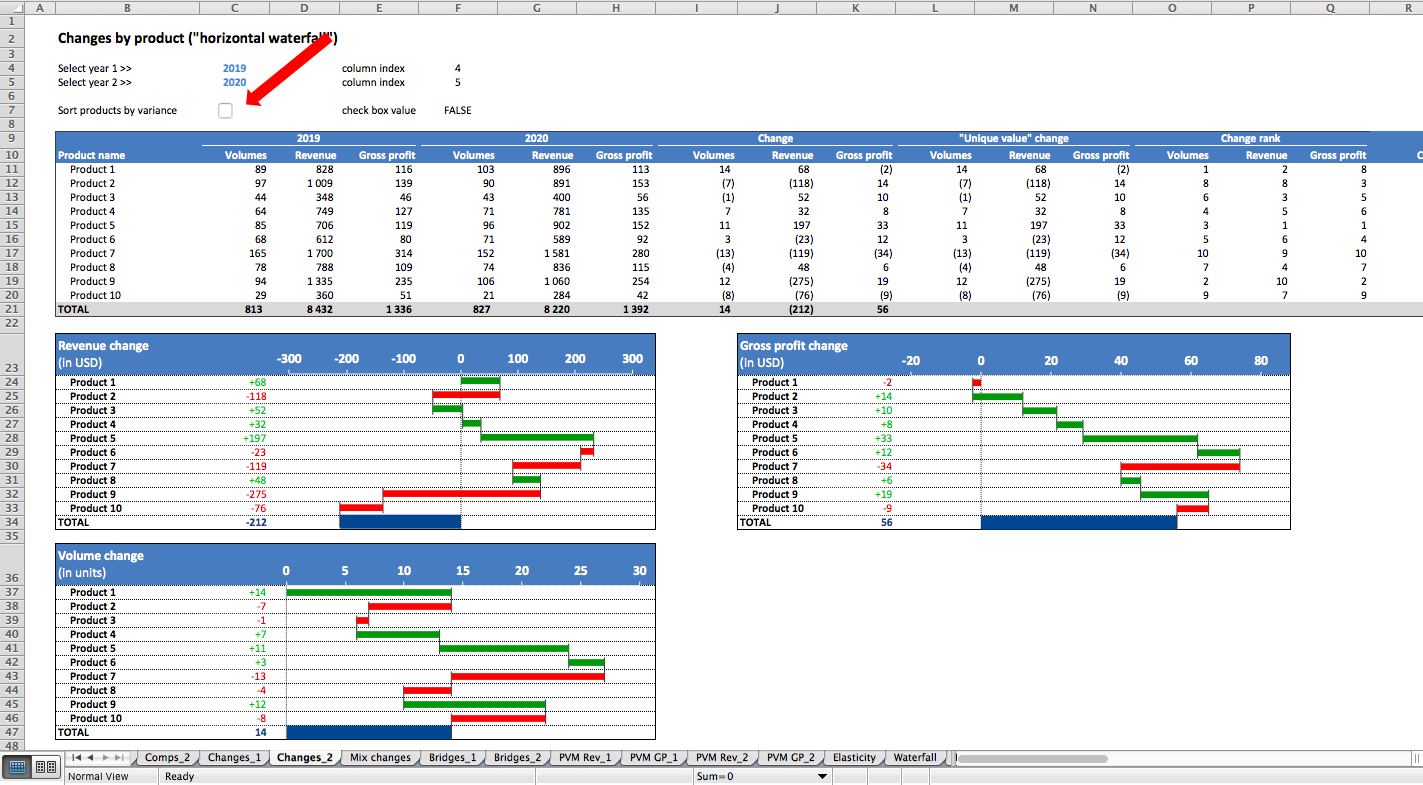
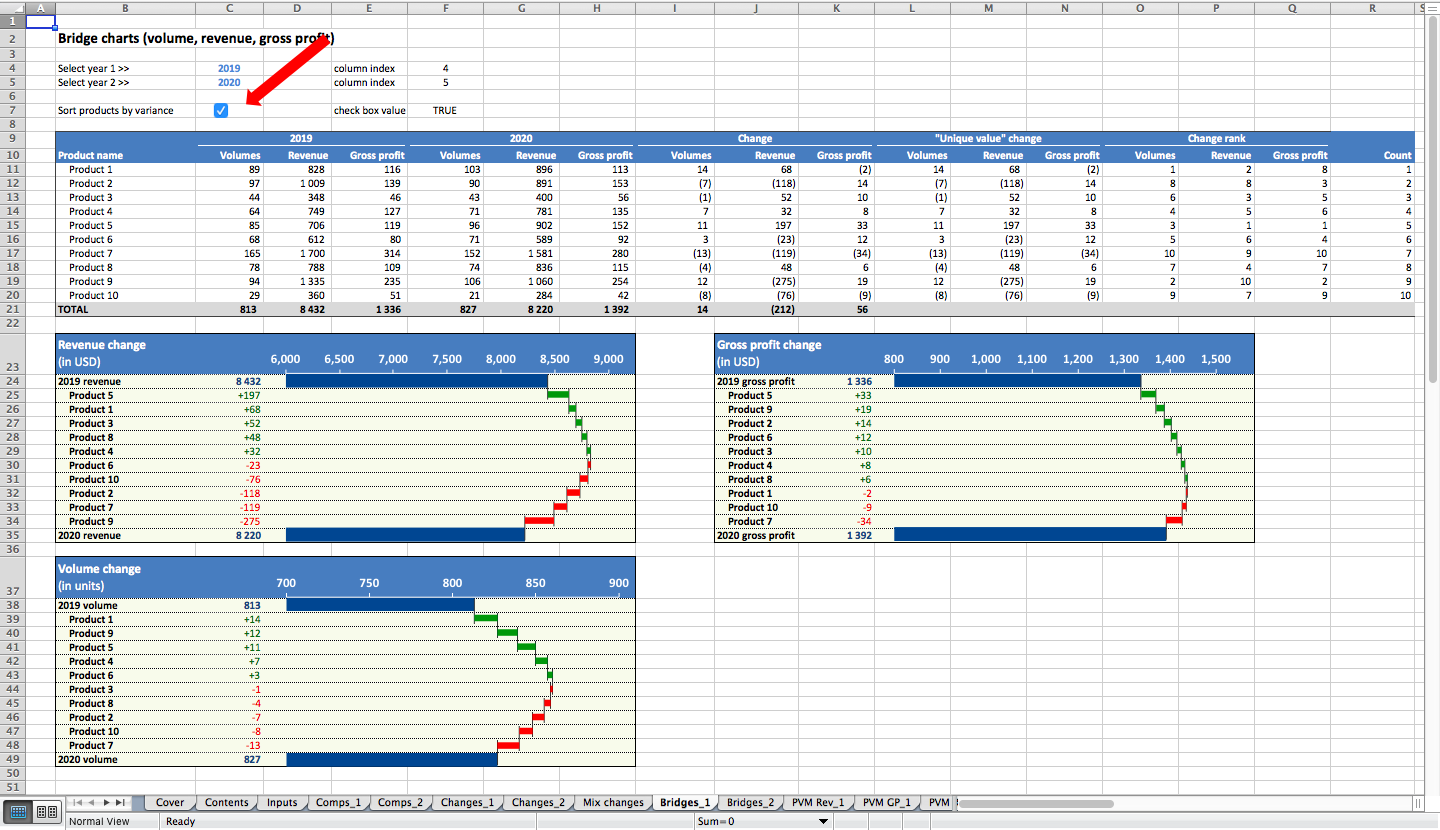
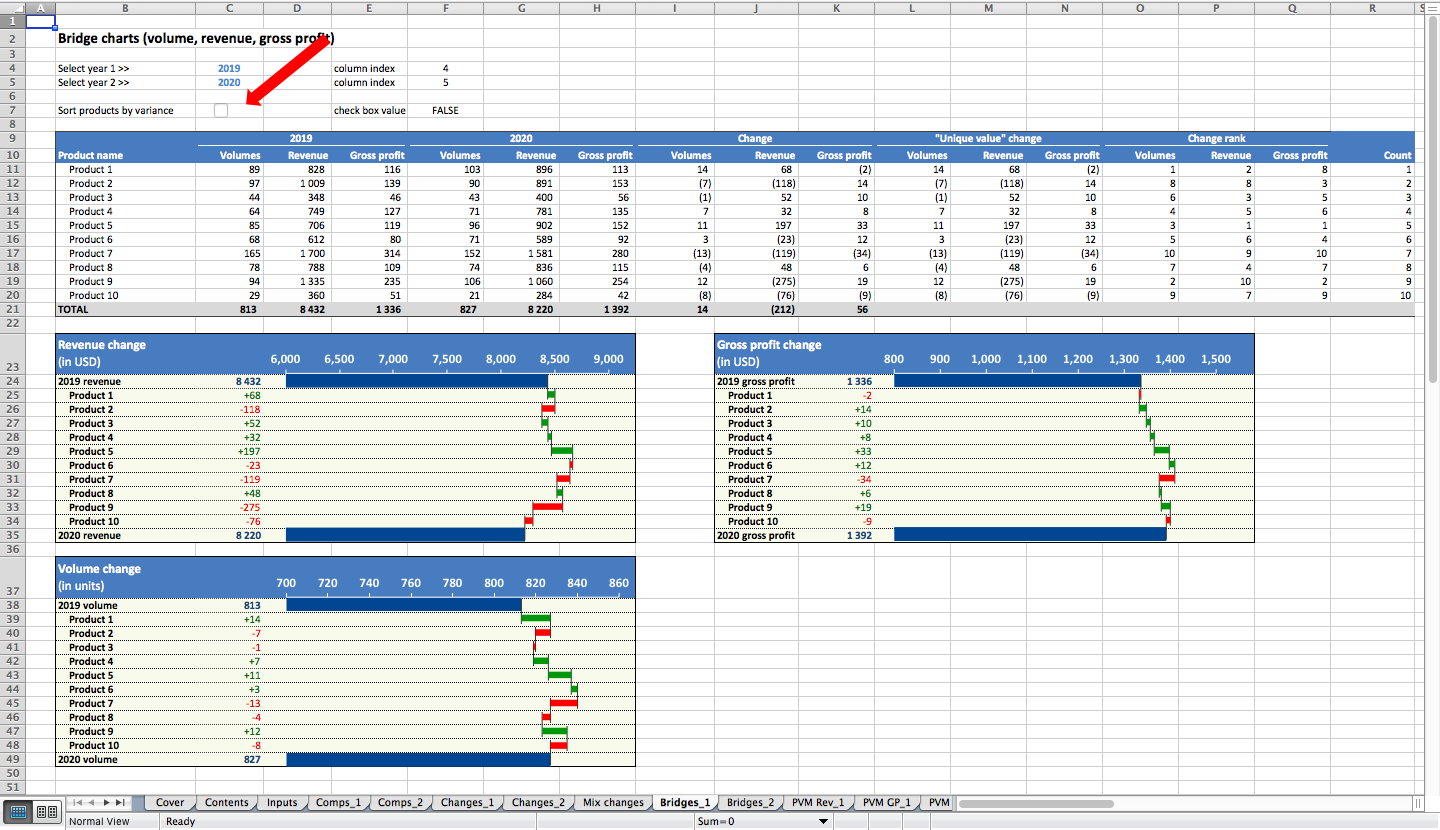
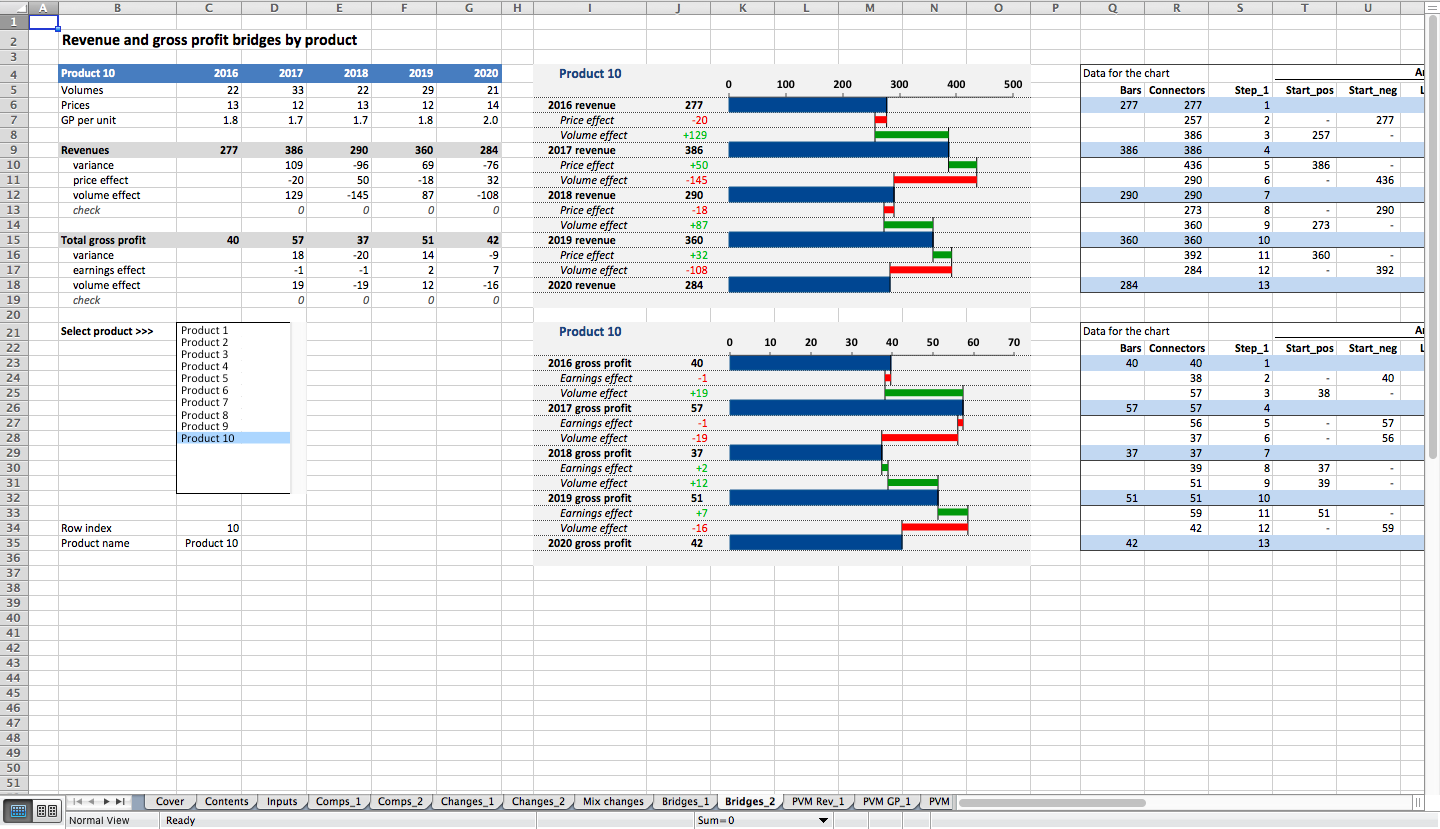
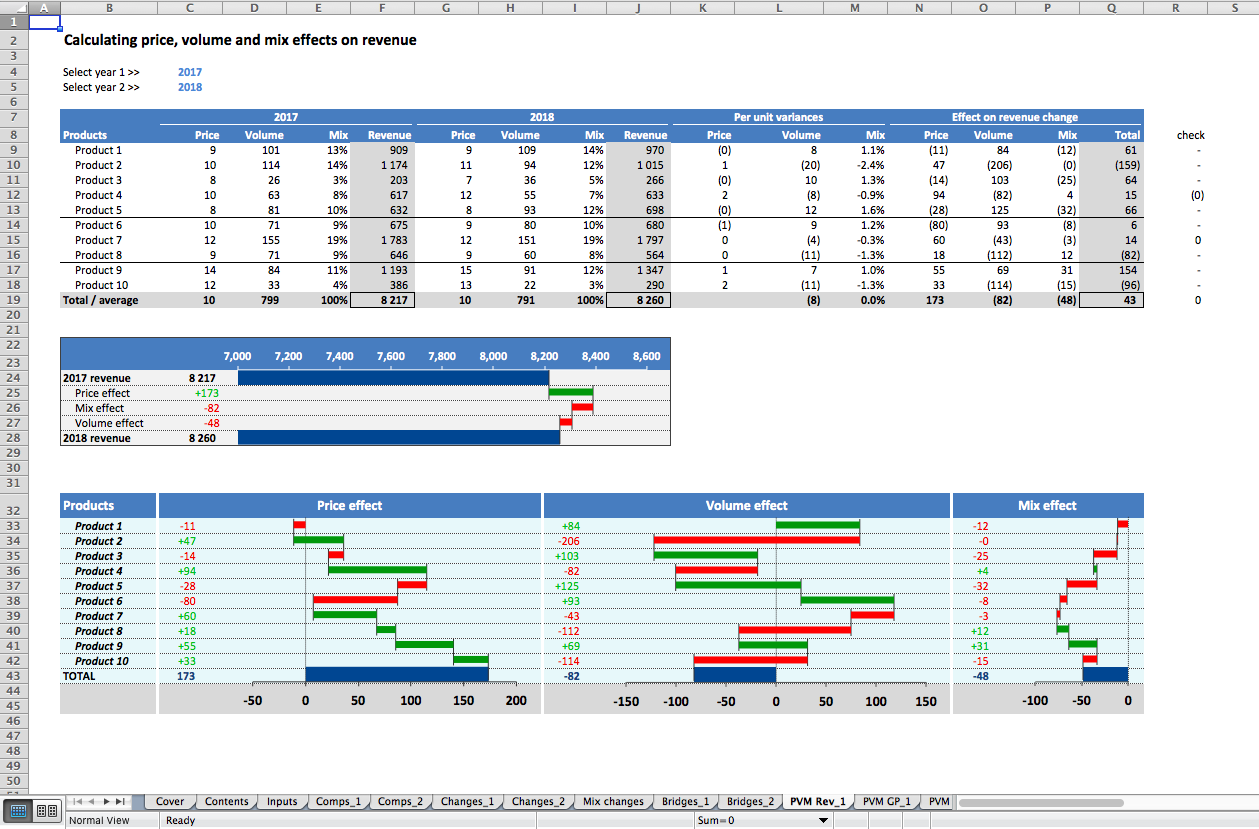
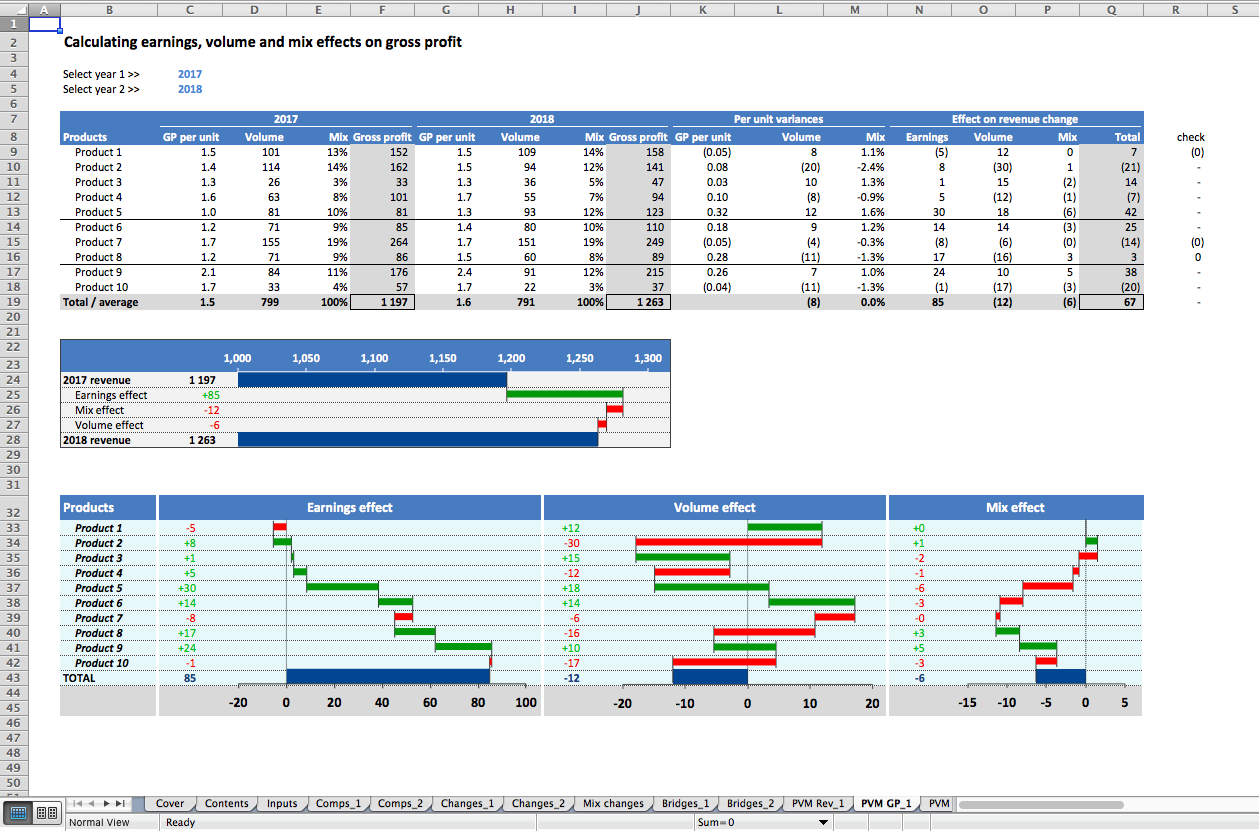
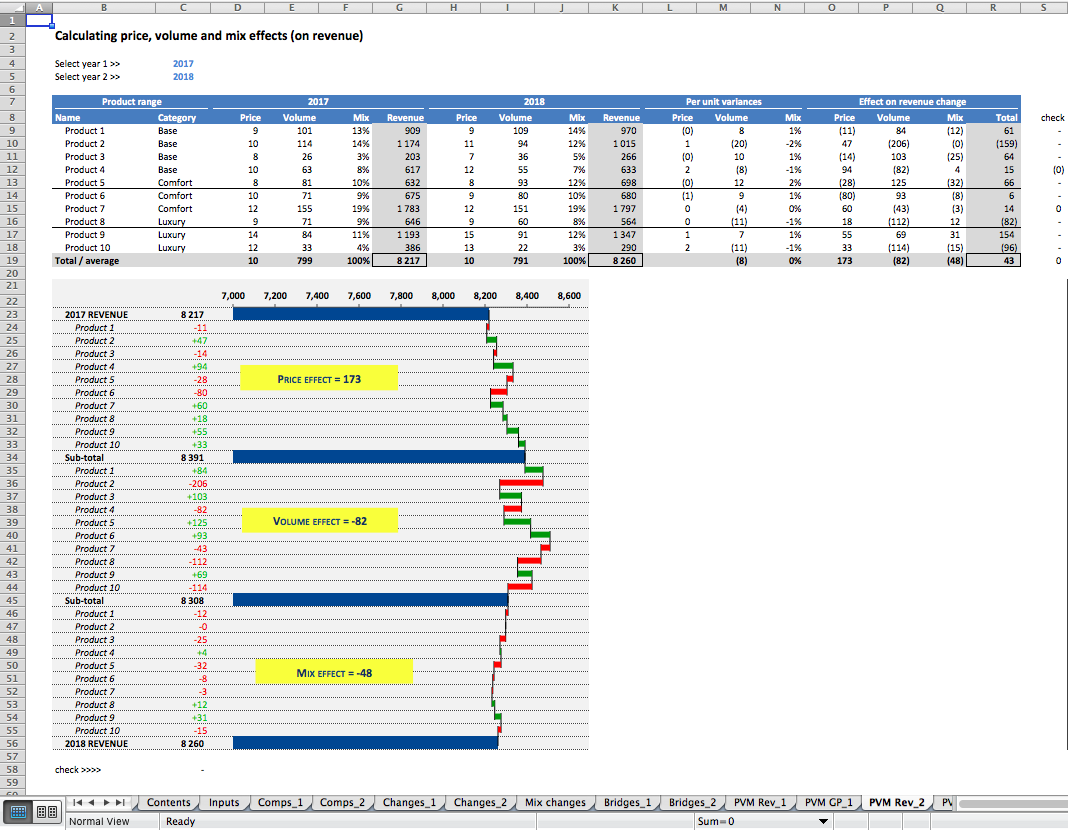
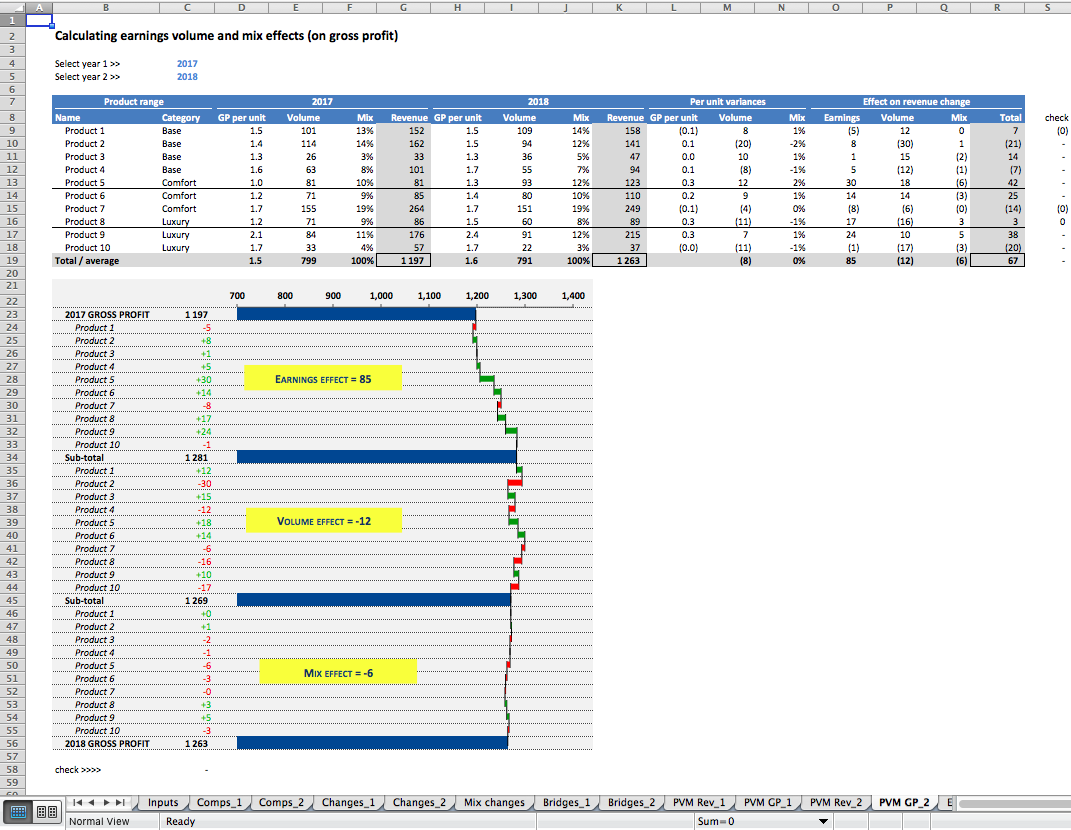
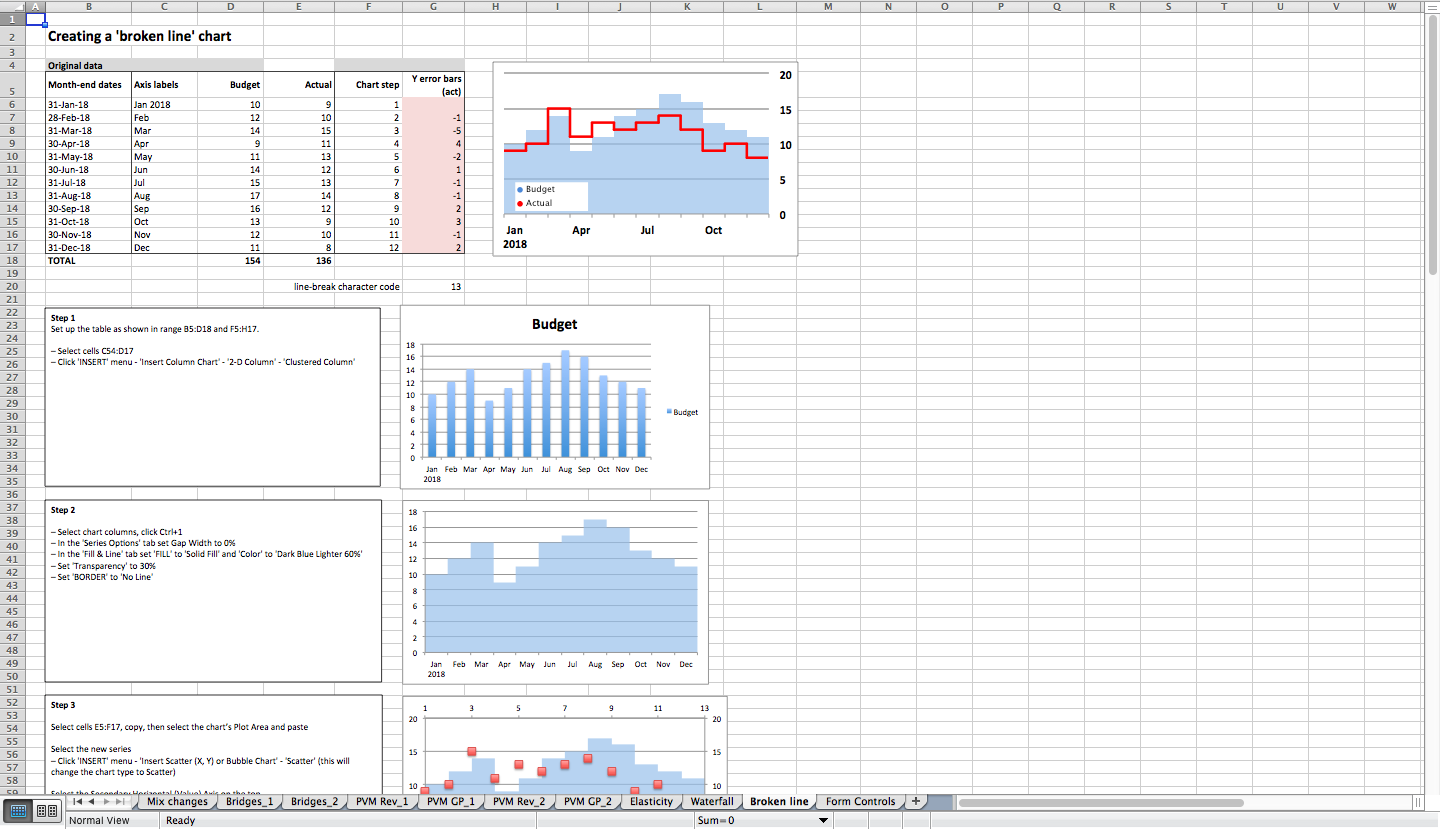
Price-Volume-Mix Analysis
A comprehensive full-scope model to analyse revenue and profit changes
Further information
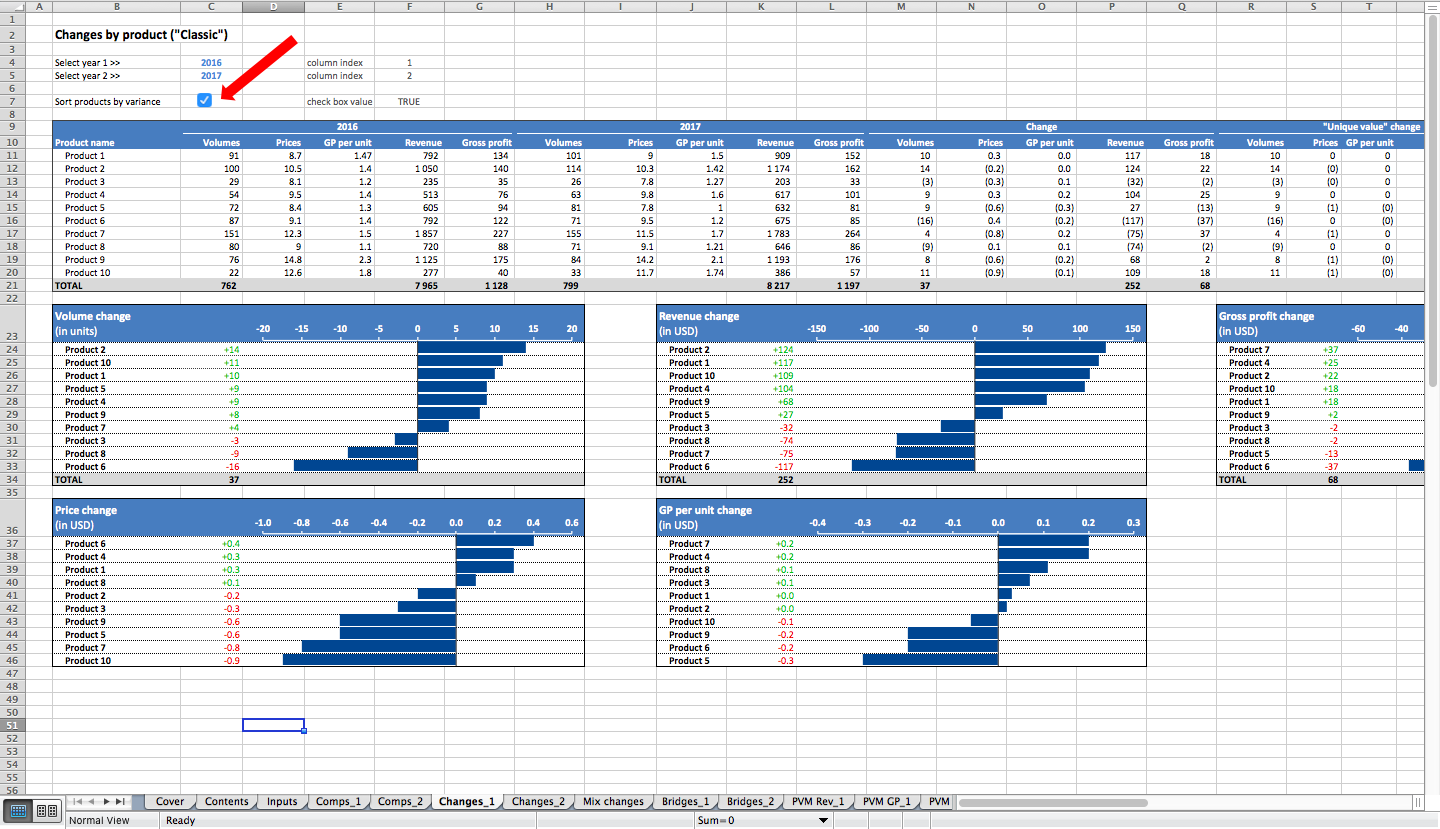
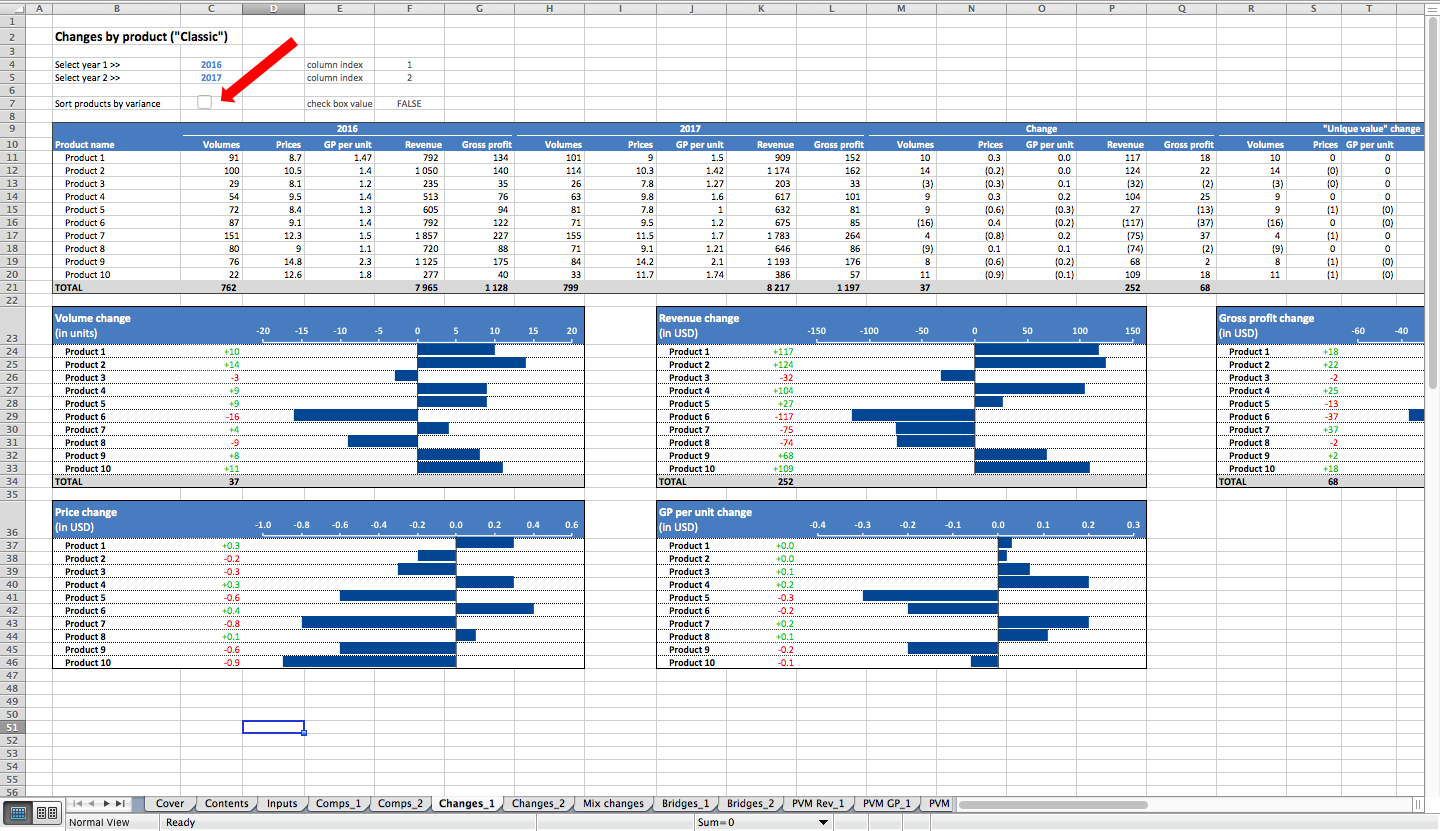
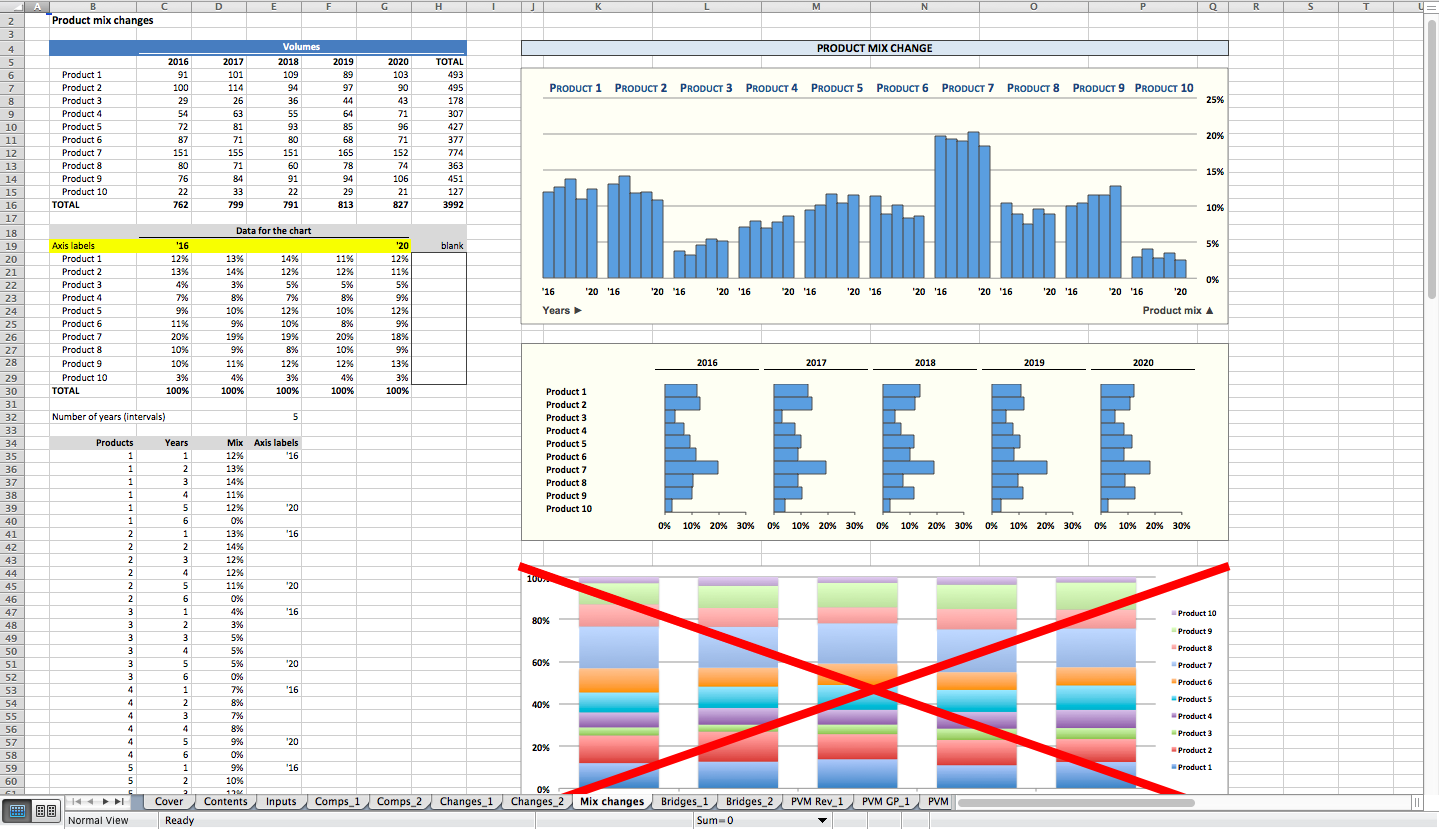
Calculate price, volume and mix effect; analyse total revenue and gross profit changes by product
Any business selling more than one product
n/a
