
Originally published: 04/05/2021 07:39
Publication number: ELQ-18993-1
View all versions & Certificate
Publication number: ELQ-18993-1
View all versions & Certificate

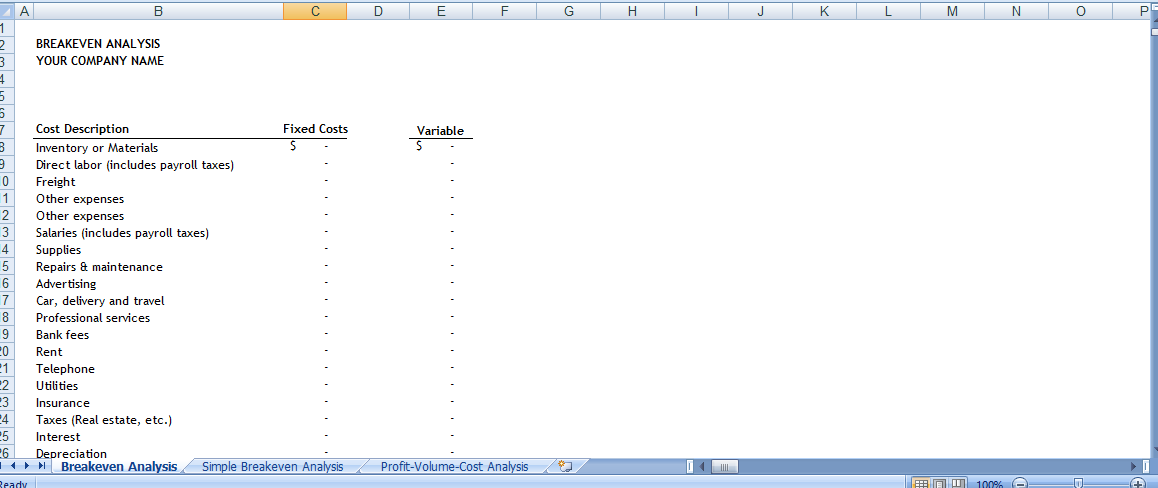
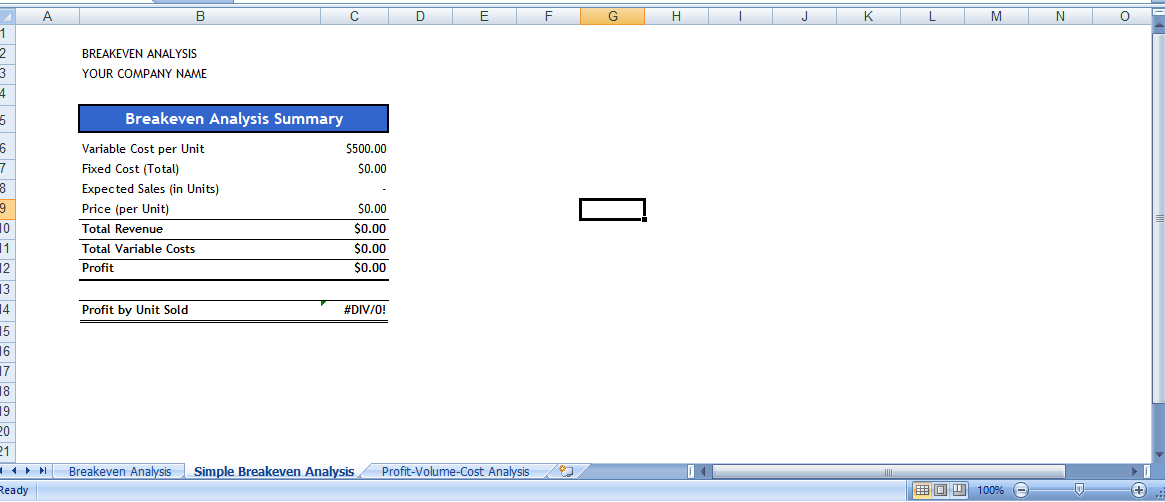
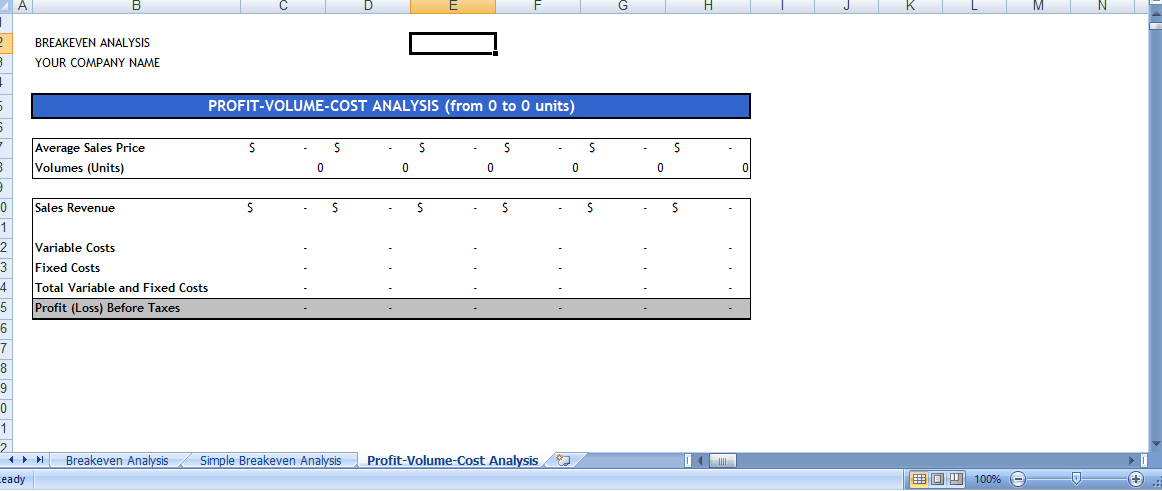
Break-even Analysis Templates
Break-even and Profit-Volume- Cost Analysis
Ityo Elvis Taveretem offers you this Best Practice for free!
download for free
Add to bookmarks
Further information
To analyze the break-even of a business
Provide a benchmark for long term business planning
