Cash Burn Rate calculators
Start the discussion!
What is 'Burn Rate'?
The term ‘burn rate’ is used in business to describe how quickly a new business is spending its venture capital in order to pay for overhead. The new business is spending its venture capital because it has not yet generated positive cash flow from its operations, therefore, cash burn rate is a measure of negative cash flow. It is quoted by ‘cash spent per month.’
E.g. If a company is spending $1 million/ month, the company’s burn rate is $1 million. The burn rate is used by investors and startups to track the amount of cash that the business is spending monthly. The burn rate of a company is also used to measure the company’s runway; the amount of time it will take the company to run out of money. E.g. If in the bank, a company currently has $1, and it goes through $100,000 per month, its burn rate is $100,000 and its runway is 10 months.
Net Burn vs. Gross Burn
There are two kinds of burn rates: gross burn and net burn. A business’ net burn is the sum of money that a business loses every month. A business’ gross burn is the sum of operating costs the business incurs through expenses every month.
For example, if a startup pays $5,000 on rent, $10,000 a month on server costs, and $15,000 a month on its engineers’ wages, the company’s gross burn rate is $30,000. However, the company’s net burn would be different if it were already producing revenue. If the business operates at a loss, with Costs of Goods Sold at $10,000 and revenues of $20,000, the business would still work to decrease its overall burn. In this case, the business’ net burn would be $20,000.
This is a very important distinction, because it affects the amount of money a company has in the bank and therefore its financial runway. Even if it's spending $30,000 gross, the actual amount its losing per month is $20,000. This means, for example, that if it had $100,000 in the bank, its runway would be five months rather than around three months. This dictates the way in which the managers outline the company's strategy and the amount that an investor would want to invest in the company.
This is an integral distinction, as it has an effect on the amount of money a company actually has in the bank, hence its financial runway. Even if the company is spending $30,000 gross, the actual amount that it is losing each month is $20,000. This signifies, for example, that if in the bank it had $100,000, the company’s runway would be five months rather than roughly three months. This controls the way in which the decision-makers outline the business’ strategy and the amount that an investor may potentially invest in the company.
However, at the point where revenue does not meet expectations or the burn rate starts to exceed burn forecasts, the usual option is to reduce the burn rate, regardless of the money you have in the bank. Normally, this means cutting down staff.
If you’d like to read more on Burn Rate, visit:
Most popular calculators
Three year financial model template for Excel + Google Sheets to plan expenses, build a cash budget and forecast runway.6,724Discussadd_shopping_cart$15.00
by Taylor Davidson

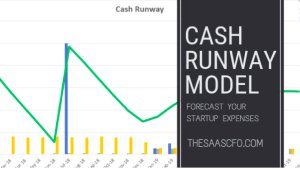
Cash Runway Model
This Cash Runway Model is an instantly downloadable, ready-to-use tool helping you to forecast your start-up expenses.1,956Discussadd_shopping_cartfree
by Ben Murray

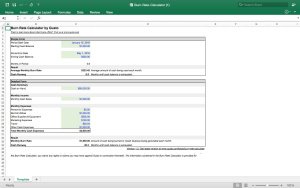
Burn Rate Calculator
Simple and easy to use tool for calculating the cash burn rate of your business4,229Discussadd_shopping_cartfree
by Gusto

Balance Sheet Analysis Tool
This tool will shine a bright light on where cash is being generated and consumed in your business.1,216Discussadd_shopping_cart$39.00
by CFO.University

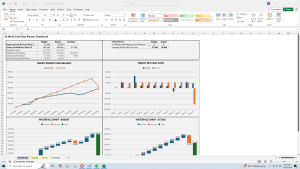
Cash Burn Rate Calculator
This calculator will work out your projected cash burn rate and your historial cash burn rate.769Discussadd_shopping_cart$35.00
by Stephanie Travis

13-Week Working Capital Planner
A simple template to track your expected working capital and compare that to actuals. Weekly periods with a total view of one quarter.341Discussadd_shopping_cart$40.00
by Jason Varner
Limited Time Promotions

13 Week Liquidity Commander - Google Sheet
Track your short-term cash flow across multiple scenarios to ensure you maintain the liquidity needed to survive.86Discussadd_shopping_cart$20.00$5.00
by Scott Ortiz

Action Plan Tracking Terminal | Executive KPI Dashboard
A centralized Google Sheets tracking terminal to log team action items, monitor deadlines, and calculate schedule variance in real-time.138Discussadd_shopping_cart$20.00$5.00
by Scott Ortiz

ATS & Hiring Pipeline Commander — Weighted Interview Scorecard & Recruitment Dashboard
Replace bloated SaaS hiring tools with an automated applicant tracking system, weighted interview scorecards, and stale candidate alarms in Google Sheets.121Discussadd_shopping_cart$20.00$5.00
by Scott Ortiz

Manufacturing BOM & Yield Costing Factory — True COGS Calculator
Calculate true landed COGS, automatically factor in raw material scrap rates, and identify margin compression for physical products natively in Google Sheets.119Discussadd_shopping_cart$20.00$5.00
by Scott Ortiz

M&A Due Diligence & VDR Command Center - Google Sheet
A centralized Google Sheets tracking terminal to manage M&A diligence, monitor VDR fulfillment, and instantly surface financial deal breakers.118Discussadd_shopping_cart$20.00$5.00
by Scott Ortiz

OpEx Budget vs. Actuals Variance Commander — Cash Runway Sheet
Track departmental budgets against actual spending to identify exact operational variances and project your remaining cash runway.90Discussadd_shopping_cart$20.00$5.00
by Scott Ortiz

SaaS Pricing Tier & Packaging Simulator — ARR Expansion Matrix
Model pricing changes, analyze feature packaging, and prevent churn with an automated SaaS tier migration matrix natively built for Google Sheets.101Discussadd_shopping_cart$20.00$5.00
by Scott Ortiz

Enterprise Quota Capacity & Sales Ramp Architect | Sales Headcount Model
A deterministic sales ramp model for Google Sheets. Track quota capacity, ramp profiles, and fractional churn.124Discussadd_shopping_cart$20.00$5.00
by Scott Ortiz

Customer Success Health Scorecard & Churn Sentinel — SaaS Retention Sheet
Identify churn risk, track ARR at risk, and drive expansion with weighted health scoring and automated intervention alerts in Google Sheets.112Discussadd_shopping_cart$20.00$5.00
by Scott Ortiz

CapEx Depreciation & Fixed Asset Registry — Automated SLN, DDB & NBV Schedule
Centralize your fixed asset registry and calculate corporate depreciation schedules using a locked Google Sheets ledger.83Discussadd_shopping_cart$20.00$5.00
by Scott Ortiz