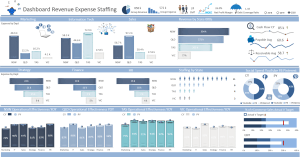
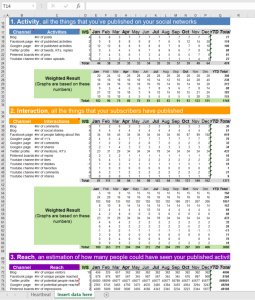
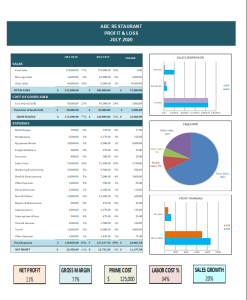
KPI Dashboard Templates Start the discussion!

What is a KPI dashboard?
A Key Performance Indicator dashboard collects, groups, organizes and visualizes an organization’s important metrics. In this way, KPI reporting serves multiple purposes within a firm.
But what are KPIs exactly?
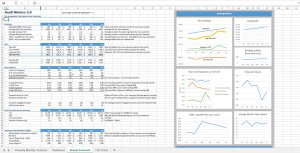
KPIs or Key Performance Indicators are ways to periodically assess the performance of an organization, business unit, a division or employees. They commonly serve the purpose of being understandable, meaningful, and measurable.
Hence, KPI reporting is ultimately used by different parties to evaluate the effectiveness of a firm at reaching its targets.
But why is a Startup KPI Dashboard useful?
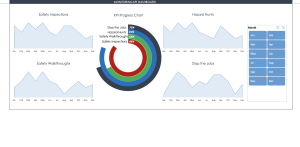
• A KPI dashboard provides a general overview of business performance and expected growth.
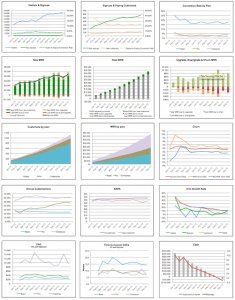
• KPI reporting enables organizations to access indicators, which support them in making informed decisions.
• A KPI provides real time information about the performance of a business. This enables them to know how effectively it is achieving business objectives at a given time period.
• KPI dashboards identify problem areas and help teams tackle specific problems. This is given that they are linked to target values, meaning that performance can be assessed.
How are Key Performance Indicators chosen for a given dashboard?
Using the SMART approach. This means that the KPI must:
- Be Specific: serve a specific purpose for the firm.
- Be Measurable: needs to give a value.
- Be Achievable: the defined norms for the KPI need to achievable.
- Be Relevant: needs to be relevant to the long-term goals of the firm.
- Be Time-Bound: the output should be based on a pre-defined and relevant period.
What are the different types of a KPI Dashboard?
Firstly, it is crucial to differentiate the types of KPIs. There exists high-level KPIs, which focus on the overall performance of the business, while low-level KPIs, focus on department process.
Also, not all key performance indicators are financial. They can also be non-financial meaning that they focus rather on customers and employees; for example, employee turnover.
For this reason, there exists different types of KPI dashboards that depend on the aims of the party utilizing it. A few examples are the following:
- • CEO/Executive KPI dashboard: an aggregated overview of a company’s performance and profitability. This would include sensitive KPIs, that would only be accessible to high-level executives.
- • Project management KPI Dashboard: reflects the performance of employees in a project as well as the performance of the project itself. It is aimed at keeping everyone aware of the achievements and the goals yet to be achieved.
- • Marketing KPI dashboard: reflects the digital marketing metrics of the organization, and provides an overview of the marketing team’s performance
- • Sales KPI dashboard: reflects the performance of the sales department. This helps sales managers visualize how each salesperson performs, how much income can be expected from new deals as well as depicting when marketing campaigns need to be addressed.
You don’t necessarily need to build your own dashboard from step 0. The Eloquens catalogue provides you with both KPI dashboard templates and KPI guides for creating your dashboard, which you can customize to your firm.
Also, if you’d like more information on KPI dashboards and KPI reporting, have a look at the links below:
->What is a Key Performance Indicator? by AP Institute
->What is a KPI? by Investopedia
Most popular Templates
- This KPI dashboard is an effective tool that can be used to measure the performance of your business' management.15,2442add_shopping_cart$40.00
by Someka
Dashboard Design in Excel - The Complete Course
The complete, comprehensive course for dashboard design in Excel.10,3345add_shopping_cart$299.00by Marcus Small
The Ultimate Business KPI Dashboard Bundle
This exemplary financial dashboard bundle includes 9 top-tier business dashboards, ready-to-use, for your organisation.4,377Discussadd_shopping_cart$300.00by Marcus Small
Key Financial Metrics Report Excel Model
The workbook compares a range of metrics by region. It is simple to update and presents data clear concise way.10,0991add_shopping_cart$99.00by Marcus Small
Project Management KPI Dashboard Excel Template
This Project Management KPI Dashboard is great for analysing the performances of projects.3,391Discussadd_shopping_cart$40.00by Someka
Sales KPI Dashboard Report
This report summaries a range of financial and non financial data in a succinct 1 page summary which is highly pliable.6,8311add_shopping_cart$99.00by Marcus Small
KPI Excel Dashboard Model
This financial KPI dashboard displays a range of organisational metrics (actual v plan) in a clear succinct summary.5,654Discussadd_shopping_cart$99.00by Marcus Small
Balanced Scorecard Dashboard Excel Model
This is a balanced scorecard summary report, presented in a succinct clear format which is ready to use.4,991Discussadd_shopping_cart$149.00by Marcus Small
HSE Performance Monitoring Tool - Officer Version
This tool is designed to generate HSE performance reports based on daily data entries.7101add_shopping_cart$29.97by SHEQXEL
Digital Marketing KPI Dashboard Excel Template
This Digital Marketing KPI Dashboard is a great tool for producing digestible reports on marketing campaigns.2,152Discussadd_shopping_cart$40.00by Someka
Advanced Dashboard Design Course
The complete advanced Dashboard Design Course for Excel. Learn how to create 5 types of corporate dashboards.1,2671add_shopping_cart$349.00by Marcus Small
HSE Performance Monitoring Tool – Manager Version
This tool is designed to generate HSE performance reports based on monthly data entries.1,0711add_shopping_cart$29.97by SHEQXEL
Risk Management Dashboard
Risk Management Dashboard - Planner and Task Manager3322add_shopping_cart$19.95by Steve Lindsey
Social Media Dashboard
Social Media Dashboard: Knowing Who You Are Engaged With188Discussadd_shopping_cart$16.95by Steve Lindsey
Data Trends by Month Dashboard Excel
This dashboard shows a range of operational, financial and HR information with comparison, trend and variance to plan.4,3963add_shopping_cart$99.00by Marcus Small
Retail KPI Dashboard Excel Template
This is a Key Performance Indicator for your retail business.1,053Discussadd_shopping_cart$40.00by Someka
priced Templates
General Management KPI Dashboard Excel Template
This KPI dashboard is an effective tool that can be used to measure the performance of your business' management.15,2442add_shopping_cart$40.00by Someka
Dashboard Design in Excel - The Complete Course
The complete, comprehensive course for dashboard design in Excel.10,3345add_shopping_cart$299.00by Marcus Small
Key Financial Metrics Report Excel Model
The workbook compares a range of metrics by region. It is simple to update and presents data clear concise way.10,0991add_shopping_cart$99.00by Marcus Small
KPI Excel Dashboard Model
This financial KPI dashboard displays a range of organisational metrics (actual v plan) in a clear succinct summary.5,654Discussadd_shopping_cart$99.00by Marcus Small
Balanced Scorecard Dashboard Excel Model
This is a balanced scorecard summary report, presented in a succinct clear format which is ready to use.4,989Discussadd_shopping_cart$149.00by Marcus Small
Social Media Dashboard
Social Media Dashboard: Knowing Who You Are Engaged With188Discussadd_shopping_cart$16.95by Steve Lindsey
Company KPI Dashboard Model - by Department
This KPI dashboard summarises financial data by department and allows drill through on multiple levels.3,765Discussadd_shopping_cart$99.00by Marcus Small
Sales KPI Dashboard Report
This report summaries a range of financial and non financial data in a succinct 1 page summary which is highly pliable.6,8311add_shopping_cart$99.00by Marcus Small
HSE Performance Monitoring Tool - Officer Version
This tool is designed to generate HSE performance reports based on daily data entries.7101add_shopping_cart$29.97by SHEQXEL
Digital Marketing KPI Dashboard Excel Template
This Digital Marketing KPI Dashboard is a great tool for producing digestible reports on marketing campaigns.2,152Discussadd_shopping_cart$40.00by Someka
Advanced Dashboard Design Course
The complete advanced Dashboard Design Course for Excel. Learn how to create 5 types of corporate dashboards.1,2671add_shopping_cart$349.00by Marcus Small
Data Trends by Month Dashboard Excel
This dashboard shows a range of operational, financial and HR information with comparison, trend and variance to plan.4,3963add_shopping_cart$99.00by Marcus Small
Retail KPI Dashboard Excel Template
This is a Key Performance Indicator for your retail business.1,053Discussadd_shopping_cart$40.00by Someka
Human Resources Dashboard
Human Resources Dashboard472Discussadd_shopping_cart$39.00by Steve Lindsey
Client Corporate Excel Dashboard
A neat corporate summary report which can be easily adapted to incorporate financial and non financial data.3,945Discussadd_shopping_cart$99.00by Marcus Small
Human Resources and Finance Excel Dashboard
This is a high-quality KPI dashboard to monitor the performance of your Human Resource and Finance department.4,4172add_shopping_cart$149.00by Marcus Small
Newly published
Sales Performance Dashboard in Microsoft POWER BI
Sales Performance Dashboard in Microsoft POWER BI84Discussadd_shopping_cartHuman Resource Headcount Analytics Dashboard in Microsoft POWER BI
Human Resource Headcount Analytics Dashboard in Microsoft POWER BI30Discussadd_shopping_cartFinancial Dashboard Excel Template
Our robust template features a total of 18 indicators27Discussadd_shopping_cart$49.00by Adnia Solutions
Sales Team Actuals vs Objectives Dashboard PowerPoint Template
PowerPoint Slides for a Sales Director/Manager to track current performance vs objectives on multiple levels.47Discussadd_shopping_cart$7.00by Tim Demoures
Key Financial Metrics Report Excel Model
The workbook compares a range of metrics by region. It is simple to update and presents data clear concise way.10,0991add_shopping_cart$99.00by Marcus Small
KPI Excel Dashboard Model
This financial KPI dashboard displays a range of organisational metrics (actual v plan) in a clear succinct summary.5,654Discussadd_shopping_cart$99.00by Marcus Small
Company KPI Dashboard Model - by Department
This KPI dashboard summarises financial data by department and allows drill through on multiple levels.3,765Discussadd_shopping_cart$99.00by Marcus Small
Balanced Scorecard Dashboard Excel Model
This is a balanced scorecard summary report, presented in a succinct clear format which is ready to use.4,991Discussadd_shopping_cart$149.00by Marcus Small
Sales KPI Dashboard Report
This report summaries a range of financial and non financial data in a succinct 1 page summary which is highly pliable.6,8311add_shopping_cart$99.00by Marcus Small
Premium Dashboard Models (the very best)
These premium Excel dashboards are ready to use. Create stunning visuals by adding your own data. That simple.10,1971add_shopping_cart$399.00by Marcus Small
Human Resources and Finance Excel Dashboard
This is a high-quality KPI dashboard to monitor the performance of your Human Resource and Finance department.4,4172add_shopping_cart$149.00by Marcus Small
HSE Performance Monitoring Tool - Officer Version
This tool is designed to generate HSE performance reports based on daily data entries.7101add_shopping_cart$29.97by SHEQXEL
HSE Performance Monitoring Tool – Manager Version
This tool is designed to generate HSE performance reports based on monthly data entries.1,0711add_shopping_cart$29.97by SHEQXEL
Sales Analytics Dashboard in Microsoft Excel
Sales Analytics Dashboard in Microsoft Excel569Discussadd_shopping_cartDashboard Actuals P&L Model
Dashboard Actuals P&L Model generates a dynamic dashboard which can be filtered both by country and by month.196Discussadd_shopping_cart$99.00by Big4WallStreet
Company Dashboard by Department
An Excel dashboard that displays data by department and region.176Discussadd_shopping_cart$199.00by Marcus Small
Full catalog
General Management KPI Dashboard Excel Template
This KPI dashboard is an effective tool that can be used to measure the performance of your business' management.15,2452add_shopping_cart$40.00by Someka
Dashboard Design in Excel - The Complete Course
The complete, comprehensive course for dashboard design in Excel.10,3345add_shopping_cart$299.00by Marcus Small
How to Create a Dashboard in Excel
This step-by-step method teaches the valuable skill of dashboard creation, provided by CFI.1,225Discussadd_shopping_cartfreeby CFI
Key Financial Metrics Report Excel Model
The workbook compares a range of metrics by region. It is simple to update and presents data clear concise way.10,0991add_shopping_cart$99.00by Marcus Small
KPI Excel Dashboard Model
This financial KPI dashboard displays a range of organisational metrics (actual v plan) in a clear succinct summary.5,654Discussadd_shopping_cart$99.00by Marcus Small
Balanced Scorecard Dashboard Excel Model
This is a balanced scorecard summary report, presented in a succinct clear format which is ready to use.4,991Discussadd_shopping_cart$149.00by Marcus Small
Social Media Dashboard
Social Media Dashboard: Knowing Who You Are Engaged With188Discussadd_shopping_cart$16.95by Steve Lindsey
Company KPI Dashboard Model - by Department
This KPI dashboard summarises financial data by department and allows drill through on multiple levels.3,765Discussadd_shopping_cart$99.00by Marcus Small
How to Avoid making 3 Critical Mistakes when Calculating LTV
The top 3 reasons why the LTV calculation is inaccurate and how to address them275Discussadd_shopping_cartfreeby Jeff Bussgang
A Beginner's Guide to KPIs
A guide to today's most prominent and commonly used KPIs for businesses.1,265Discussadd_shopping_cartfreeby KlipFolio
Sales KPI Dashboard Report
This report summaries a range of financial and non financial data in a succinct 1 page summary which is highly pliable.6,8311add_shopping_cart$99.00by Marcus Small
HSE Performance Monitoring Tool - Officer Version
This tool is designed to generate HSE performance reports based on daily data entries.7101add_shopping_cart$29.97by SHEQXEL
Digital Marketing KPI Dashboard Excel Template
This Digital Marketing KPI Dashboard is a great tool for producing digestible reports on marketing campaigns.2,152Discussadd_shopping_cart$40.00by Someka
Advanced Dashboard Design Course
The complete advanced Dashboard Design Course for Excel. Learn how to create 5 types of corporate dashboards.1,2671add_shopping_cart$349.00by Marcus Small
Data Trends by Month Dashboard Excel
This dashboard shows a range of operational, financial and HR information with comparison, trend and variance to plan.4,3963add_shopping_cart$99.00by Marcus Small
Retail KPI Dashboard Excel Template
This is a Key Performance Indicator for your retail business.1,053Discussadd_shopping_cart$40.00by Someka
- Have an Excel KPI Dashboard to share?
Your Startup KPI Dashboard Template
Publish your dashboard
Learn more about digital publishing
Related categories
Software-as-a-Service (SaaS)
Human Resources
Sales -
Lifetime Value (LTV)
Startup Financial Models
Corporate Finance
Income Statement
Health & Safety
eLearning
Cohort Analysis
Social Media -
Healthcare Financials
Cash Flow
Recruiting
Venture Capital
E-Commerce Financial Models
Lean Startup
Variance Analysis
Monte Carlo Simulation
Excel Add-Ins
Digital Marketing
Leadership
Real Estate Finance
Raising Capital