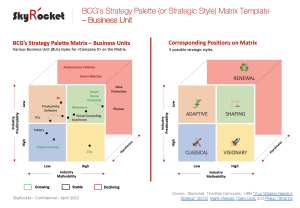
2x2 Four Quadrant Matrix Templates Start the discussion!

Total results: 41 has-more!
2x2 Four Quadrant Matrix

What is a 2x2 Four Quadrant Matrix?

Sometimes known as a model or method, a 2x2 matrix is a clear and organized system to present information in rows and columns. It sifts through qualitative or conceptual data and displays it on a four-quadrant display. The simple box lay-out provides a clear-cut way to analyse and make sense of data that is difficult to analyse. This is because the kind of visualization that the chart matrix provides appeals to the brain’s bend towards shortcuts by providing a clear and sophisticated way to portray the multifaceted relationships between various ideas. As such, the brain can retain the information more easily.

One of the most famous 2x2 matrices is the Boston Consulting Group’s ‘Growth Share Matrix’ created in 1968. It was used by half of all Fortune 500 Companies at one point to determine which investments would be most beneficial. Additionally, in 2011, the Harvard Business Review rated it at the very top of its collection of ‘Charts that Changed the World’.

What are 2x2 Four Quadrant Matrices used for?

A 2x2 Four Quadrant Matrix is a decision-making tool or social commentary that can be used to dissect everything from the priority of tasks (for example urgent vs. important tasks) to the promise of business ventures (for example growth vs. market share) to the importance of various pandemic grocery essentials.

Popular categories also include: Cost and Value, Importance and Urgency (also known as the Eisenhower Box), Time and Money, Effort and Impact, and Taste and Satiety.

How does it work?

Each axis represents a decision criterion, such as cost or effort. Each axis is split into two sections (thus forming the 2x2 appearance), such as low/high cost and easy/difficult. This visual representation of data will thus enable you to distinguish the options that are low cost and easy, versus low cost and hard, for example. For best results, define the boundaries between the quadrants. For example, if the horizontal axis represents the price of the project between high and low, the boundary line between high and low might be defined as $10,000.

A 2x2 matrix generally works in the following way:

  1. One variable is assigned to the x axis, e.g., the price of the project between high and low.

  2. The other variable is assigned to the y axis, e.g., how easy, or hard the project will be to realize.

  3. The data points – whatever you are trying to categorize – are placed in one of the four quadrants contingent on where they fall along the continuum of both variables.

For more on 2x2 Four Quadrant Matrix Templates:

What is a 2x2 Matrix 4

What is the Growth Share Matrix

How to Create your Own

eloqoon share idea

Have a 2x2 Four Quadrant Matrix Templates to share?

Publish a Templates

Learn more about digital publishing

eloqoon search

Can't find what you are looking for?

Tell us

Or browse through the Catalog

eloqoon search someone

Think of someone who could publish?

Suggest an author

Learn more about digital publishing

please wait...