Heat Map templates Start the discussion!

What are heat map excel templates?
A heat map is a type of tool used to visualize data. Generally, heat maps use different colours, warm-to-cool, that draw attention to certain areas. The employment of colours displays the data results clearly and immediately, thus aiding the user to discern the information more efficiently.
What are the other types of heat maps?
There are a variety different heat map types that can be utilised, such as:
Web Heat Maps:
-Hover Maps: This type of heat map is geared towards website owners as it allows visual tracking of mouse movement on a site. The results of mouse movement tracking, however, may not be entirely accurate - in regards to the areas that site visitors are actually looking at
-Click Maps: A heat map of this form shows the areas where clicks have been made. This can help to signal which areas of the sites are popular, and which areas of the site are perhaps misleading. Although useful, many prefer to use Google Analytics to see things such as CTR (click through rate).
Biology Heat Maps: Common in molecular biology, this type of heat map aims to show the gene expression across samples.
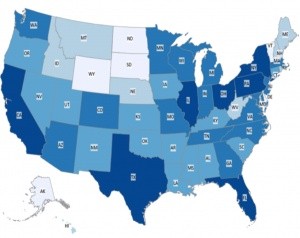
Geographic Heat Maps: This type of heat map is extremely useful in business as it allows the user to easily visualise data across a region. This is frequently utilised for political science, financial and economic data, sociology, and meteorology.
How to create your own heat map:
There are various ways that one can go about creating a heat map. It is possible to manually colour-code the cells in a data set, however this would require updating when values change.
Instead, by using conditional formatting in your Excel spreadsheet, it allows automatic updating of the colour of cells depending on data changes.
This can be executed in a fairly straightforward manner. By selecting the dataset, then finding the conditional formatting tab and choosing 'colour scales', you are able to format your data based on the values - differentiating these values by colour.
There are other heat map versions for different scenarios. For example, one can create a dynamic heat map. A dynamic heat map in Excel changes while you use the scroll bar. This can be a very useful tool for those dealing with a lack of space.
This type of heat map is, however, more basic than other heat maps. If you wish to find a more professional and aesthetically pleasing heat map for professional or personal use, it can be more efficient to download a template version.
If you wish to find out more about heat map charts, please refer to these webpages:
Wikipedia definitions of Heat Maps
How to create a heat map, with various types of heat map
To find ready to use, instantly downloadable heat map excel templates, please look below.


