BCG Growth-Share Matrix templates
Start the discussion!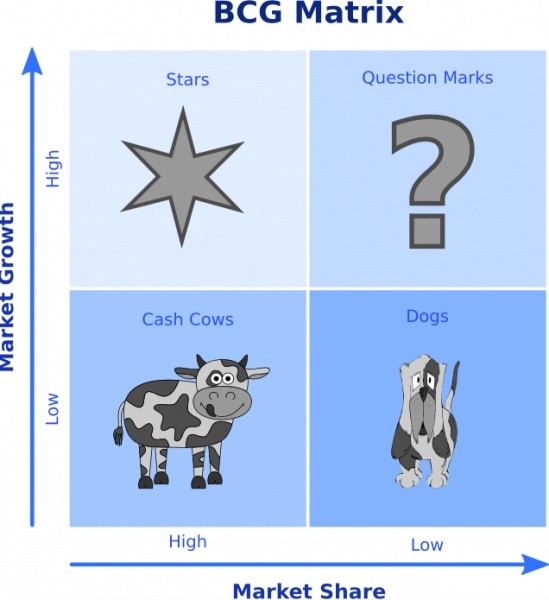
What is a BCG Matrix?
The BCG matrix was developed by the Boston Consulting Group in 1970 and is a planning tool that graphically represents a company’s portfolio of products and services in the hope that the company will decide which products it should keep, sell, or invest in. It plots a company’s offerings in a four square matrix, where the x-axis represents market share, and the y-axis represents the rate of market growth.
The BCG matrix is categorised into four quadrants:dogs, stars, cash cows and ‘question marks’. The dog represents a product that has a low market share and is in a low growth market. The idea is that dog products should be sold. Products that have a large market share but are in low growth areas are known as cash cows, meaning that a company should keep it on the market for as long as they can. Star products are ones that are in high growth markets, take up a large portion of market share, and should be invested in even more. Products that are in high growth markets but do not maintain large market share are known as question marks. This type of product needs to be analysed more.
Characteristics of Each Quadrant
-Dogs, located in the lower right hand quadrant on the grid, do not generate much money as they have low market share and little to no growth. Due to this, dog products can end up being cash traps, which tie up company funds for a lengthy period of time. This means that they are candidates for divesture.
-Cash cows, located in the lower left quadrant, are generally leading products in mature markets. These products are often cash generators that create higher returns than the market growth’s rate, and tend to sustain themselves well from a cash flow perspective. The values of these products are not difficult to calculate due to the fact that their cash flow patterns are predictable.
-The upper left hand quadrant is stars. These generate high income but tend to cost the company large amounts of cash. Stars would eventually become cash cows if they remain a market leader, and if the market’s growth rate declines.
-Question mark products are located in the upper right quadrant of the matrix. These products tend to grow fast, but can consume large amounts of resources. Question marks should be frequently analysed to decide whether they are worth staying in the market.
Advantages of using the BCG Matrix:
-It is helpful for managers to evaluate the company’s product line, and the balance in their portfolio of stars, dogs, cash cows and question marks.
-It is applicable to companies that seek volume and experience effects.
-It is simple and easy-to-understand.
-Provides as a base for management to decide which products to keep, invest in and to get rid of.
-If a business can use the experience curve to its advantage, then it can manufacture and sell new products at a low price that can allow it to get early market share leadership. Then once it has become a star, it is inevitably profitable.
Limitations of using the BCG Matrix:
-High market share is only one of many success factors; neither is market growth the only indicator of market attractiveness.
-It ignores the effects of synergies
-‘Dog’ products can often earn more cash as cash cows
-The matrix only uses two dimensions – market share and growth rate. This can tempt management to divest too early, or to over-emphasise a particular product.
-A company with low market share can be profitable.
-The matrix ignores small competitors that have fast growing market shares.
You will find below some BCG Growth-Share Matrix templates, as well as some guides on how to effectively use it.
For more information on this subject, visit: