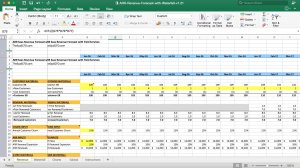
SaaS Revenue Waterfall Excel Chart Template
A SaaS Excel Model to help you forecast revenue waterfall in simple, automated charts.
13,680Discussadd_shopping_cart
free

A waterfall chart is a type of chart used for data visualization. More specifically, it helps to show an initial figure and how that figure has been affected by sequentially introduced values - whether they be positive or negative. The final figure is then presented to show the end value.
Also known as a 'flying brick' chart, 'Mario' chart, or 'bridge', this type of data visualization tool was popularized by McKinsey and co in the latter stages of the 20th century.
The aim of a waterfall chart is to show how an initial figure is changed by positive or negative values. It is common for the initial and end values to be represented as whole columns, whereas the intermediate values are detached, and start from the value of the preceding column in the chart. Often, colour-coding is used to as a way to distinguish positive and negative data values.
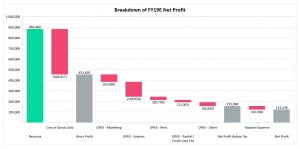
Waterfall charts can be applied to a variety of areas. As they are used to present the change or transition in value of an entity, waterfall charts can be effectively applied to explain revenue or profit changes over time. Thus waterfall charts are useful for any team or business unit looking to express quantitative figures for analysis, i.e. inventory analysis. They are useful for pinpointing the factors resulting in a specific outcome.
Standard waterfall chart: This simply shows how certain factors lead to the end result, without major complication.
Waterfall chart with subtotals: This type of chart returns results before all the factors have been calculated in. For example, it is common for Earnings Before Interest, Tax, Depreciation, Amortization (EBITDA) to be shown as a full bar (as the start and end figures are) in an intermediary stage of the waterfall chart.
Difference analysis waterfall charts: Another use for waterfall charts is to show how different factors affected the first and last result in a specific timeframe. For example, one can compare the performance of individual business units and how they have affected the business's overall performance in sales. This can help distinguish in a clear, visual manner between which business units have been performing well, and which have been underperforming.
-Customizable, in terms of appearance as well as data
-They can be incredibly simple, while also being made complex if required
-Useful for analytics and presenting gradual changes in certain item values
-Waterfall charts are extremely flexible and can be used by a range of people, from sales teams to construction companies
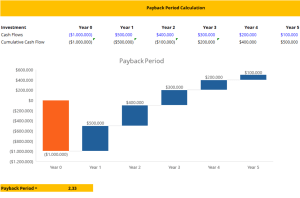
-To demonstrate how one has reached a cumulative value, breaking down positive and negative value contributions.
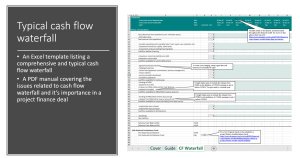
As waterfall charts carry a certain level of complexity in creation, it is often more efficient to find ready-to-use templates. Please find these below on Eloquens.com.