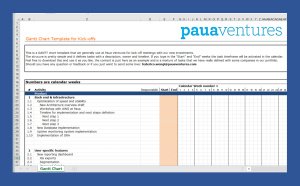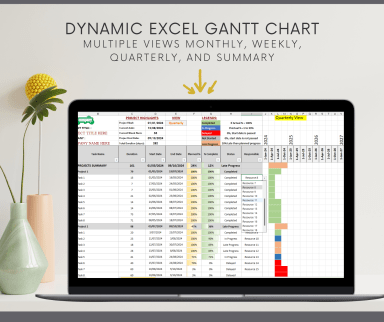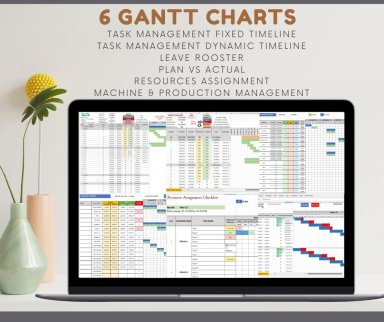
Dynamic Gantt Chart Template
Dynamic Gantt Chart for Project Management. Thi tool is for monitoring, controlling, and displaying the progress of a project.
8181library_add

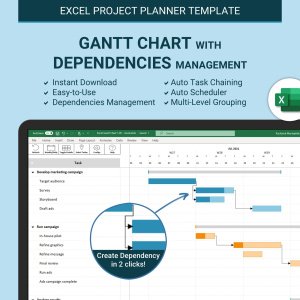
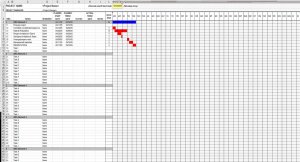
Gantt charts are a form of bar chart used for more effective project management organization. They seek to present, in a visual manner, the project schedule and different tasks' timeframes.
Typically, Gantt charts list the tasks that are to be performed on a vertical axis, with the time intervals placed on a horizontal axis.
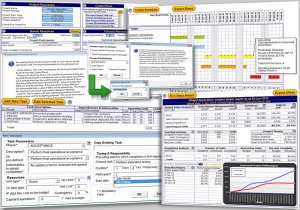
Gantt Charts contain:
-Start and end dates for the tasks
-Project milestones
-Task dependencies
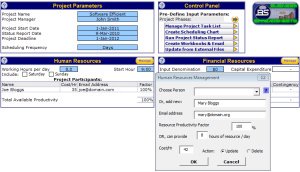
-Those assigned to the tasks
These charts are widely used in project management as they carry a number of benefits:
Avoid confusion: The layout of Gantt charts help to plan and track things in a visually clear way. The user is able to see the timeframe of tasks, and their correlation with other tasks that may overlap in date.
Visualise relationships: The Gantt chart also allows the user understand the relationship between tasks and how completion of one task can aid the completion of another.
Allocate resources more effectively: This is due to the easy-to-understand nature of a Gantt chart. Project management teams are able to see when and where resources will be needed.
-Construction
-Software Development
-Manufacturing
-Marketing
-Classify the tasks: Gantt charts require the user to input all the tasks that are essential for a project. This helps to organize the whole project rather than just the most important or urgent tasks.
-Understand the relationships between tasks: As has been noted, Gantt charts can show the relationship between separate tasks. It is thus necessary to classify these links beforehand.
-Input the tasks required into your template
-Update you Gantt Chart: By keeping the chart tasks and activities up-to-date, you are also keeping all the users au courant by improving the communication of your project.
The Gantt Chart can be traced back to the 19th century, with Karol Adamiecki developing a version in Polish. It was, however, popularised in the West by Henry Gantt in the early 20th century and used by the US Military in the First World War. Initially, Gantt Charts were drawn on paper or involved blocks. After the introduction of the PC, the charts have evolved and propelled their usage amount with businesses and other organizations.
If you wish to know more about Gantt Charts, please refer to these links:
Origins and creating Gantt Charts
To find ready-to-use, downloadable, Gantt chart models, look below on Eloquens.com.