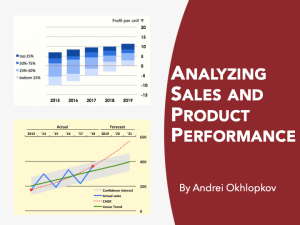
Analyzing Sales and Product Performance
Tools to analyse sales, portfolio performance, seasonal variations, price-volume-mix factors
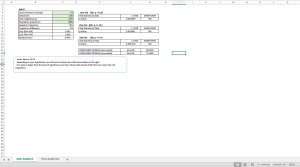
1,965Discussadd_shopping_cart
$20.00

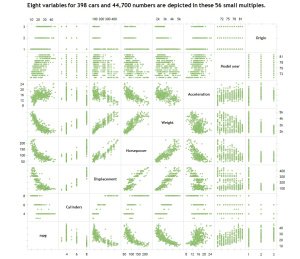
Statistics is a branch of mathematics, which involves dealing with data by collecting, organising, analysing, interpreting, and presenting it.
As statistics is an interdisciplinary field, there are many uses for it. It is applied in almost all scientific areas, whether that be physical, biological, or social sciences, for example. Statistics helps the user analyse mathematics and make use of data. The range of contexts that it can be applied to makes it an extremely important discipline with which to study.
The principle statistical methods used for data analysis are descriptive and inferential statistics.
Descriptive statistics: This form of stats seeks to show and summarise the data in order to reveal certain patterns. This is an essential part of data analysis as it translates raw data into more substantial information. The limitation of descriptive statistics is that it does not attempt to go beyond the data analysed, effectively limiting the level of inference that can be made.
Inferential statistics: This form of stats makes inferences based on the available data, drawing larger conclusions from the original data set. It is crucial that the sample used for inferential statistics is accurate, as the generalisation made will be based on the sample data. The limitation of inferential statistics is thus that the conclusions drawn cannot be totally reliable, due to the margin of error involved in the inference.
There are many common methods used in statistics, some of which include:
Analysis of Variance (ANOVA): This technique determines if there is significant difference between the means of two or more data groups. Using ANOVA, it is possible that you will be dealing with grand mean, between group variability, within group variability, and F-statistic, amongst others. To understand more about Analysis of Variance, use this link.
Factor Analysis: This type of technique reduces variables into a lower number of variables named factors. Involved in factor analysis are a number of other techniques. Principle component analysis, Common factor analysis, Image factoring, and Factor Loading are all examples. More information about factor analysis can be found here.
Correlation: This statistical technique analyses if and how variables relate to each other. Correlation coefficients measure the results of the correlation between the variables; an example of this is the Pearson correlation coefficient. Here is a webpage introducing correlation.
Regression Analysis: This technique is used for predicting the relationships between two or more variables. This is useful to use for those wanting to understand which specific independent variables are influencing the dependent variables. There are different types of regression analysis, such as linear regression and non-linear regression.
Article on why statistics are important
What is Regression analysis? and why is it useful
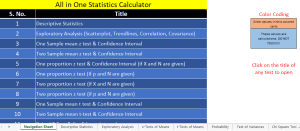
To have access to a wealth of methods, templates, and tips on statistics, please look below on Eloquens.com
If you have any questions, don't hesitate to reach out to the Eloquens Team via our channel page.