Originally published: 24/01/2025 00:46
Publication number: ELQ-18653-1
View all versions & Certificate
Publication number: ELQ-18653-1
View all versions & Certificate

Glass Manufacturer Financial Model Excel Template
A comprehensive editable, 5-year 3-statement MS Excel spreadsheet for tracking a Glass Manufacturer's Finances
 by AllFinancialModels
AllFinancialModels offer a curated selection of high-quality yet financial model templates designed to support a wide range of business needs.Follow
glassmanufacturermanufacturingglass manufacturerexcelfinancial modelfinancefinanceswholesale glass manufacturerms excel
Description
5-Year 3-Statement Financial Model for a Glass ManufacturerThese financial models for a glass manufacturer detail the Income Statement, Cash Flow Statement, and Balance Sheet projections, addressing operations with 80 product lines with a 6-Tier Subscription Model for value-added services.
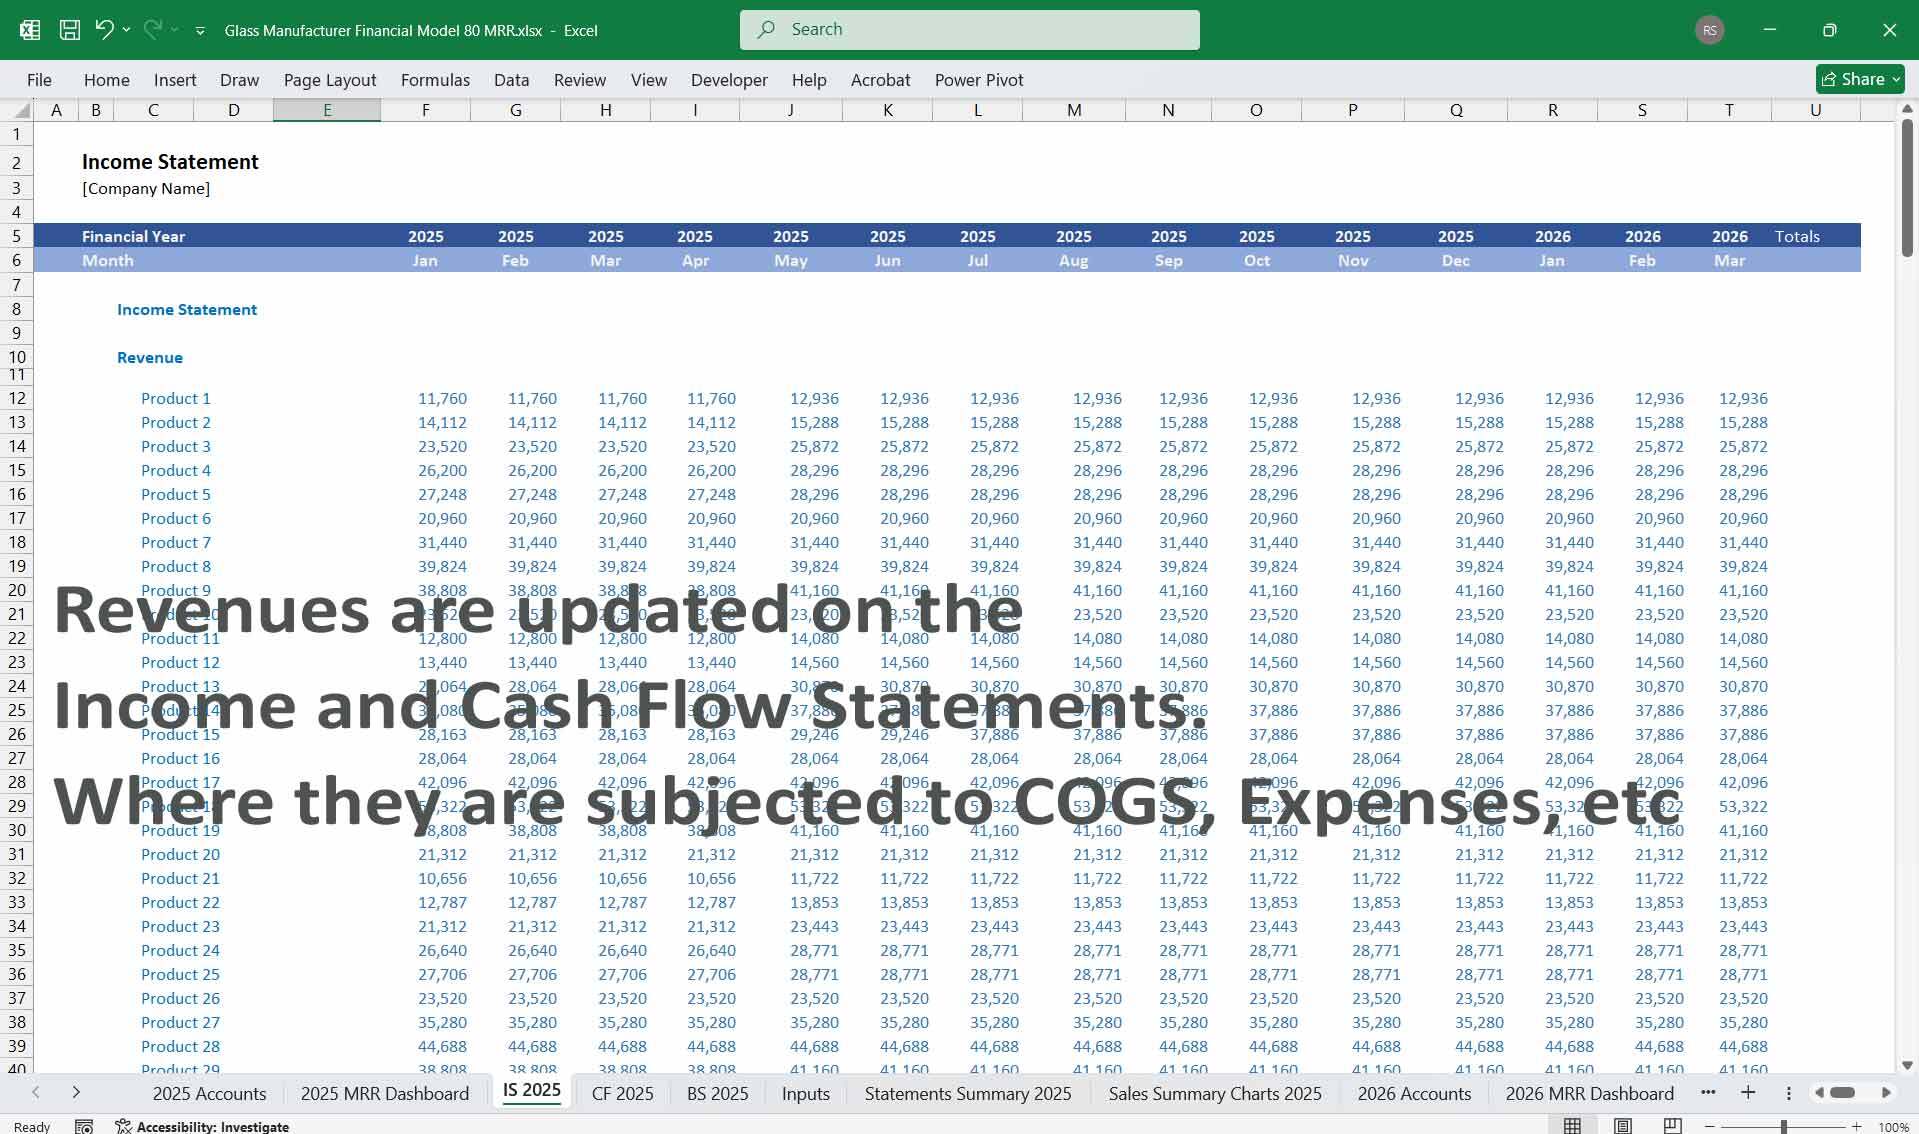
1. Income StatementRevenue Streams
Tier Breakdown
5-Year 3-Statement Financial Model for a Glass ManufacturerThese financial models for a glass manufacturer detail the Income Statement, Cash Flow Statement, and Balance Sheet projections, addressing operations with 80 product lines with a 6-Tier Subscription Model for value-added services.
1. Income StatementRevenue Streams
- Product Sales Revenue
- Glass Products: Float glass, tempered glass, laminated glass, speciality glass (e.g., solar, architectural, and automotive).
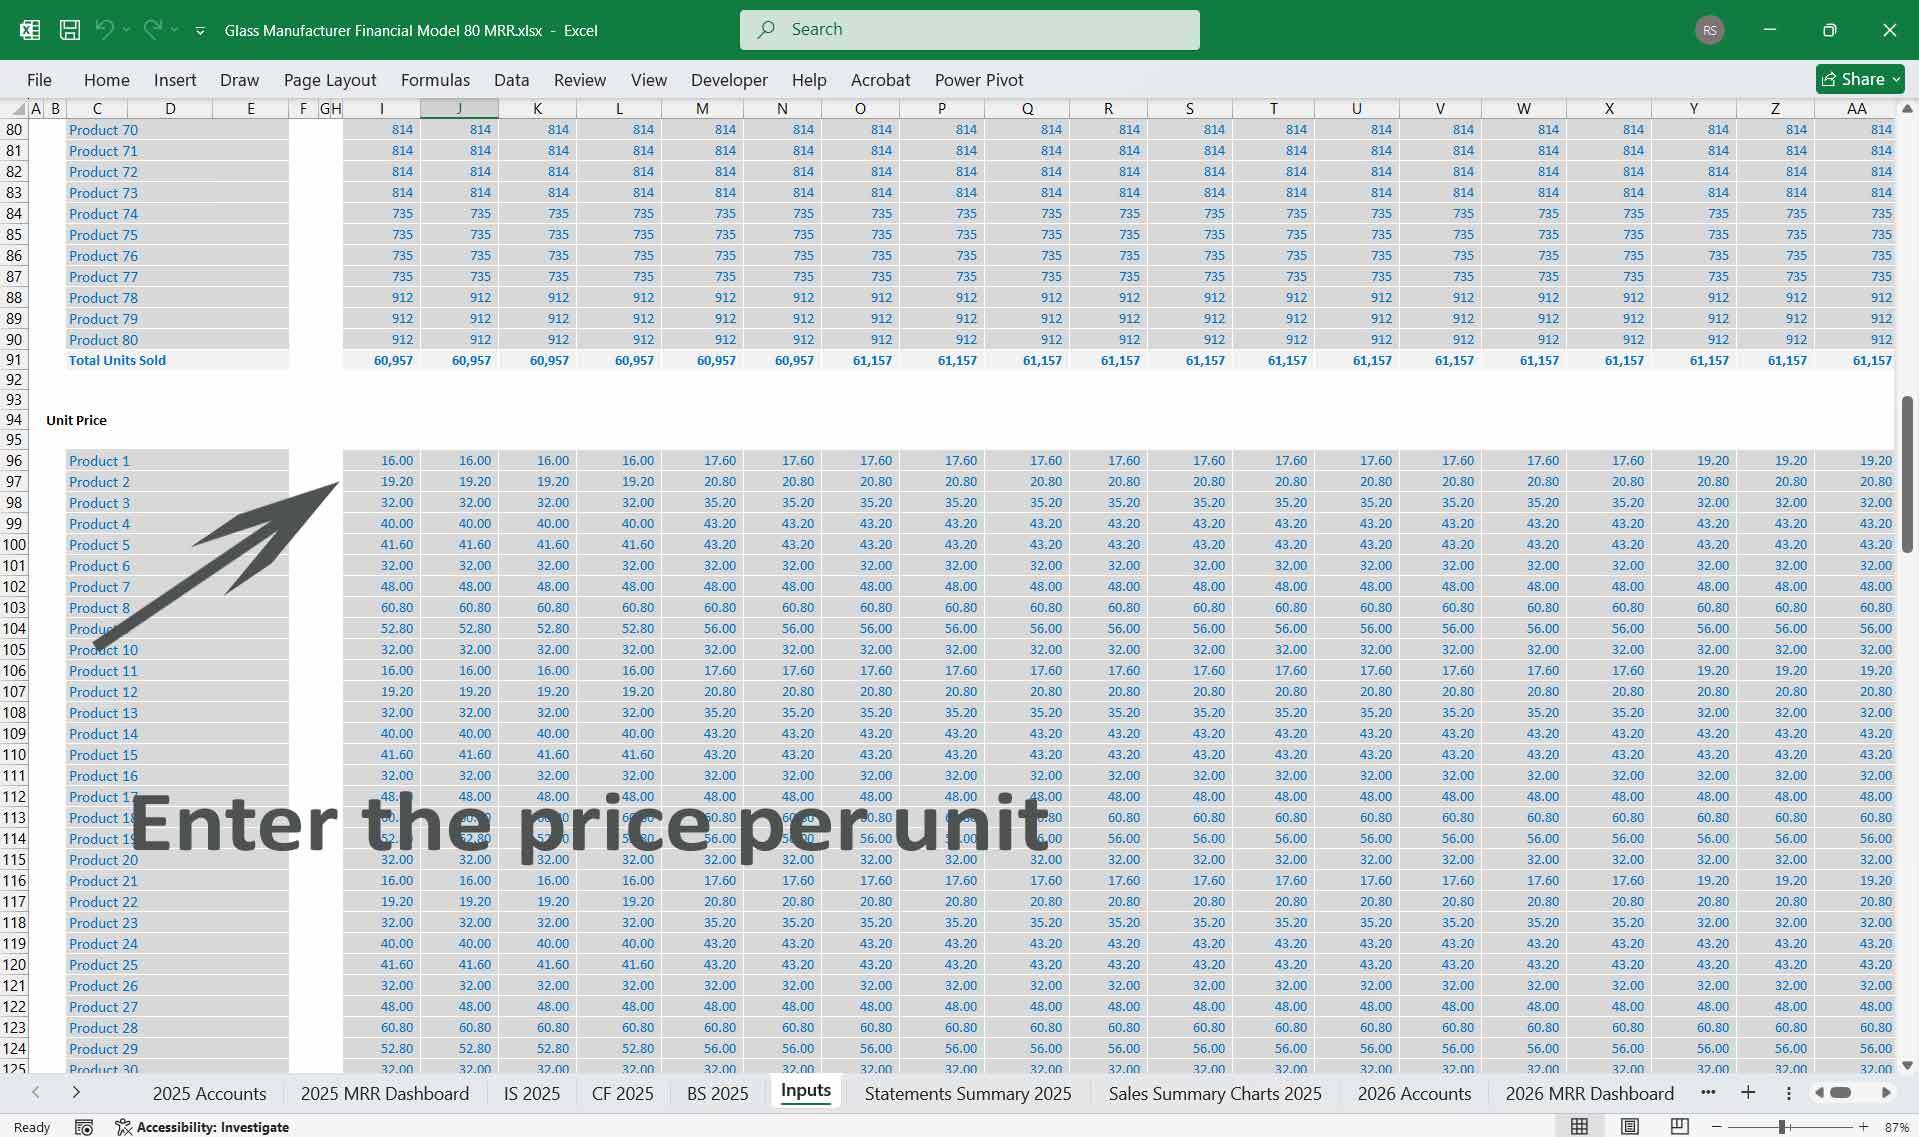
- Price Points:
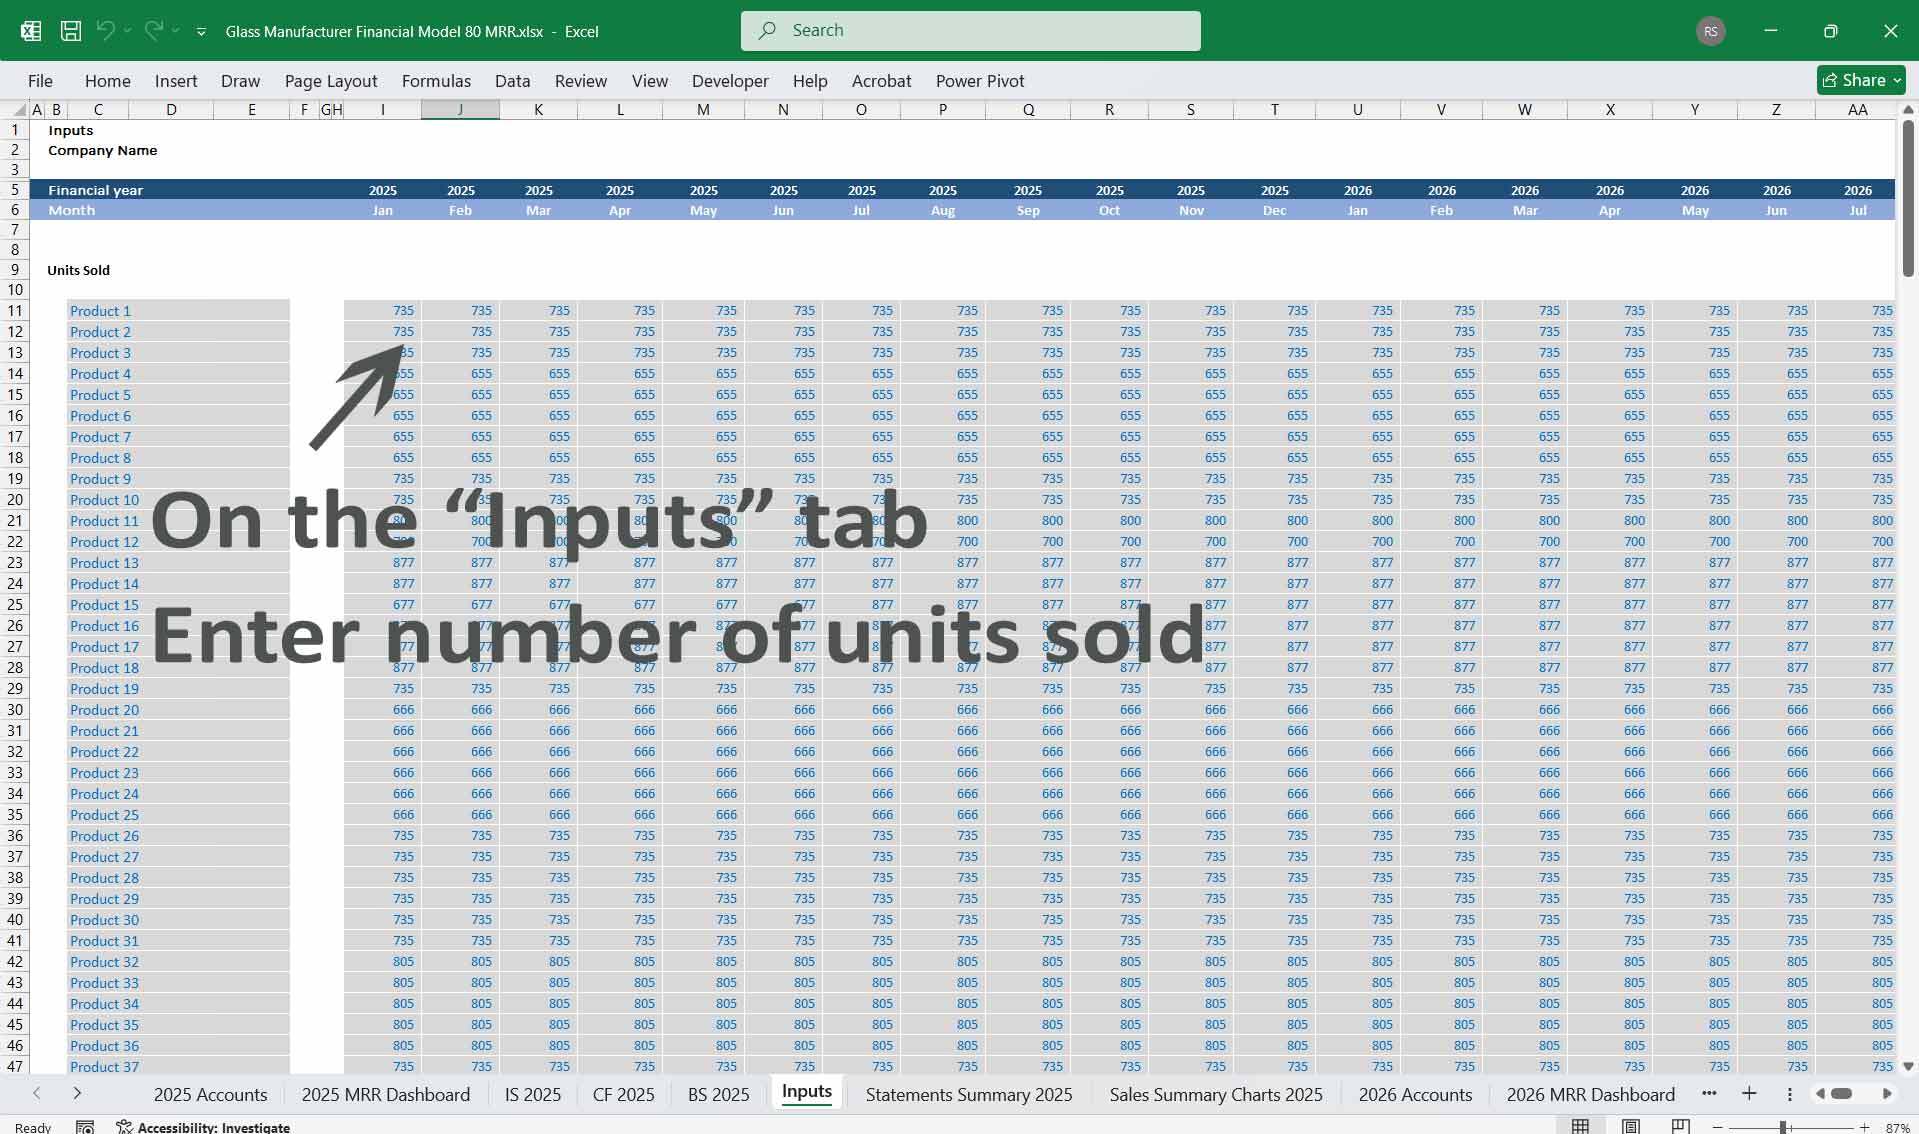
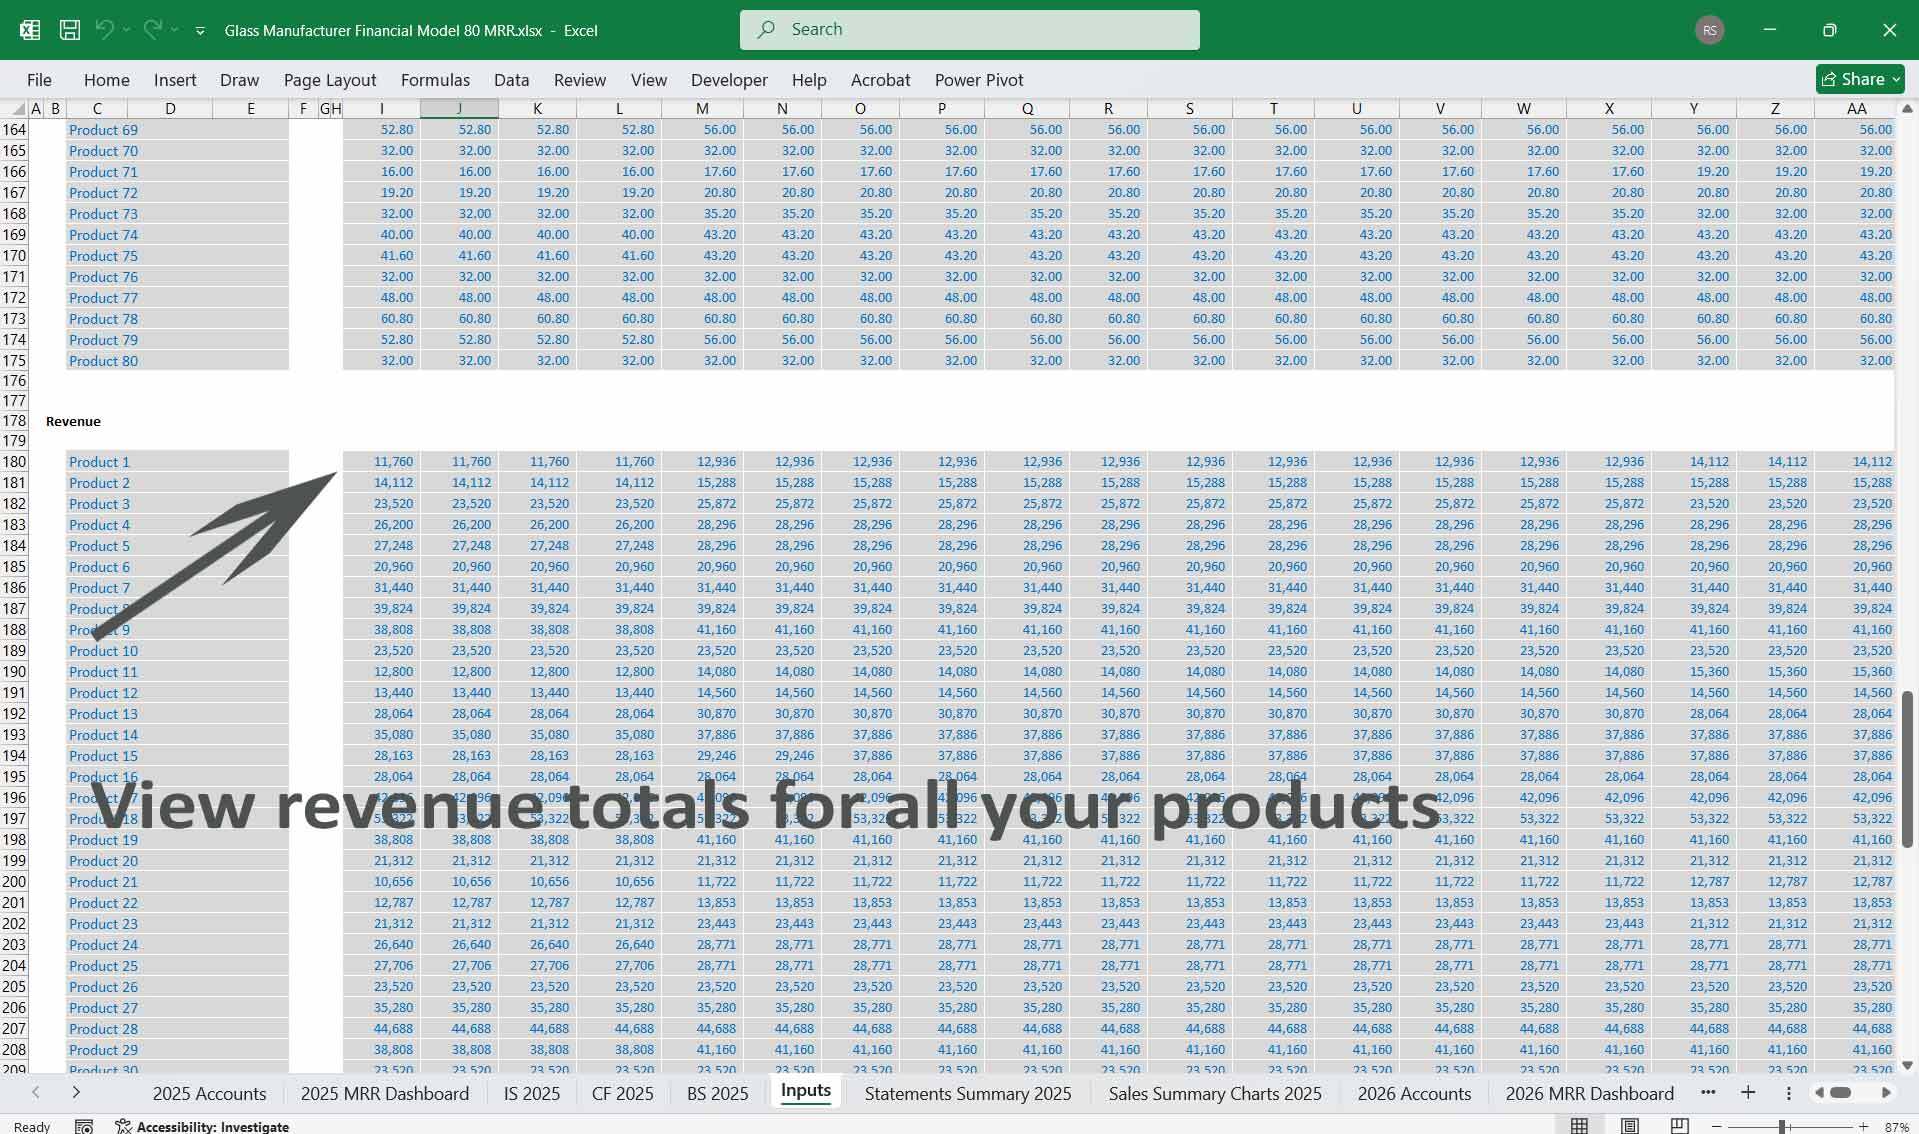
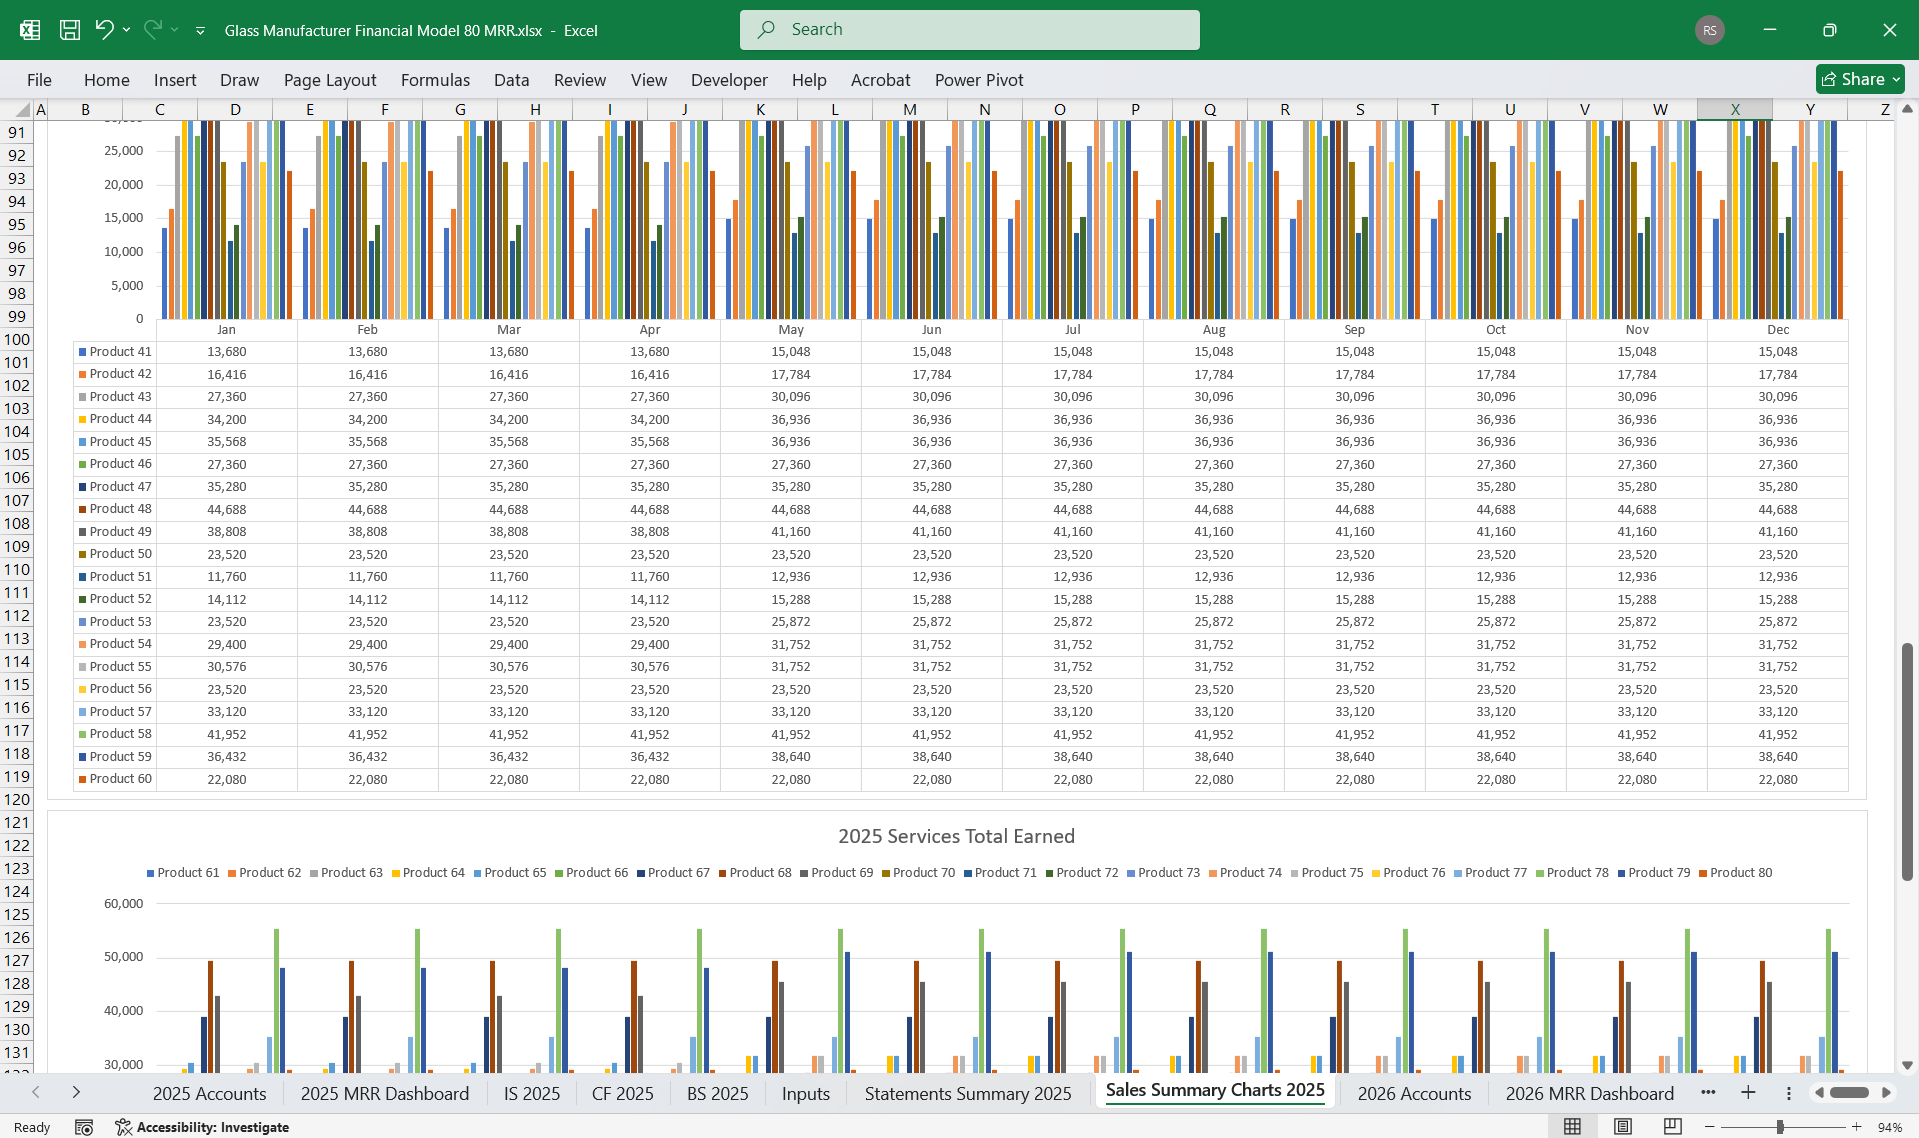
- 80 product lines: Average unit price $175/unit.
- Volume Projections (Units Sold Annually):
- 80 product lines: 1,000,000 units.
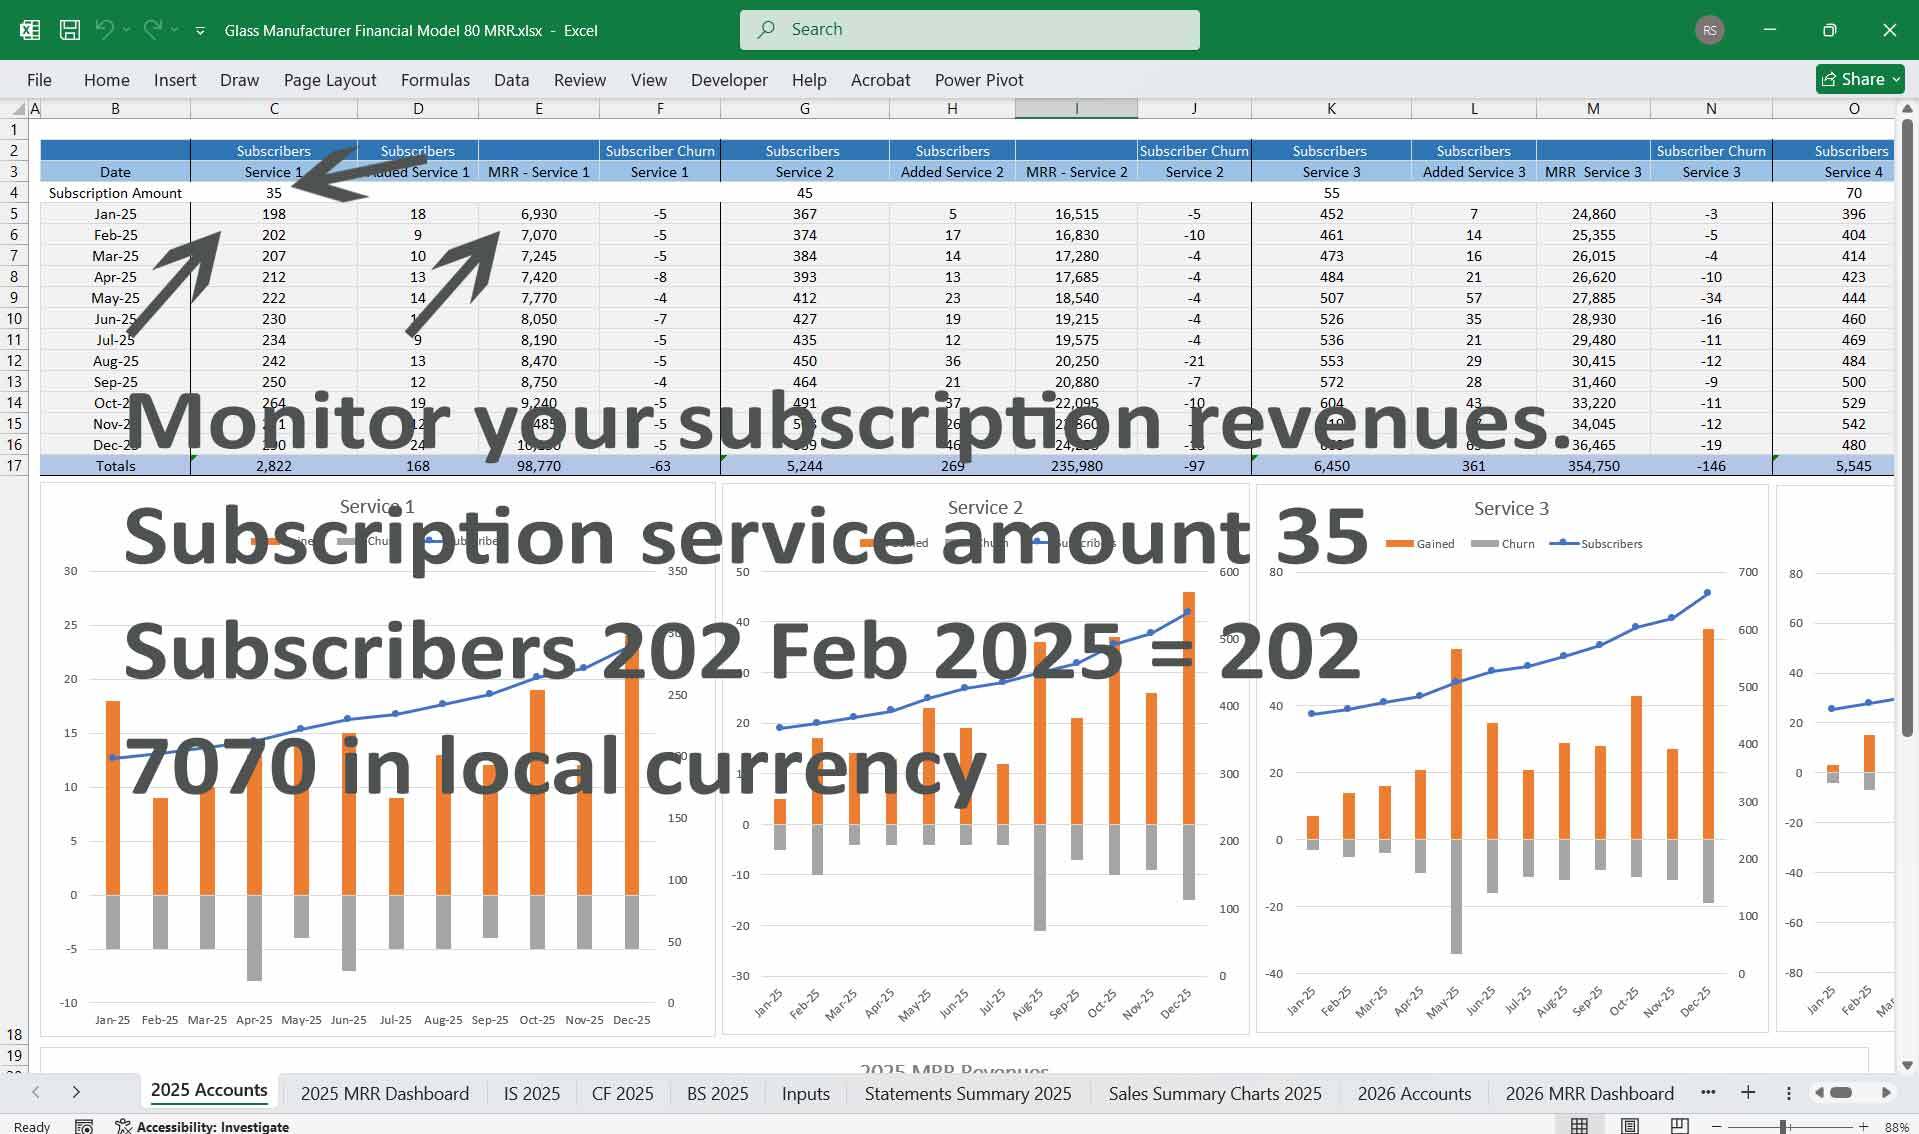
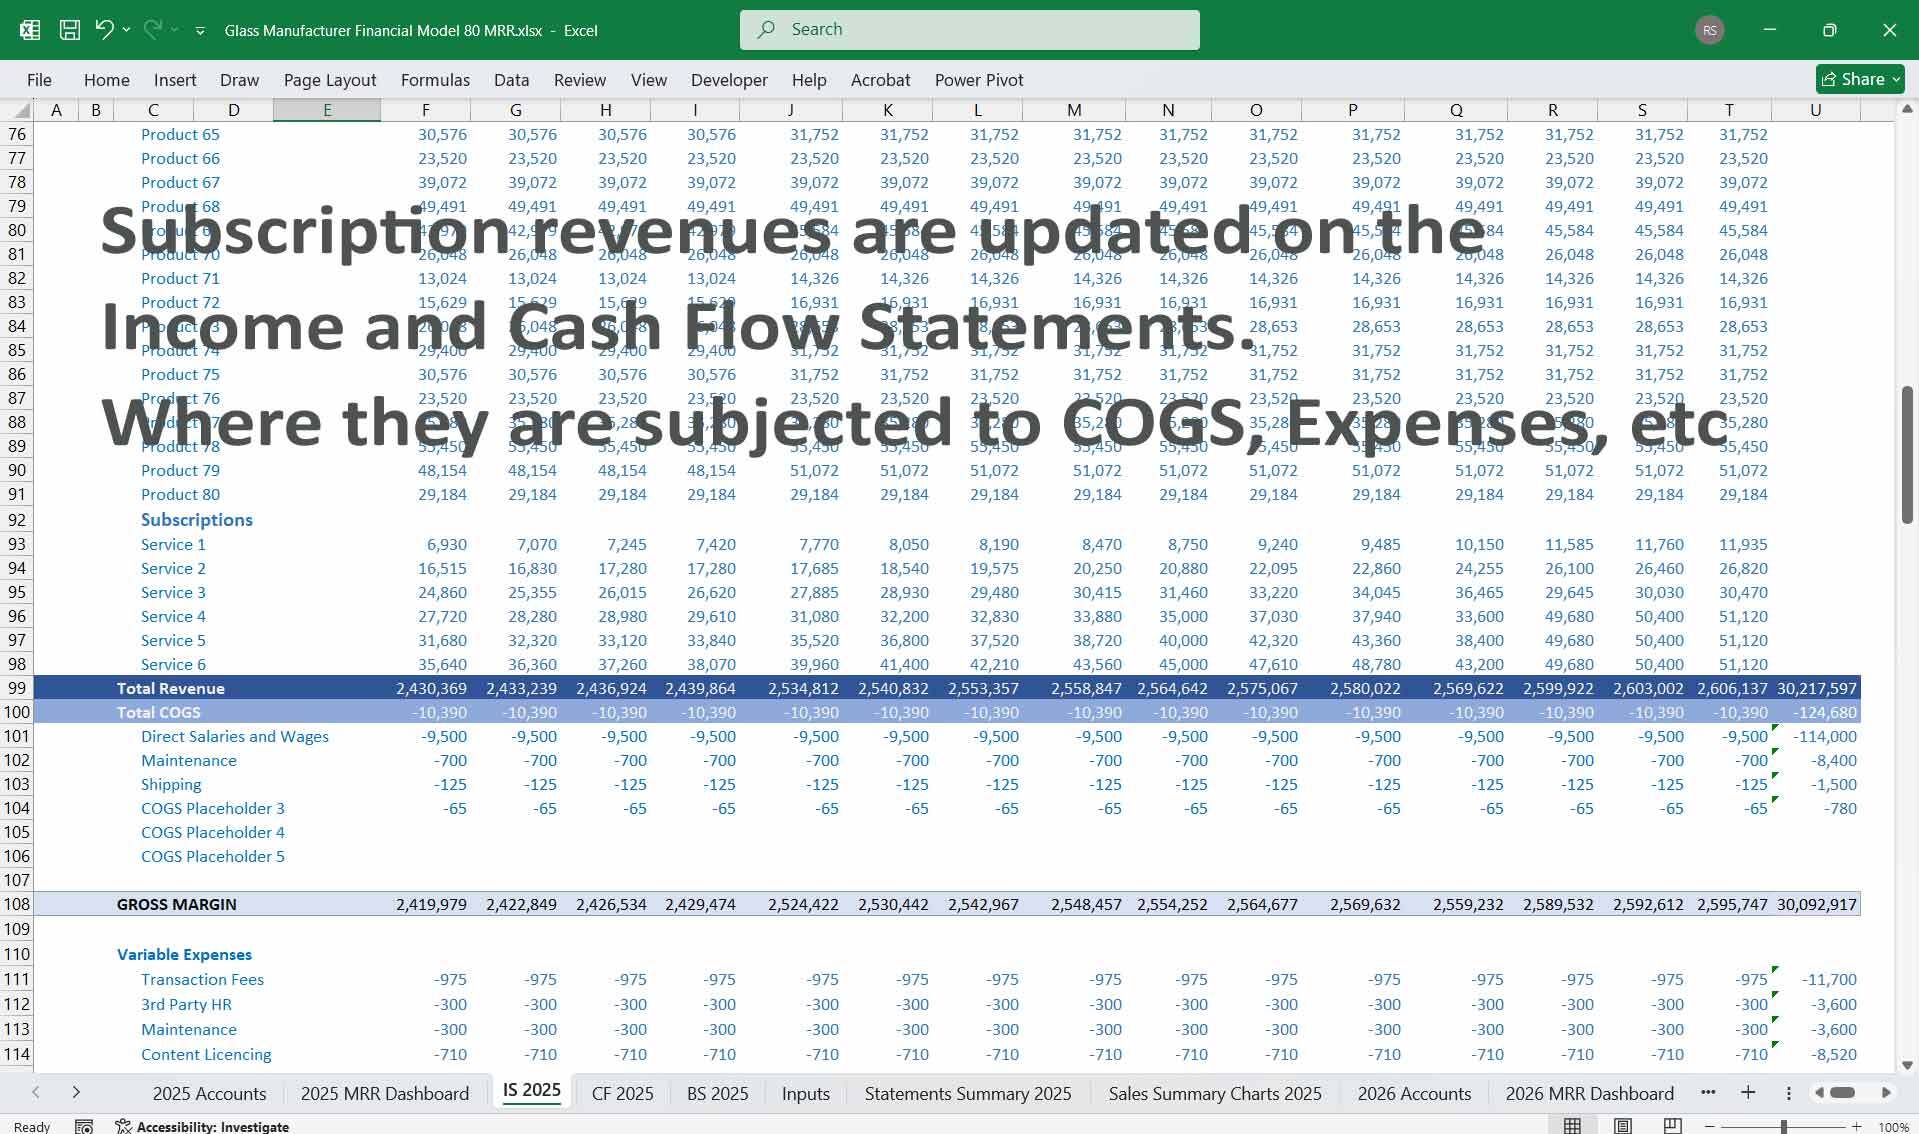
- Subscription Revenue
- B2B services like performance monitoring, supply chain integration, recycling/reuse consulting, and glass durability diagnostics.
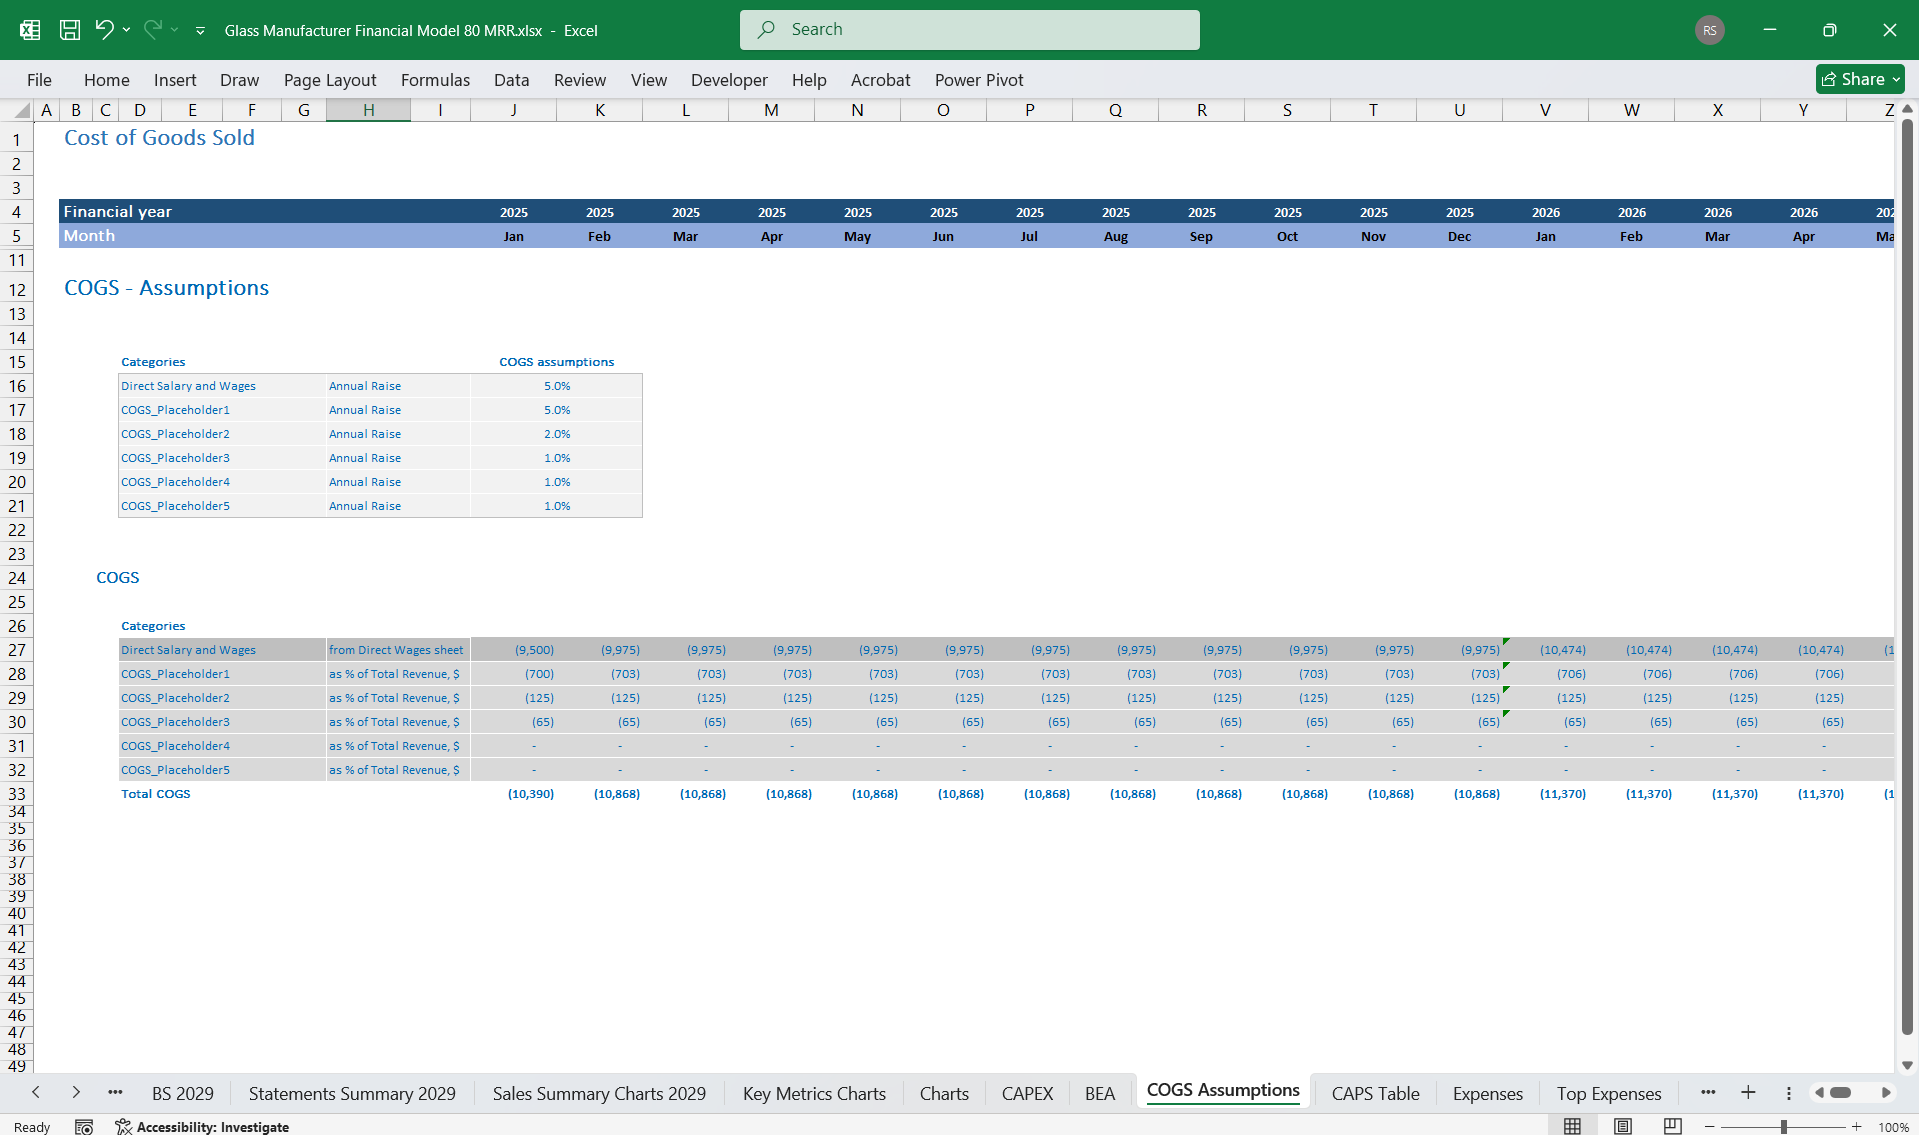
- Materials: Sand, soda ash, limestone, and recycled glass (~$60/unit for 40 lines, ~$70/unit for 80 lines).
- Energy: Significant factor for melting and tempering glass (~15% of COGS).
- Labor and Overheads: Factory worker wages, utilities, and plant maintenance.
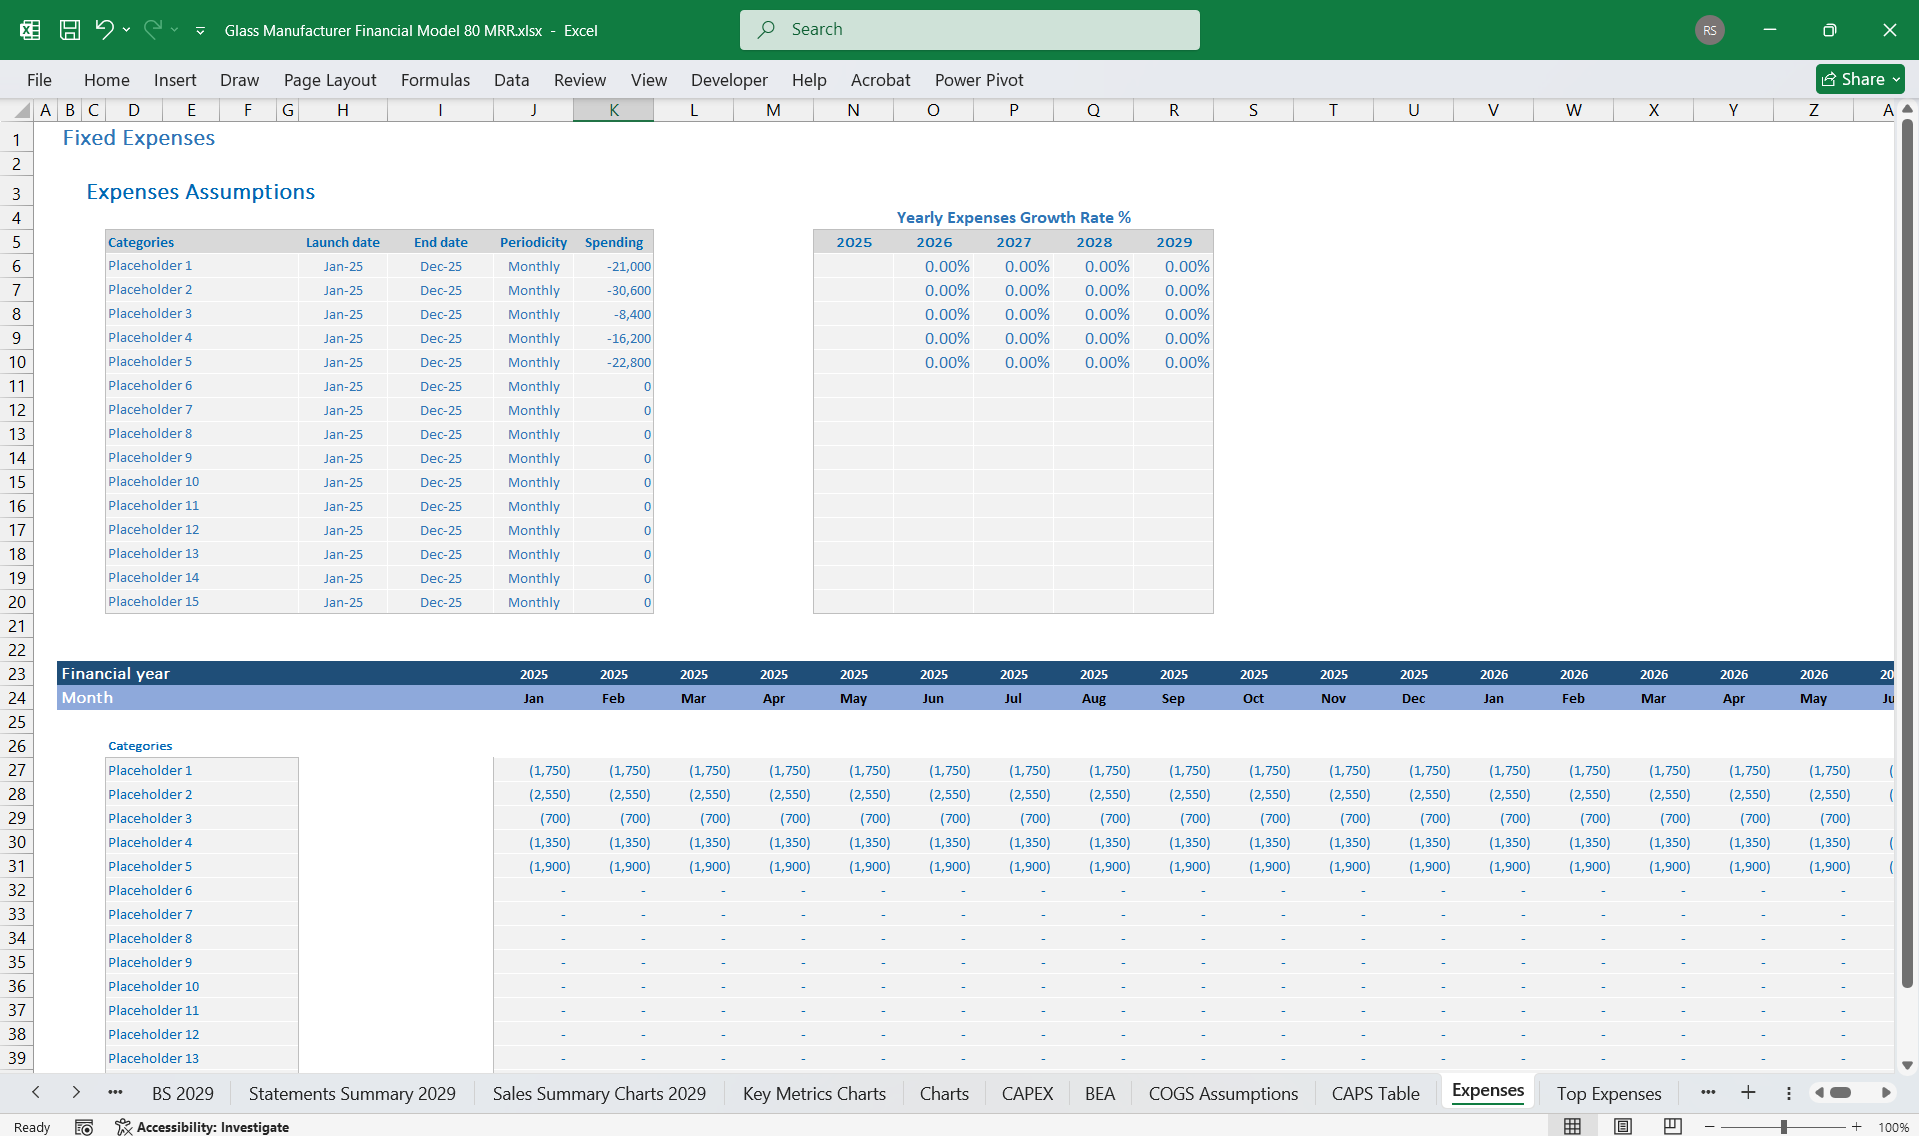
- R&D: Innovation in sustainable and energy-efficient glass technology (8-10% of revenue).
- Marketing and Sales: 12-14% of revenue.
- Logistics & Distribution: Shipping costs for global exports.
- G&A: Salaries, office costs, software licensing.
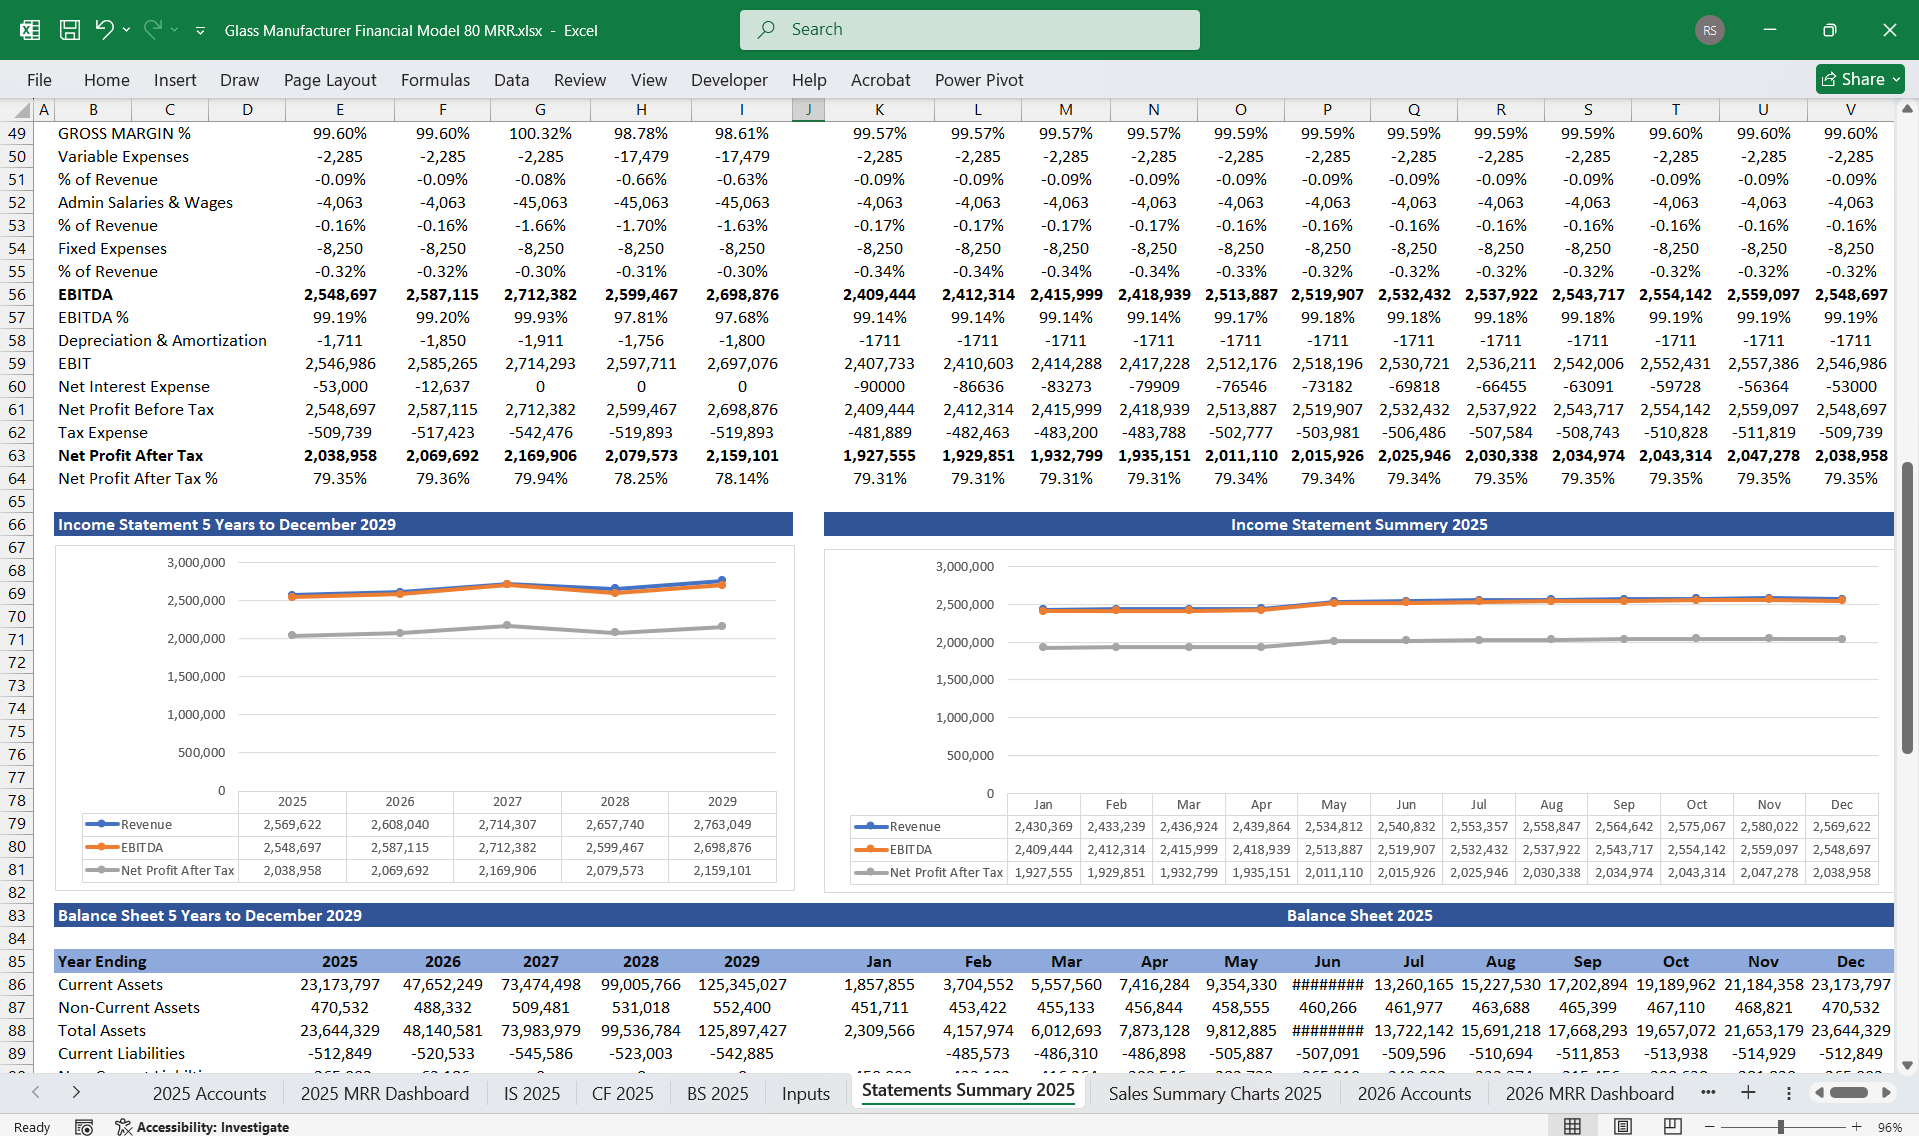
- Gross Profit: Revenue - COGS.
- EBITDA: Gross Profit - Operating Expenses.
- Net Profit: EBITDA - Depreciation, Amortization, Taxes, and Interest.
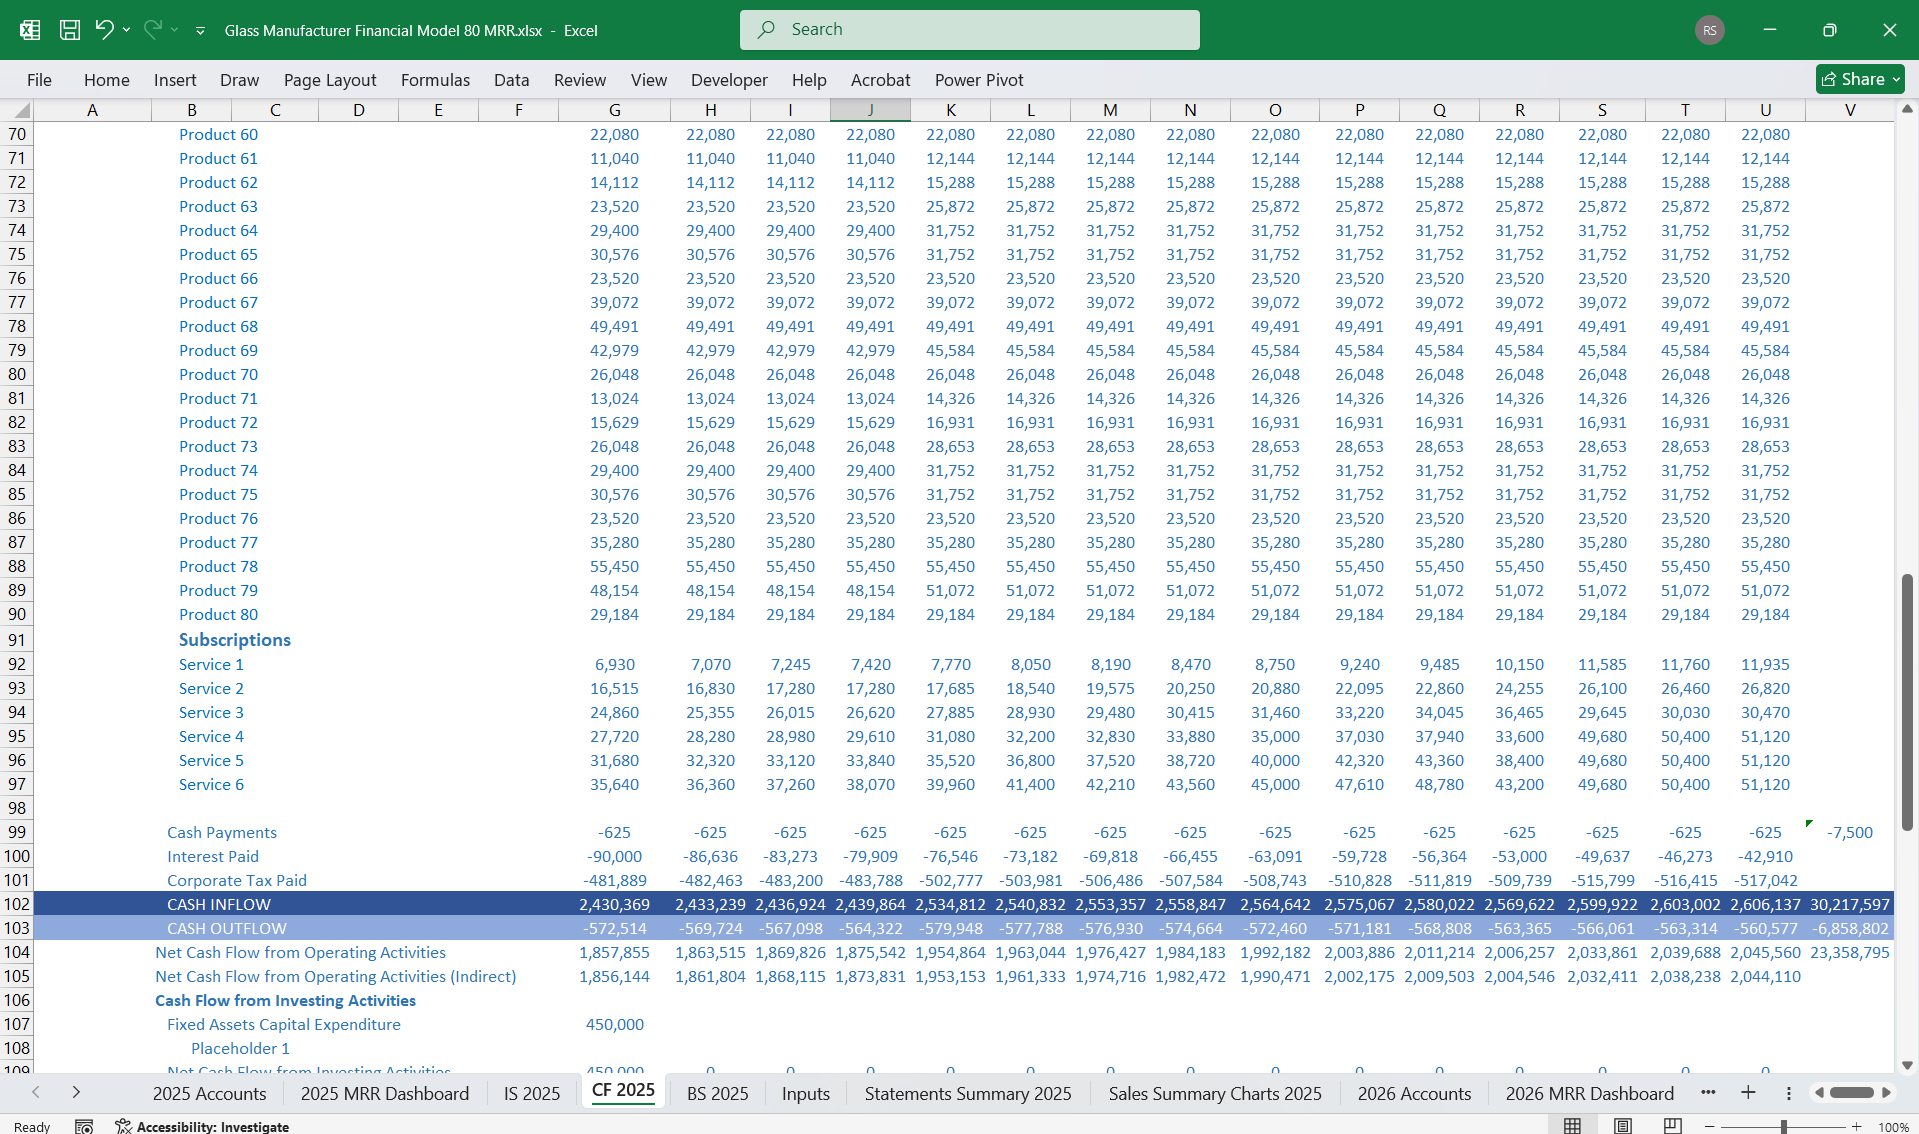
- Inflows:
- Product sales: Payment terms of Net 60.
- Subscription receipts: Monthly or annual.
- Outflows:
- Payments for raw materials (Net 30).
- Energy bills for production lines.
- Salaries, R&D, marketing expenses.
- Purchase of manufacturing equipment and furnaces.
- Expansion into automated systems for high-tech glass production.
- Development costs for subscription-related digital platforms.
- Loan or equity funding for scaling to 80 lines.
- Dividend payments or reinvestment into the business.
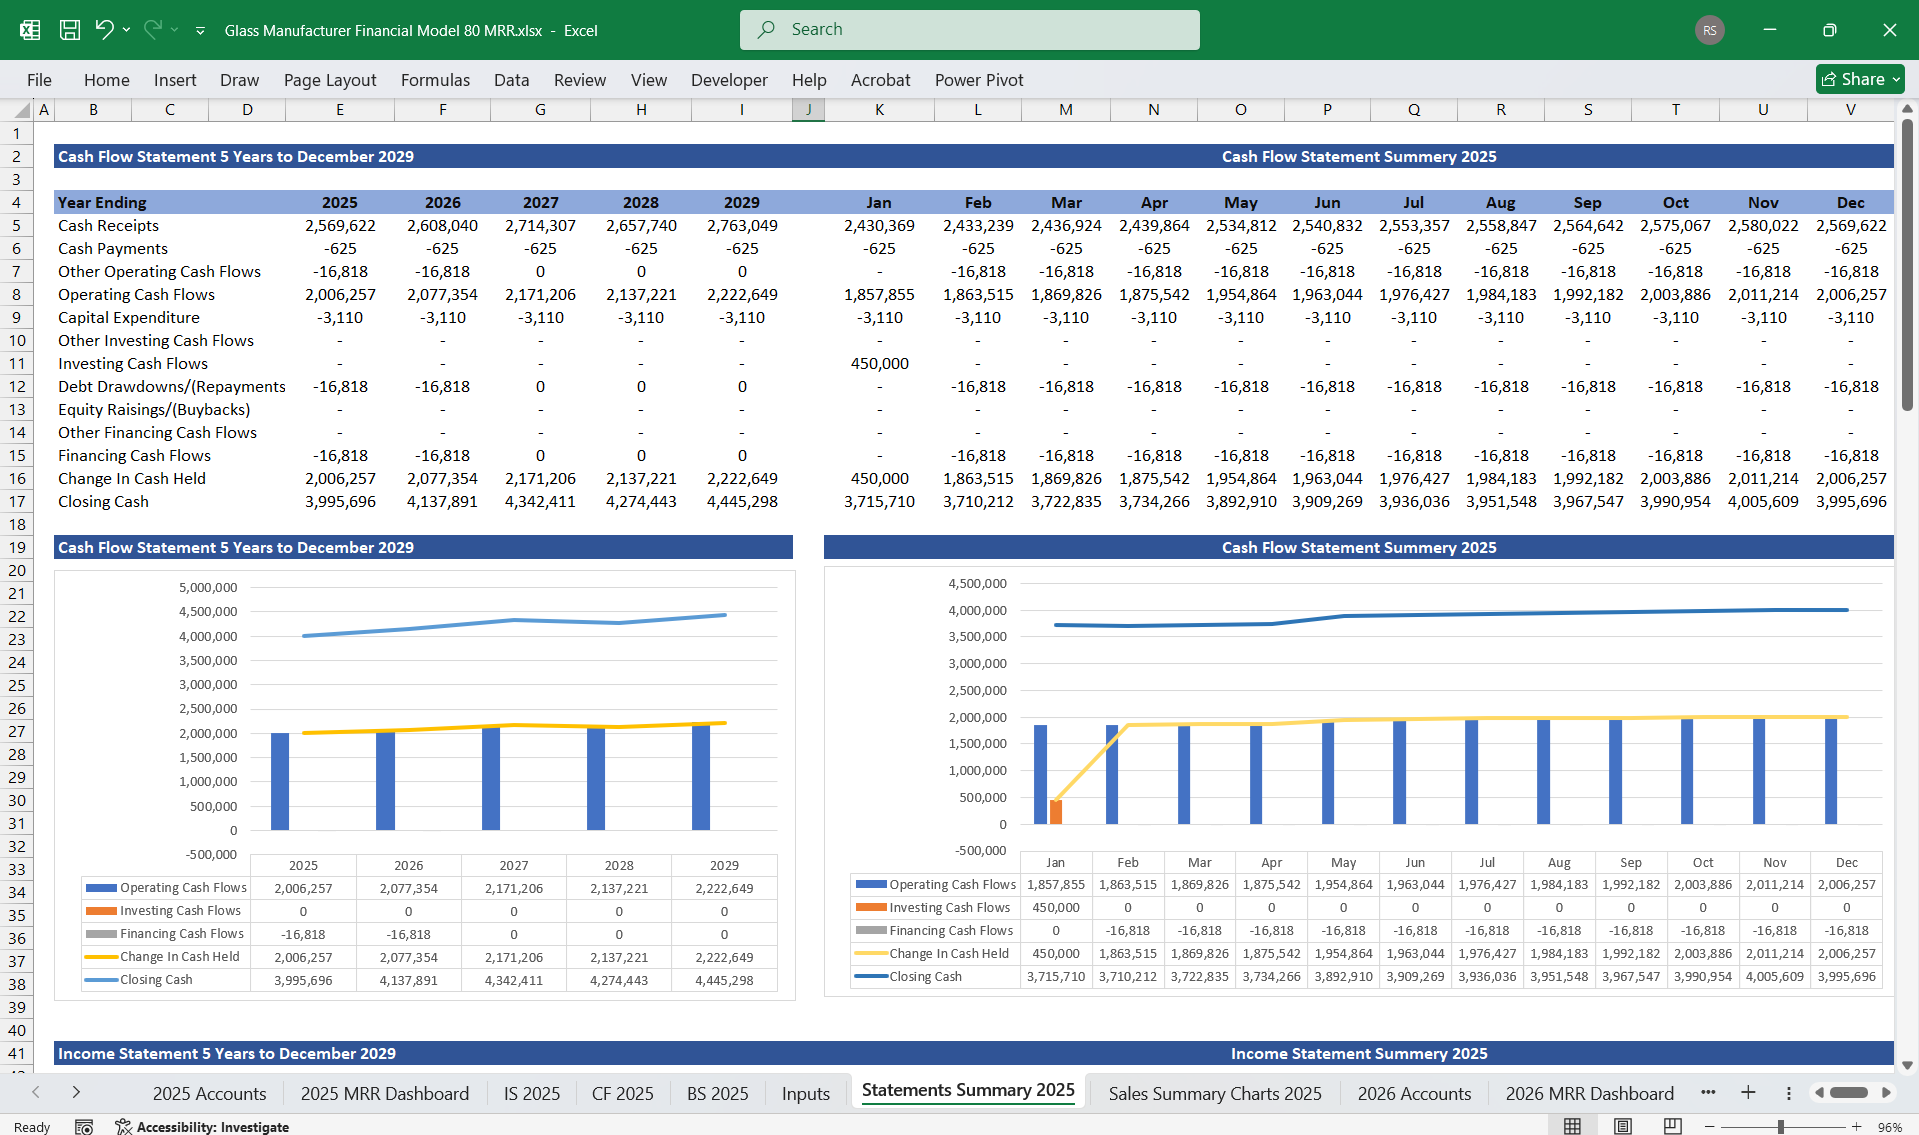
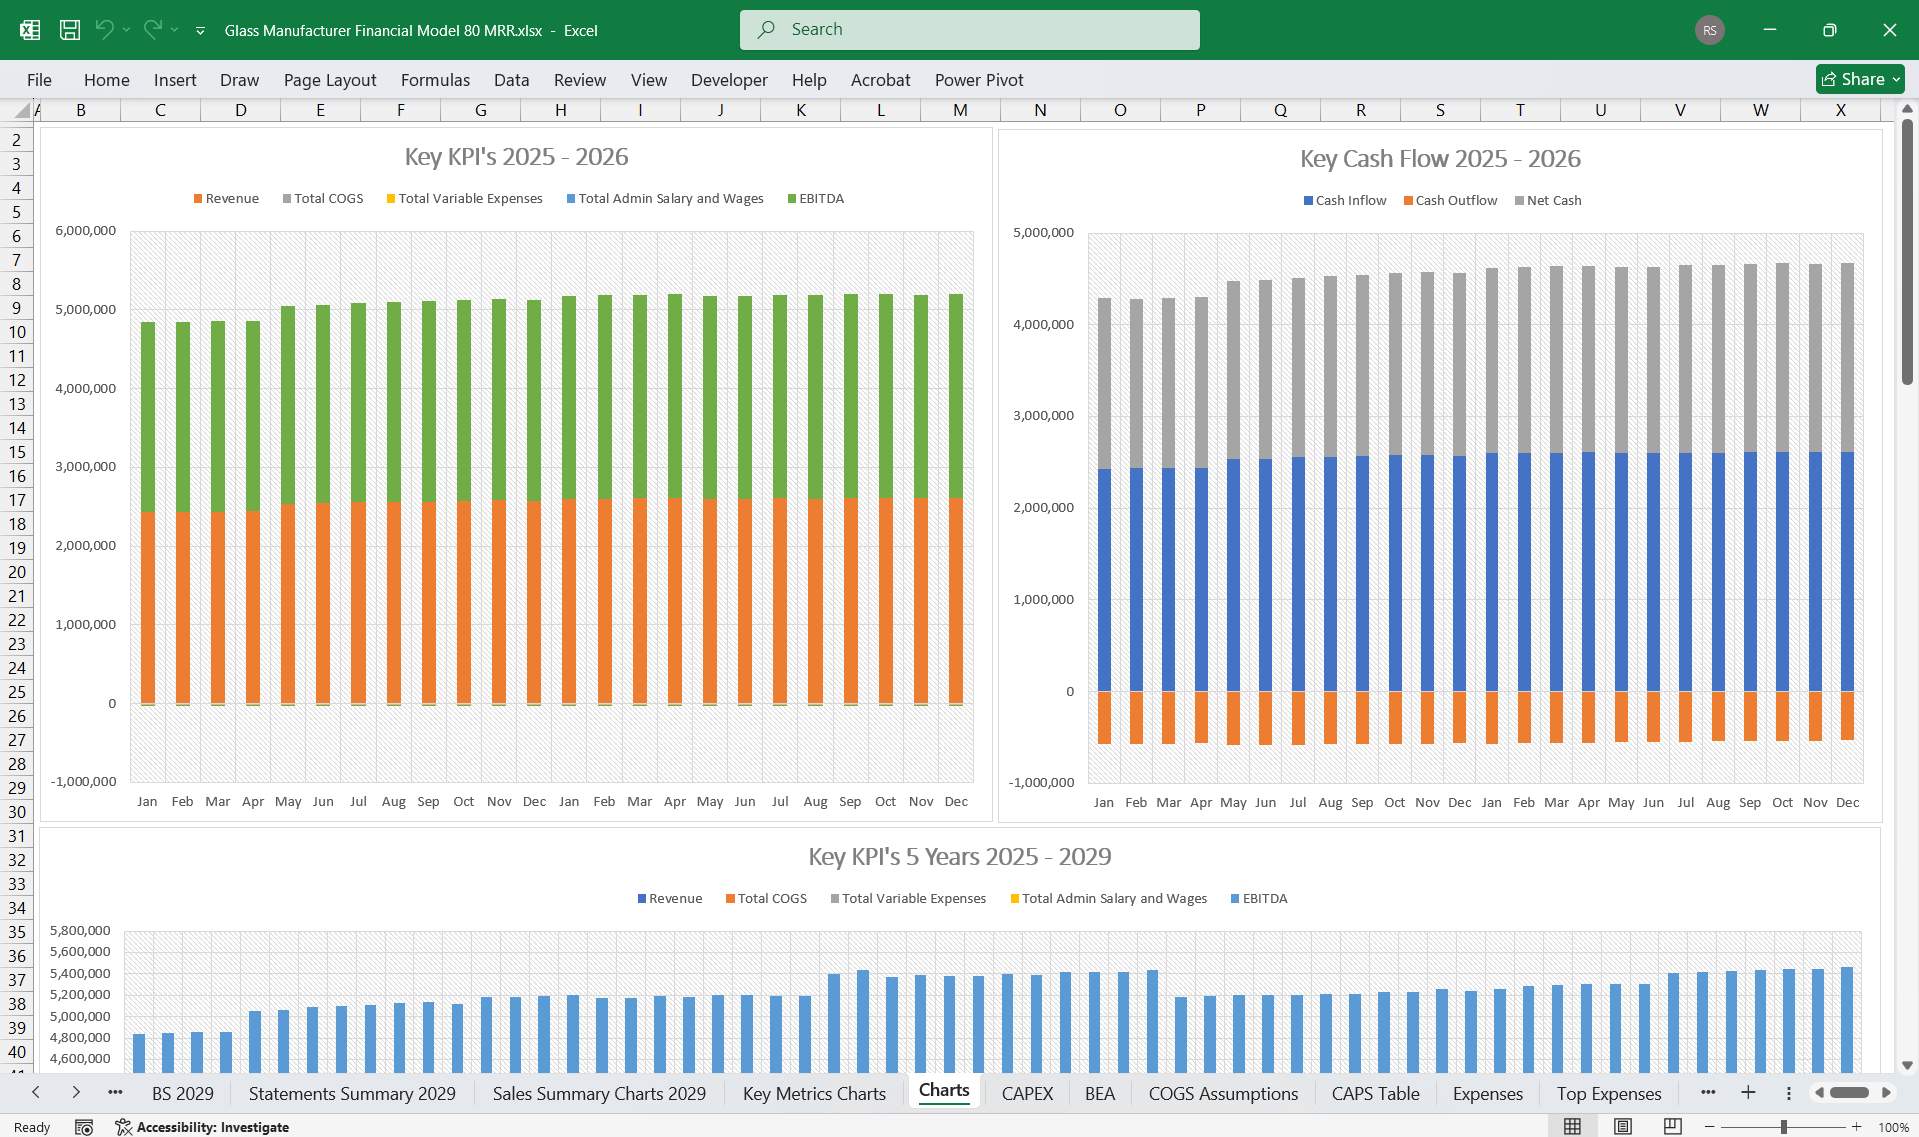
- Operating Cash Flow: $14M (Revenue - COGS - OPEX).
- Investing Cash Flow: $(5M) (CAPEX).
- Financing Cash Flow: $(2M) (Loan repayments).
- Net Cash Flow: $7M.
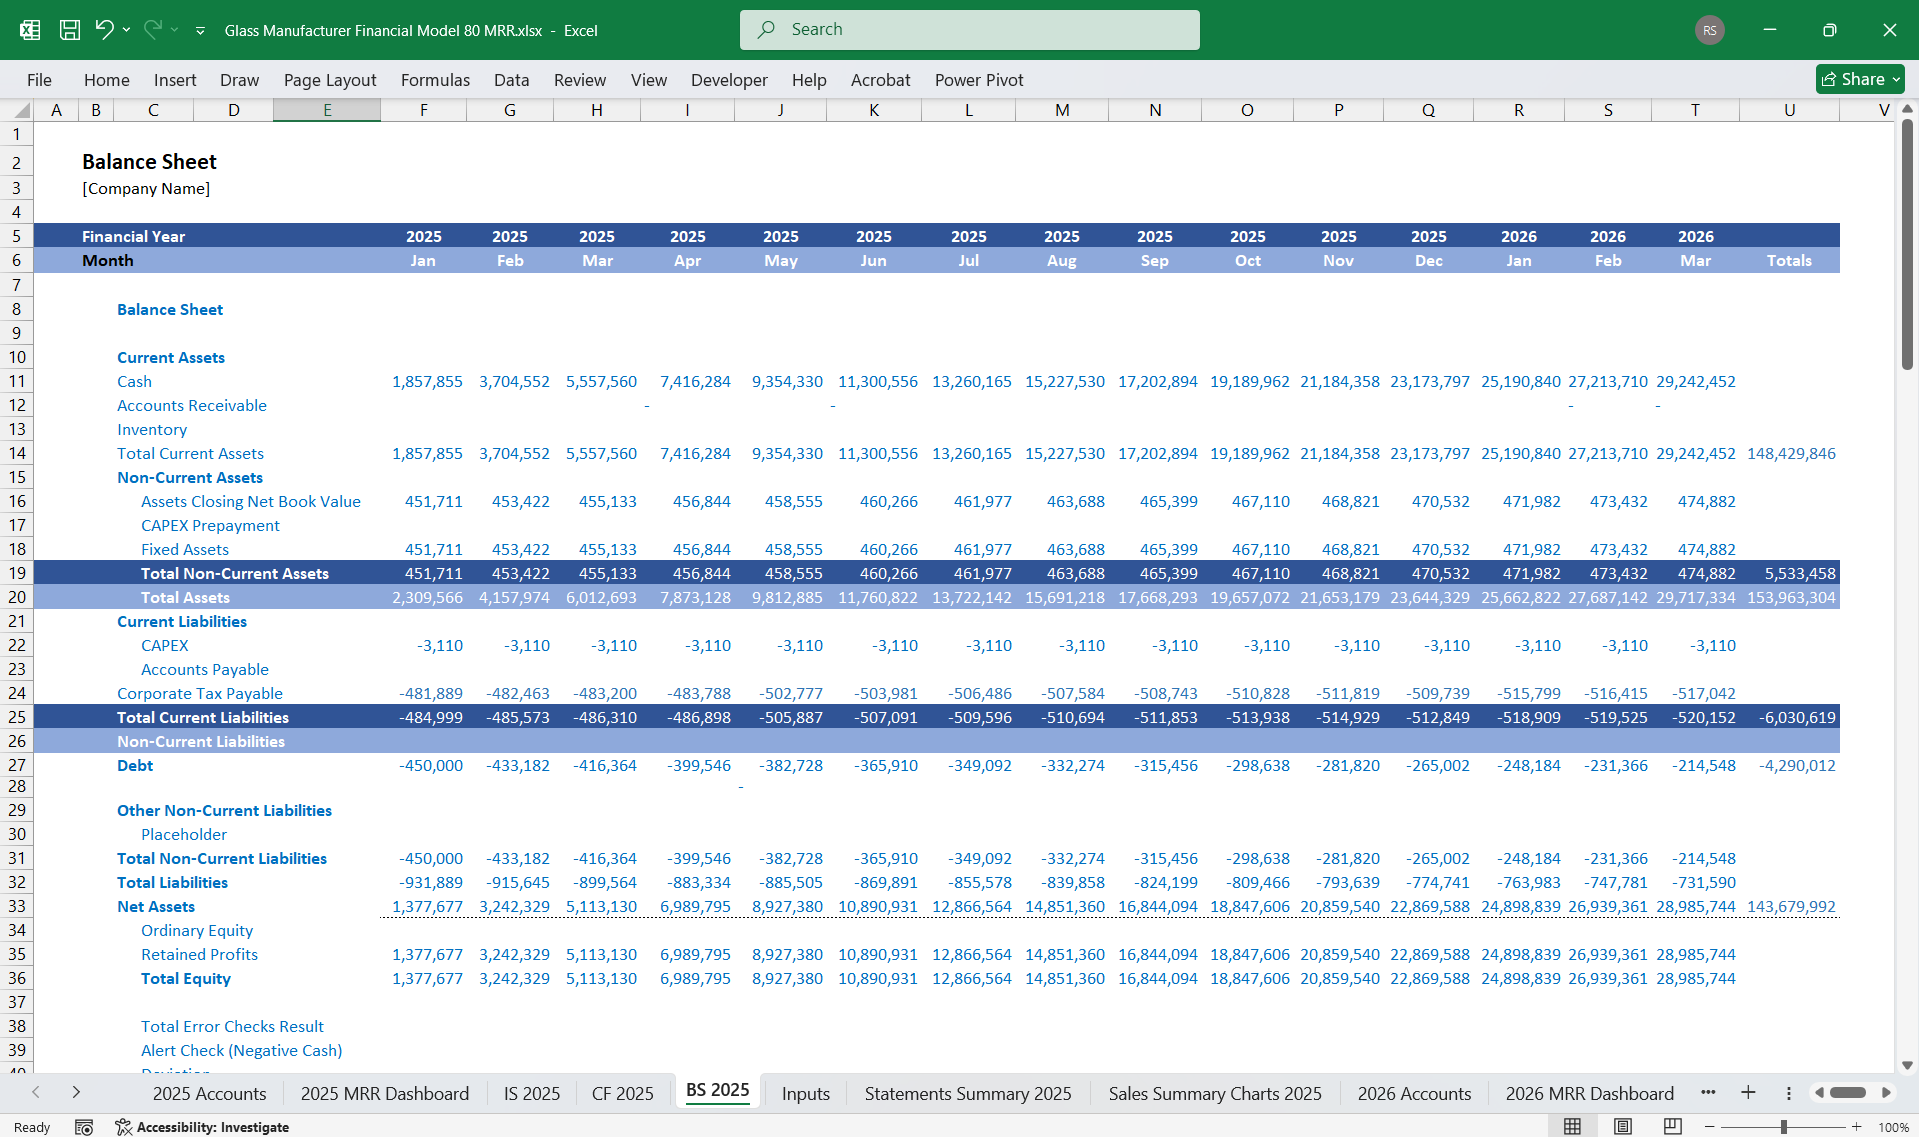
- Current Assets:
- Cash: Liquidity to cover short-term obligations.
- Accounts Receivable: Net 60 terms for customers.
- Inventory: Stockpile of raw materials and finished goods.
- Non-Current Assets:
- Glass manufacturing furnaces, robotics for precision production.
- Patents/IP for speciality glass and software platforms.
- Current Liabilities:
- Payables to suppliers (Net 30 terms).
- Accrued employee costs.
- Long-Term Liabilities:
- Loans or leases for factory and equipment expansion.
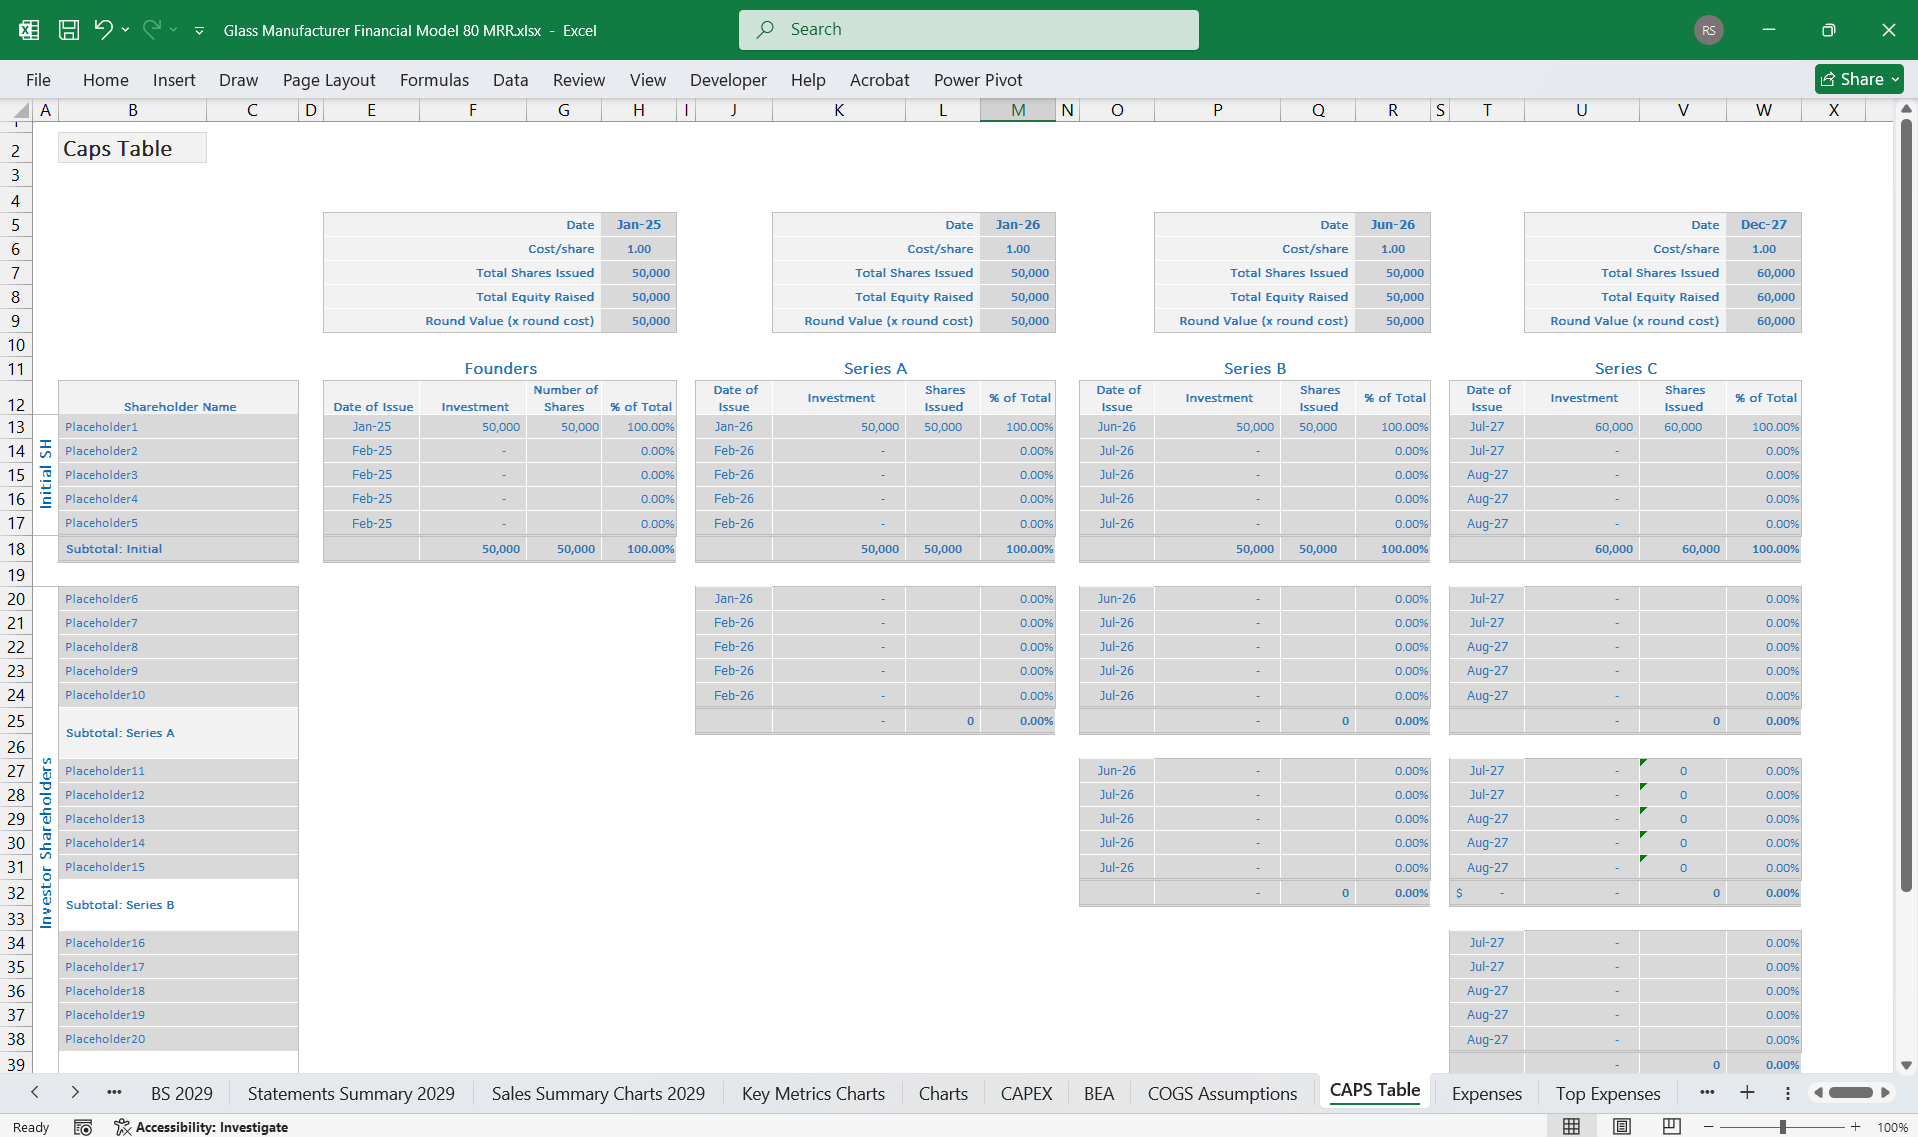
- Paid-up Capital from shareholders.
- Retained Earnings reinvested from prior profits.
- 80 Product Lines: Diversification into advanced and niche glass applications with higher marketing and logistics costs.
Tier Breakdown
- Free Tier:
- Limited access to guides on installation, cleaning, and basic safety tips.
- Standard
- Monitoring of glass durability and recommendations for replacements.
- Professional
- Enhanced data analytics (e.g., thermal efficiency reports).
- Enterprise Basic
- Real-time inventory tracking and supply chain updates.
- Enterprise Pro
- Full software integration for workflow automation.
- Premium Enterprise
- Customized solutions, predictive wear analytics, and on-call consulting.
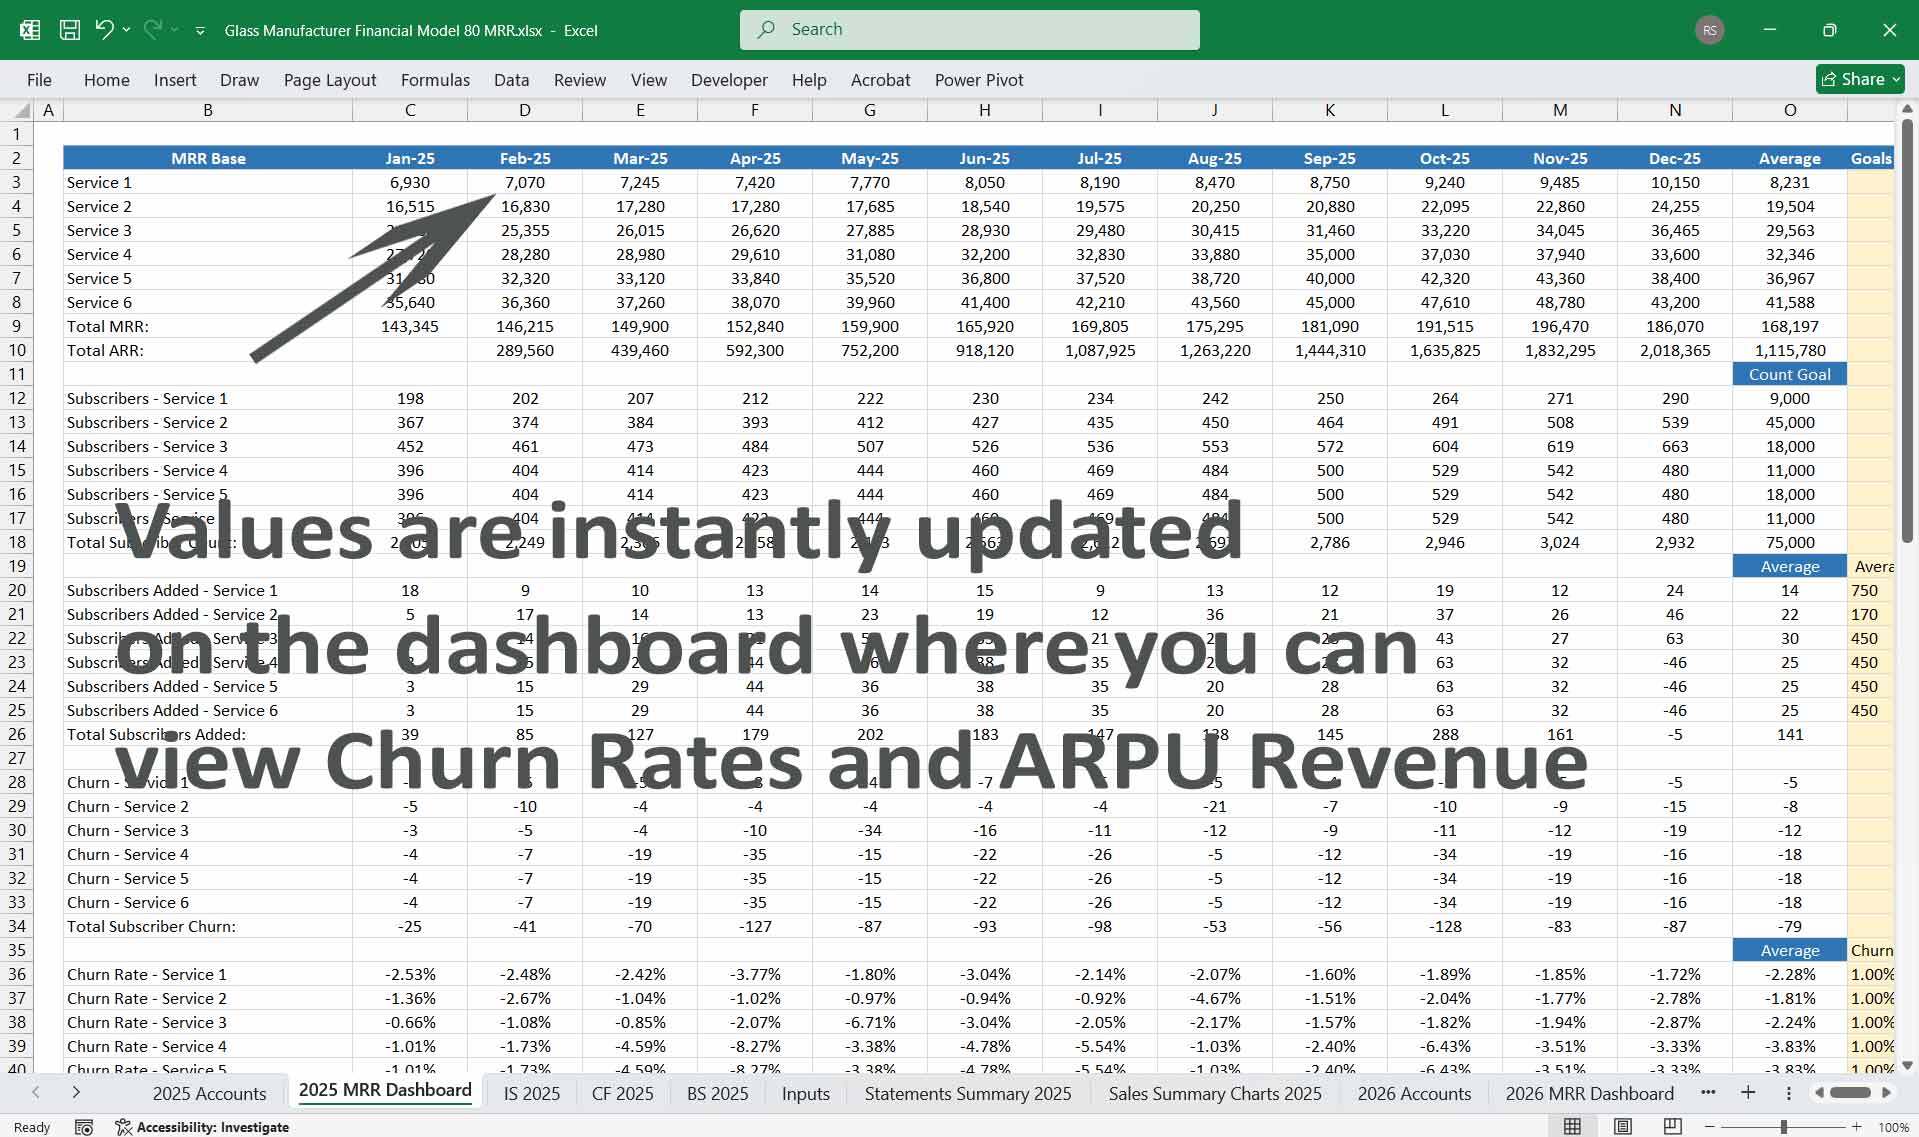
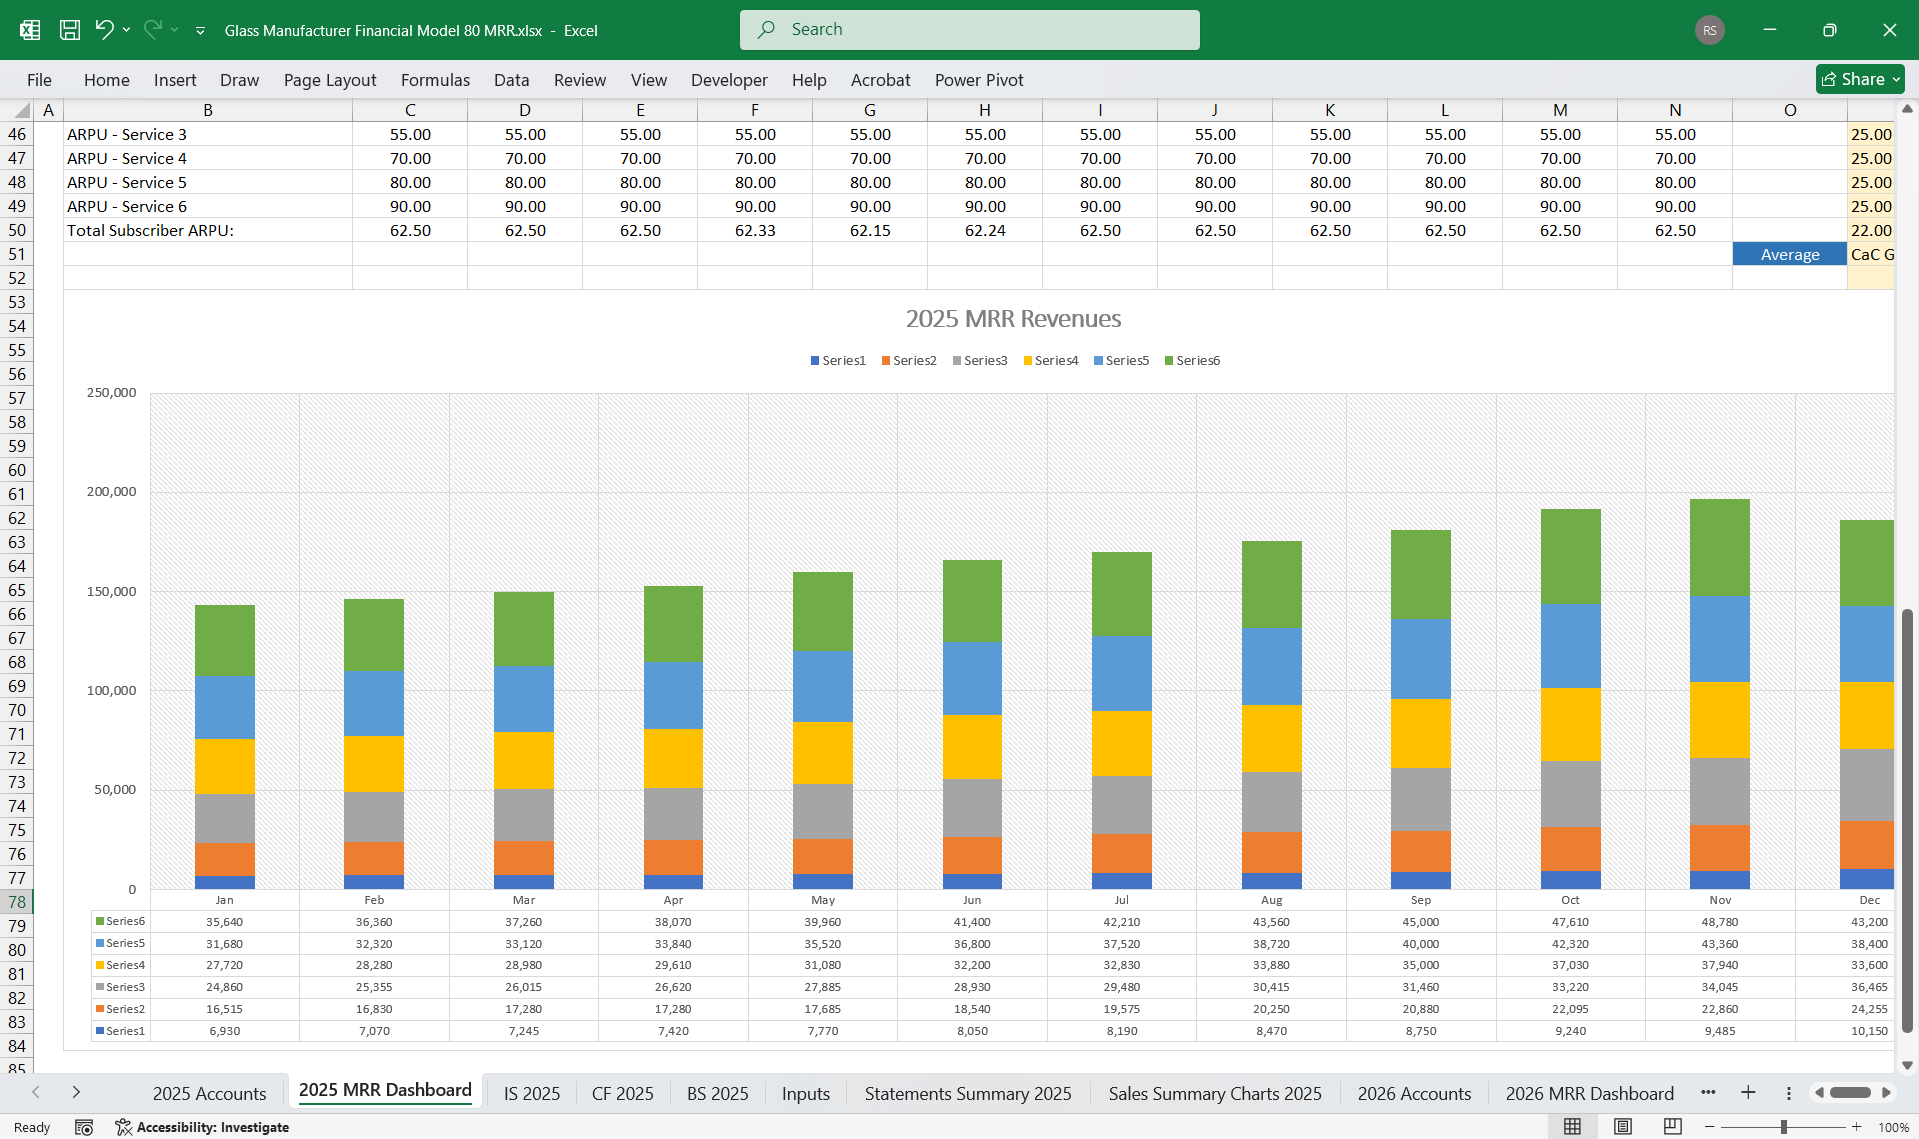
- Subscriber Base:
- Year 1: 15,000 subscribers; Year 2: 25,000 subscribers.
- Annual Growth: 40%.
- Average Revenue Per User (ARPU): $35/month.
- Annual Subscription Revenue (Year 1): $6.3M.
- Contribution to Total Revenue by Year 3: 20%.
- Profitability Comparison:
- Higher net margins for 80 product lines (~8%).
- Scalability increases revenue and production costs with 80 lines.
- Recurring Revenue:
- The subscription model stabilizes cash flow, improving working capital.
- Drives customer loyalty, reducing churn rates (forecast:
This Best Practice includes
1 Excel Financial Model
Further information
Provides thorough oversight, tracking, and reporting a Glass Manufacturer's finances, including updates on budget utilisation and projections.
