
Last version published: 24/05/2023 08:58
Publication number: ELQ-89728-10
View all versions & Certificate
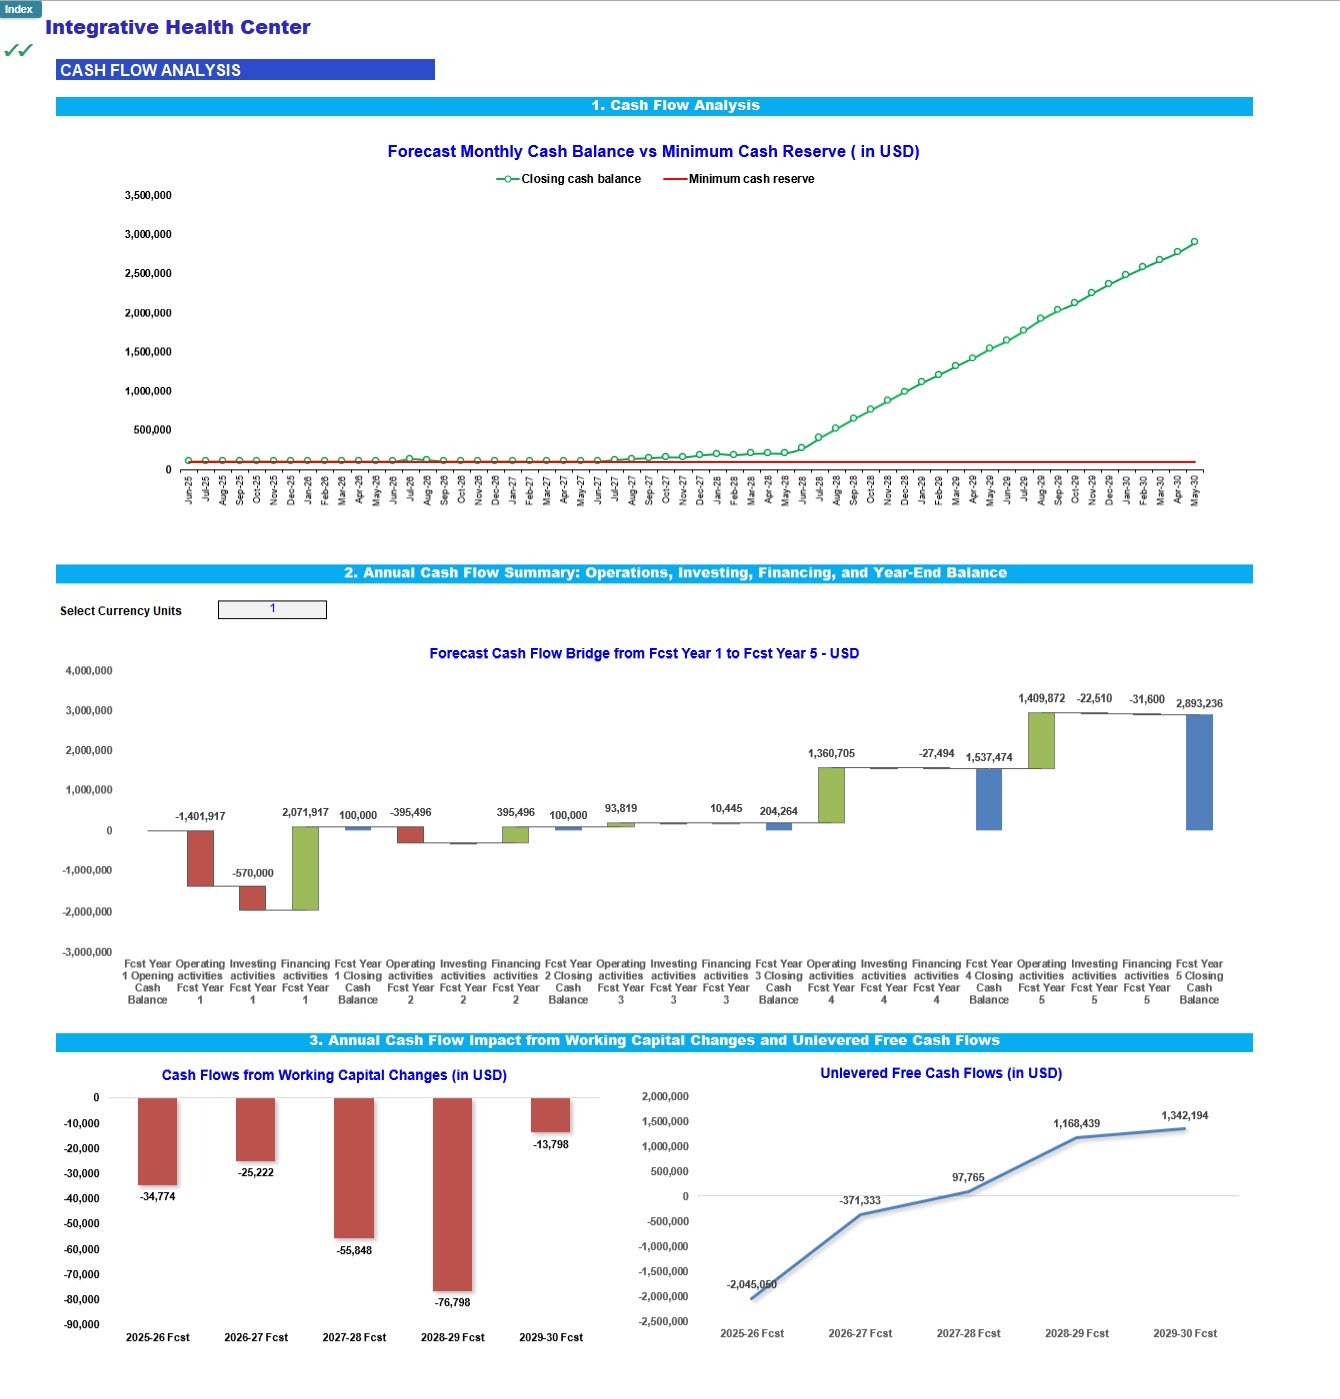
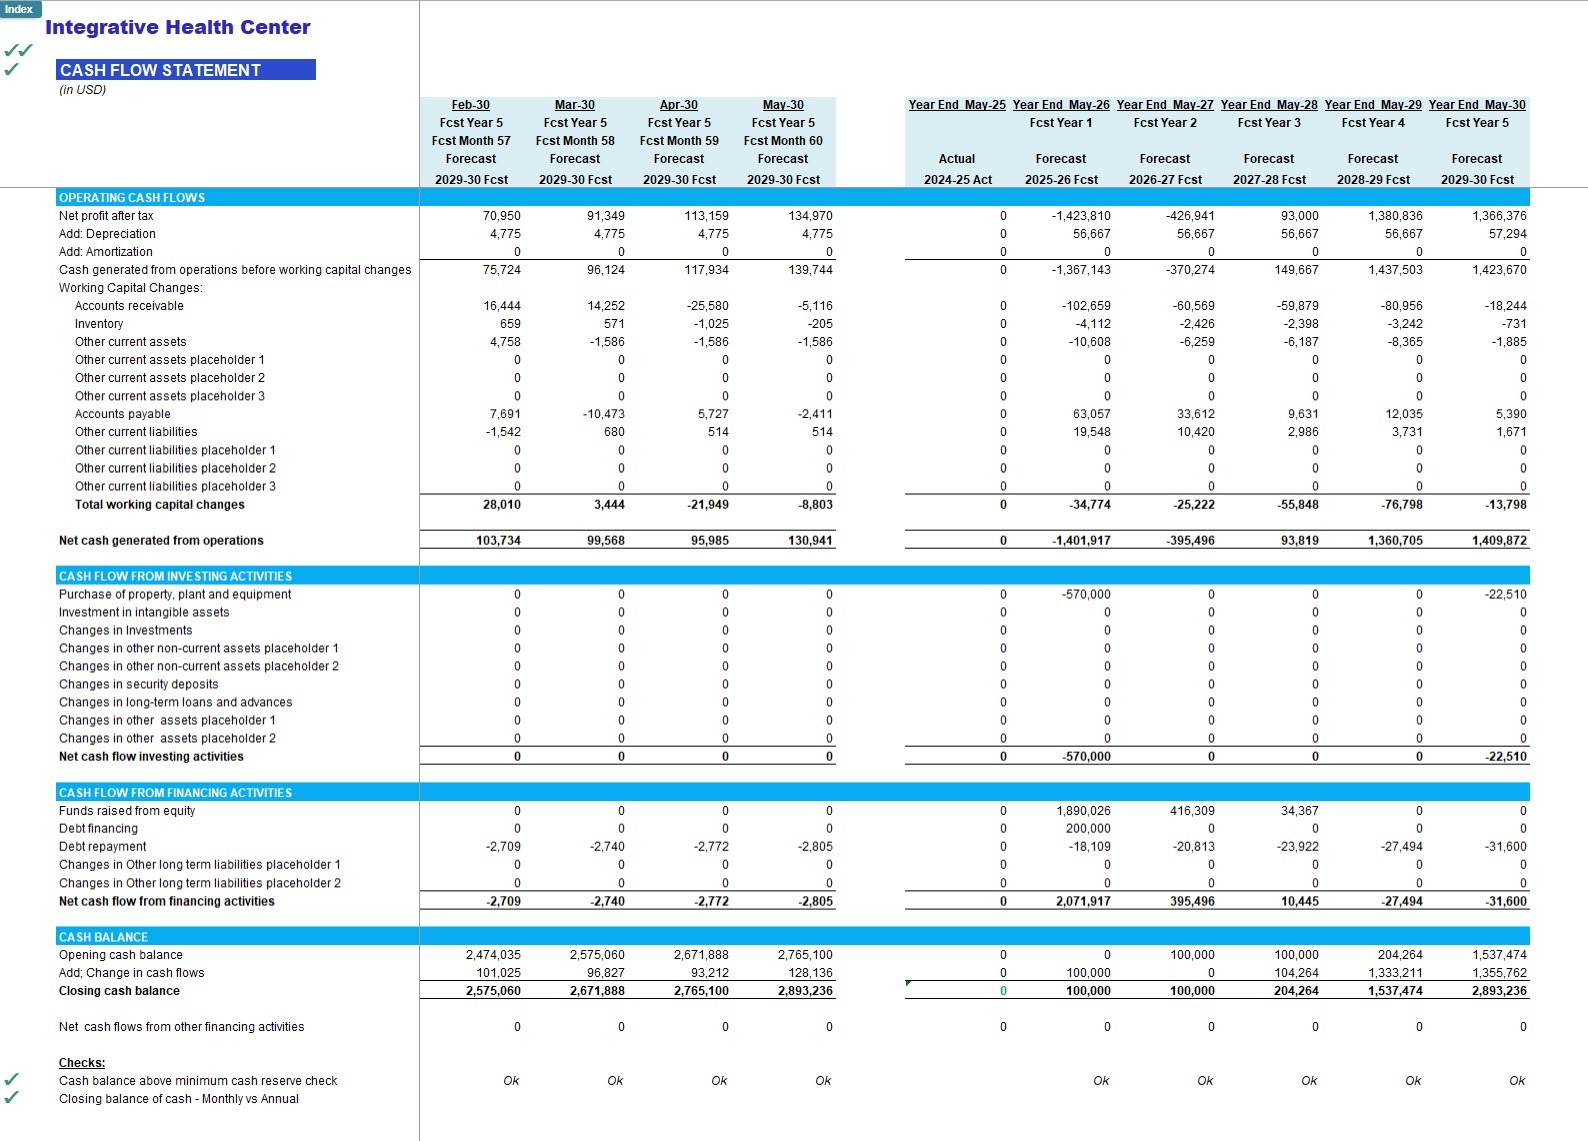
Healthcare Chain Financial Projections Excel Model Template
The financial model is for a business that started Men’s Physical and Mental Healthspan Optimization Clinics.

Financial Modeler | Financial Analyst | Start-ups | Real Estate | Merger & AcquisitionsFollow 103
Description
This financial model is for a business based in Australia that started Men’s Physical and Mental Healthspan Optimization Clinics. These clinics are to cater to people who are aged over 40 years and want to maintain optimal health and performance by using their discretionary income on themselves. The business model was created to address on the following 4 things – Optimal Diet, Optimal Exercise, Optimal Micro-nutrient supplements and optimal hormone restoration.
This financial model provides a comprehensive analysis of the clinic's financial performance by projecting revenue, cost of goods sold (COGS), operating expenses, and presenting key financial statements such as the projected income statement, balance sheet, and cash flow statement. Additionally, the model includes a cap table, a dashboard with graphs, and a summary section to provide a holistic view of the clinic's financial health.
Revenue Projections: The revenue projections in the model outline the expected income generated by the clinic over a specified period. These projections are based on various factors such as the number of patients, pricing structures, service offerings, and types of product sold. By incorporating growth rates and seasonality patterns, the model provides a clear picture of the clinic's revenue potential.
COGS Projections: The cost of goods sold projections estimate the direct costs associated with providing healthcare services in the clinic. This includes expenses related to medical supplies, cost of doctors and nurses helping in consultation. This helps in accurately forecasting COGS is crucial for determining gross profit margins and evaluating the clinic's operational efficiency.
Operating Expenses Projections: The model also takes into account the various operating expenses that the clinic will incur. These expenses encompass administrative costs, employee salaries, marketing expenses, office rent, clinics' rent utilities, insurance, and other overhead expenses. By forecasting these costs, the model enables a comprehensive analysis of the clinic's profitability and helps in identifying areas for cost optimization.
Projected Income Statement: The projected income statement provides a summary of the clinic's expected revenues, COGS, and operating expenses. It calculates the gross profit, operating profit, and net profit, allowing stakeholders to evaluate the financial viability of the clinic. By analyzing the income statement, one can assess the clinic's ability to generate profits and make informed business decisions.
Balance Sheet: The balance sheet section of the financial model presents a snapshot of the clinic's financial position at a given point in time. It includes the clinic's assets, liabilities, and shareholders' equity. The balance sheet is crucial for understanding the clinic's liquidity, solvency, and overall financial stability.
Cash Flow Statement: The cash flow statement provides an overview of the clinic's cash inflows and outflows during a specified period. It tracks the clinic's operating activities, investing activities, and financing activities. By examining the cash flow statement, stakeholders can assess the clinic's ability to generate and manage cash, ensuring its operational continuity.
Cap Table: The cap table section outlines the ownership structure of the clinic, including the equity ownership stakes of various investors and shareholders. It provides transparency on the distribution of ownership and allows for analysis of potential dilution or changes in ownership structure after funds raise in different financing rounds.
Dashboard, Graphs, and Summary: The financial model incorporates a dashboard that visually represents key financial metrics and performance indicators. Graphs and charts help visualize trends, growth rates, and financial ratios. The summary section provides an executive overview of the clinic's financial performance, highlighting the key findings and insights derived from the financial model.
In conclusion, the Health Optimization Clinic financial model offers a comprehensive analysis of the clinic's financial performance. By providing revenue projections, COGS projections, operating expenses projections, and presenting key financial statements, the model enables stakeholders to make informed decisions and assess the clinic's financial health effectively. The cap table, dashboard, graphs, and summary sections further enhance the model's usability and provide a holistic view of the clinic's financial position.
The instructions are contained in the first tab of the model.
The model can also be customized as per your requirements.
This Best Practice includes
1 Excel Spreadsheet
Further information
To create financial model for a business providing healthcare services
Creating pro-forma for a business in healthcare for your want to create cash flow and profitability analysis
If you are unable to customize it by yourself and the model requires a lot of customization. However, still you can use a lot of information from it.