


BNPL Platform Financial Model | Vintage Credit Losses, Warehouse & ABS Funding, Unit Economics and Valuation
Originally published: 31/08/2026 08:19
Publication number: ELQ-49753-1
View all versions & Certificate
certified

BNPL Platform Financial Model | Vintage Credit Losses, Warehouse & ABS Funding, Unit Economics and Valuation

Model BNPL GMV, vintage losses, warehouse and ABS funding, LTV/CAC, capital adequacy, profitability, scenarios, and seven-year value.

Description
๐Ÿ’ณ BNPL PLATFORM FINANCIAL MODEL โ€” CREDIT VINTAGES, FUNDING, UNIT ECONOMICS & VALUATIONBuy Now Pay Later is not simply a payment product or a consumer-loan book. A BNPL platform combines merchant-acquiring economics, unsecured credit risk, customer acquisition, servicing infrastructure, regulatory exposure, and capital-markets funding. Rapid GMV growth can appear attractive while delayed credit losses, funding requirements, and equity capital consumption weaken cash flow.

This premium Excel model brings those drivers together in one integrated framework. It converts transaction growth, orders, customer acquisition, merchant pricing, consumer interest, late fees, credit-loss emergence, recoveries, receivables, warehouse and ABS funding, operating expenses, and capital requirements into a seven-year P&L, unit economics, cash flow, NPV, enterprise value, and project IRR.

The workbook is designed for BNPL founders, fintech operators, credit-risk teams, investors, lenders, securitization professionals, consultants, and corporate-development analysts evaluating a platform launch, growth plan, funding strategy, portfolio performance, or investment opportunity.

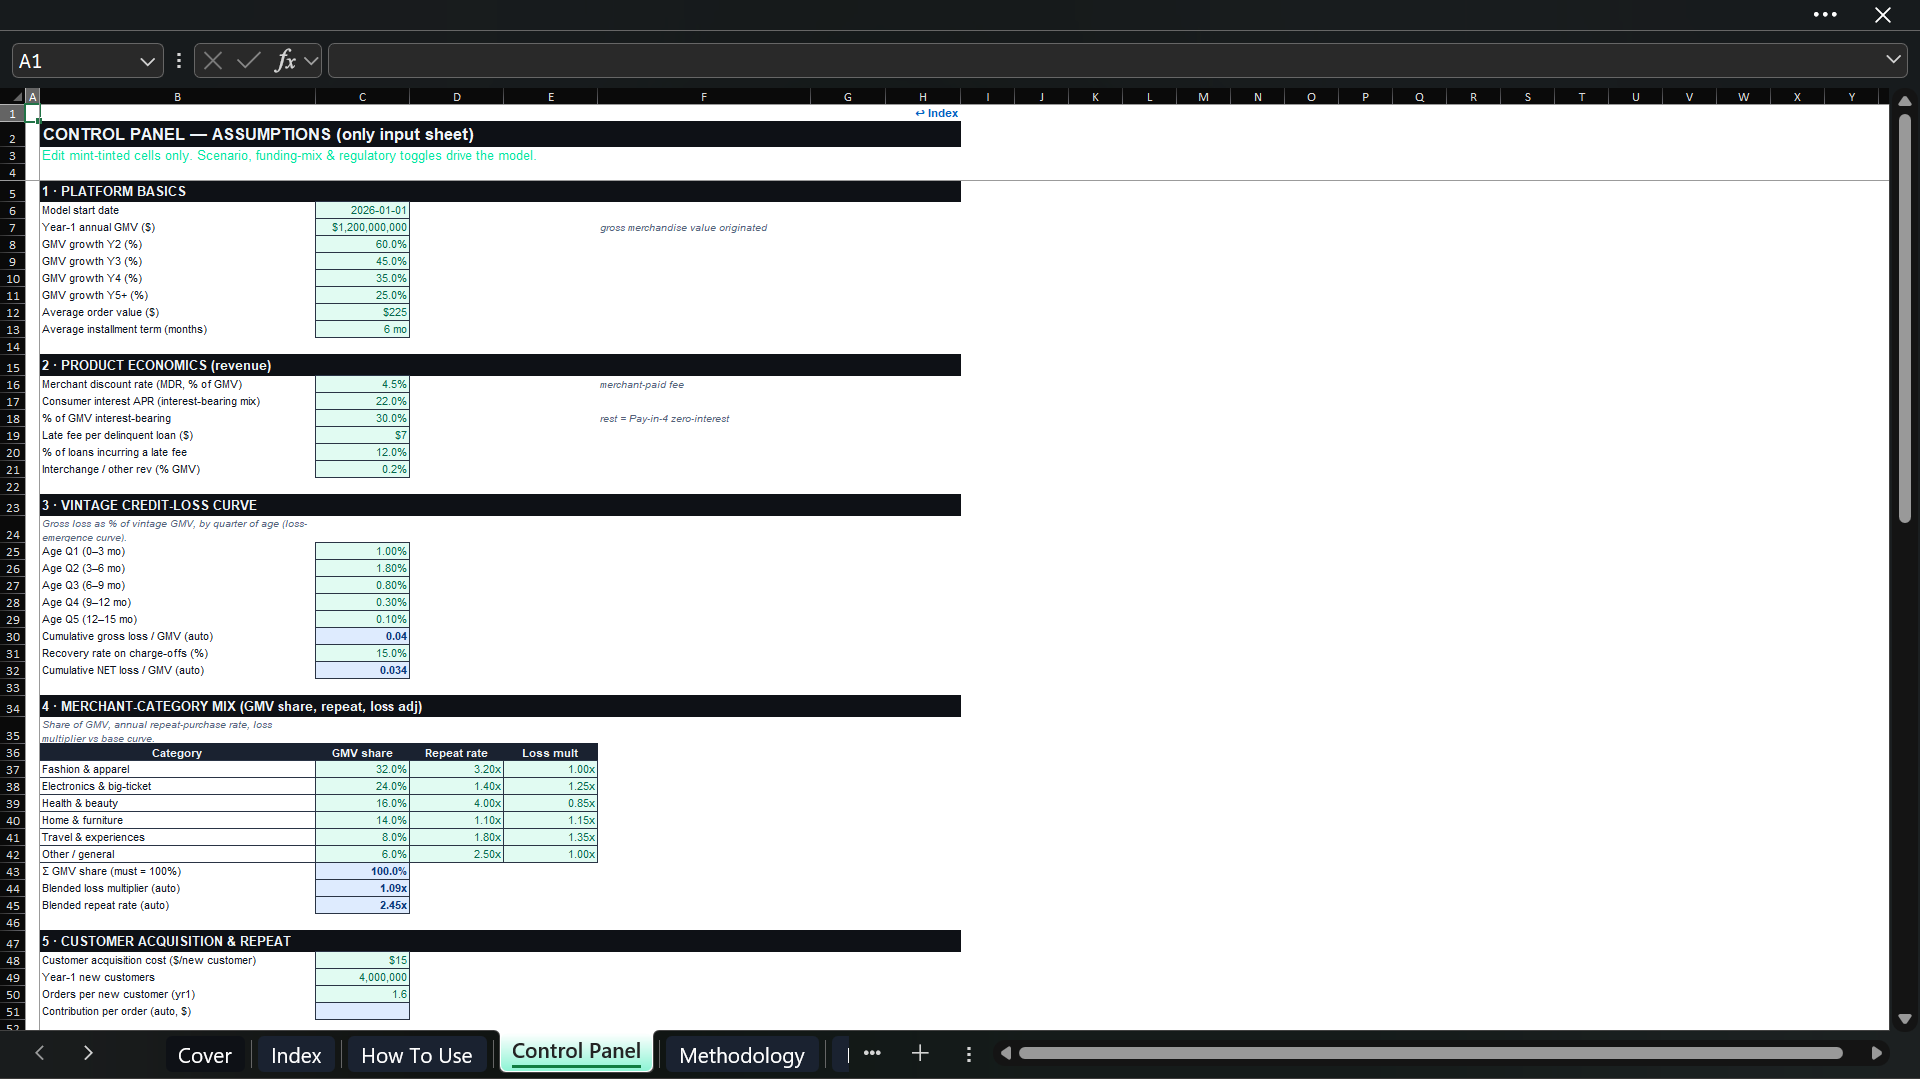
โš™๏ธ CENTRALIZED CONTROL PANEL
All editable assumptions are organized on one Control Panel. Mint-tinted cells distinguish inputs from formulas, and every linked schedule updates automatically. The Control Panel covers:
  • Platform basics: start date, Year 1 GMV, annual growth, average order value, and installment term.
  • Product economics: merchant discount rate, consumer APR, interest-bearing share, late fees, late-fee incidence, and interchange or other revenue.
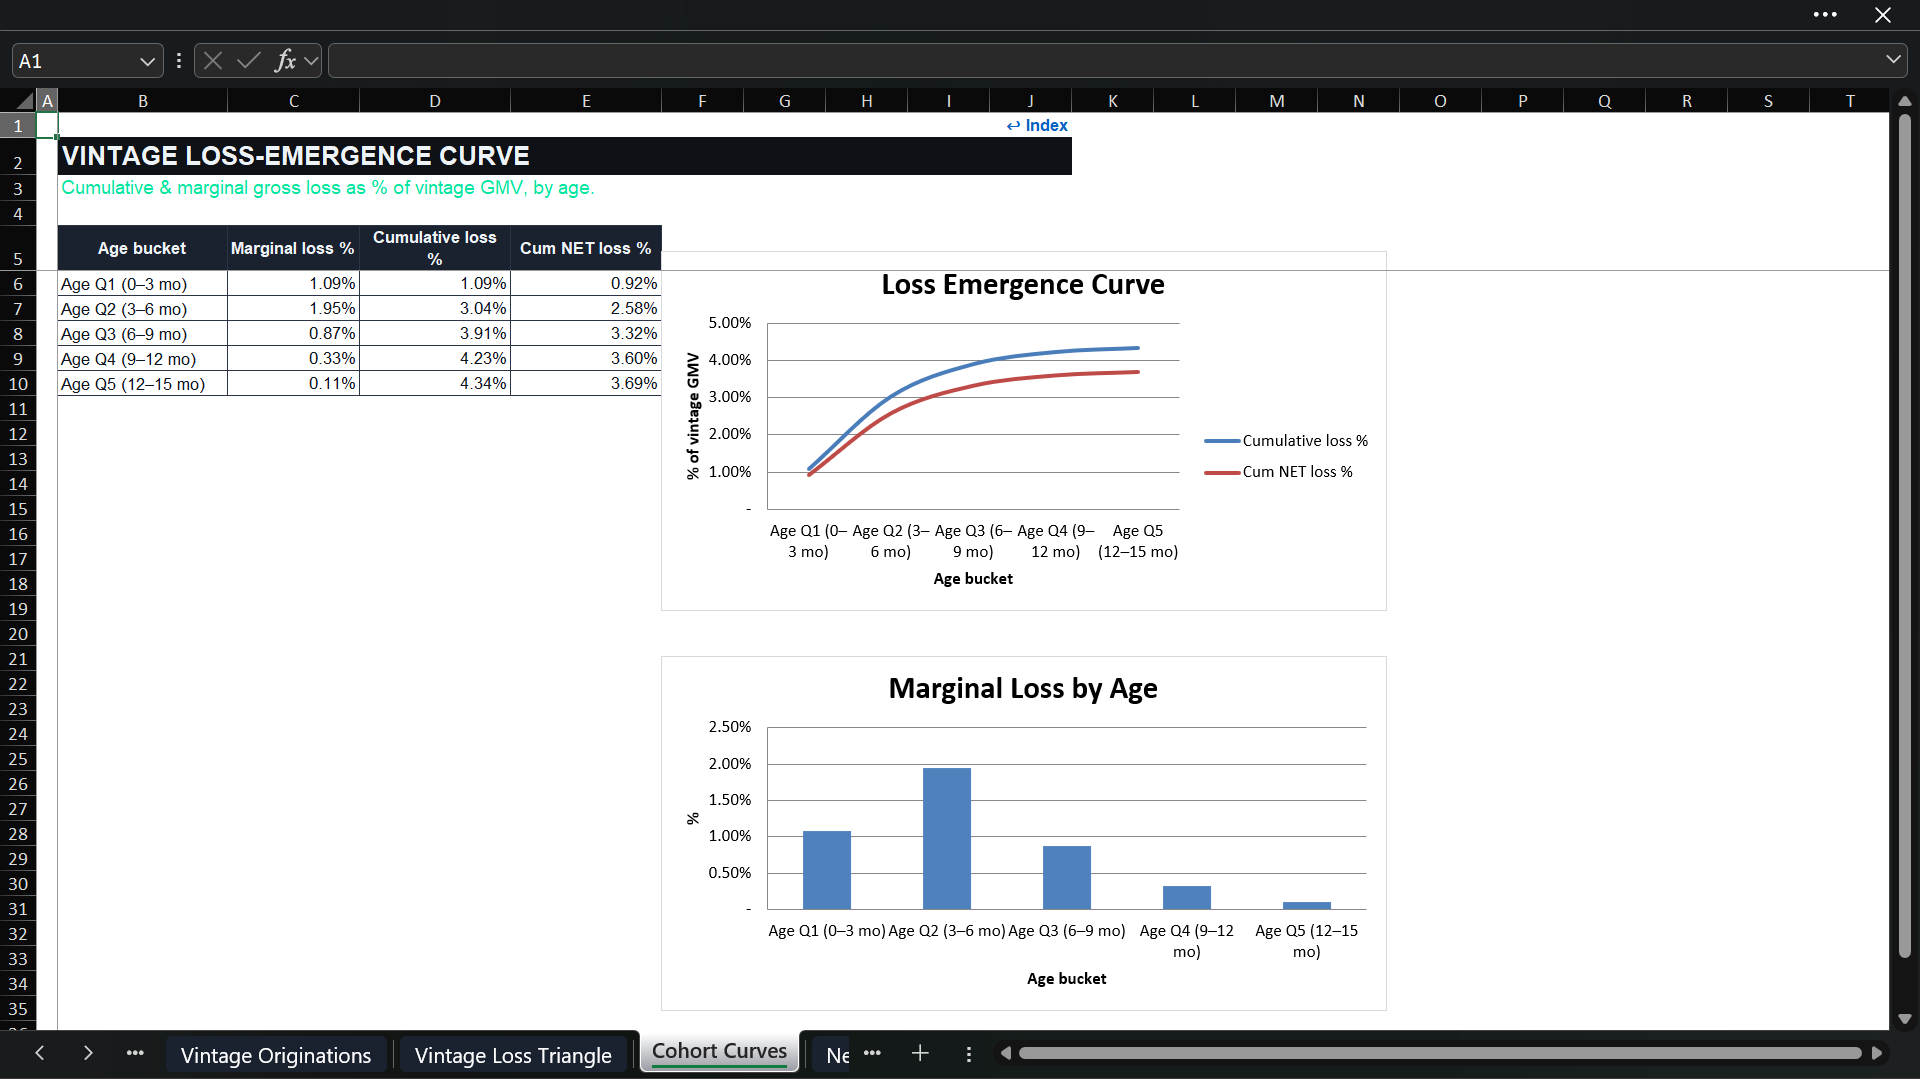
  • Credit losses: five quarterly age buckets for the gross loss-emergence curve, recovery rate, and automatically calculated cumulative gross and net loss rates.
  • Merchant mix: six categories with GMV share, repeat-purchase frequency, and loss multipliers.
  • Customer acquisition: CAC, Year 1 new customers, and first-year orders per new customer.
  • Funding structure: warehouse, ABS, or blended funding; advance rates; funding costs; issuance and undrawn fees; securitized share; receivables intensity; and first-loss capital.
  • Regulation: switchable late-fee cap and editable regulatory cap.
  • Operating costs: processing, servicing, technology, G&A, and fraud.
  • Capital: receivables risk weight, minimum total capital, CET1 threshold, and operational-risk add-on.
  • Valuation: WACC, tax rate, exit EV/revenue multiple, and scenario selection.

๐Ÿ“ˆ GMV, ORDERS & CUSTOMER BUILD
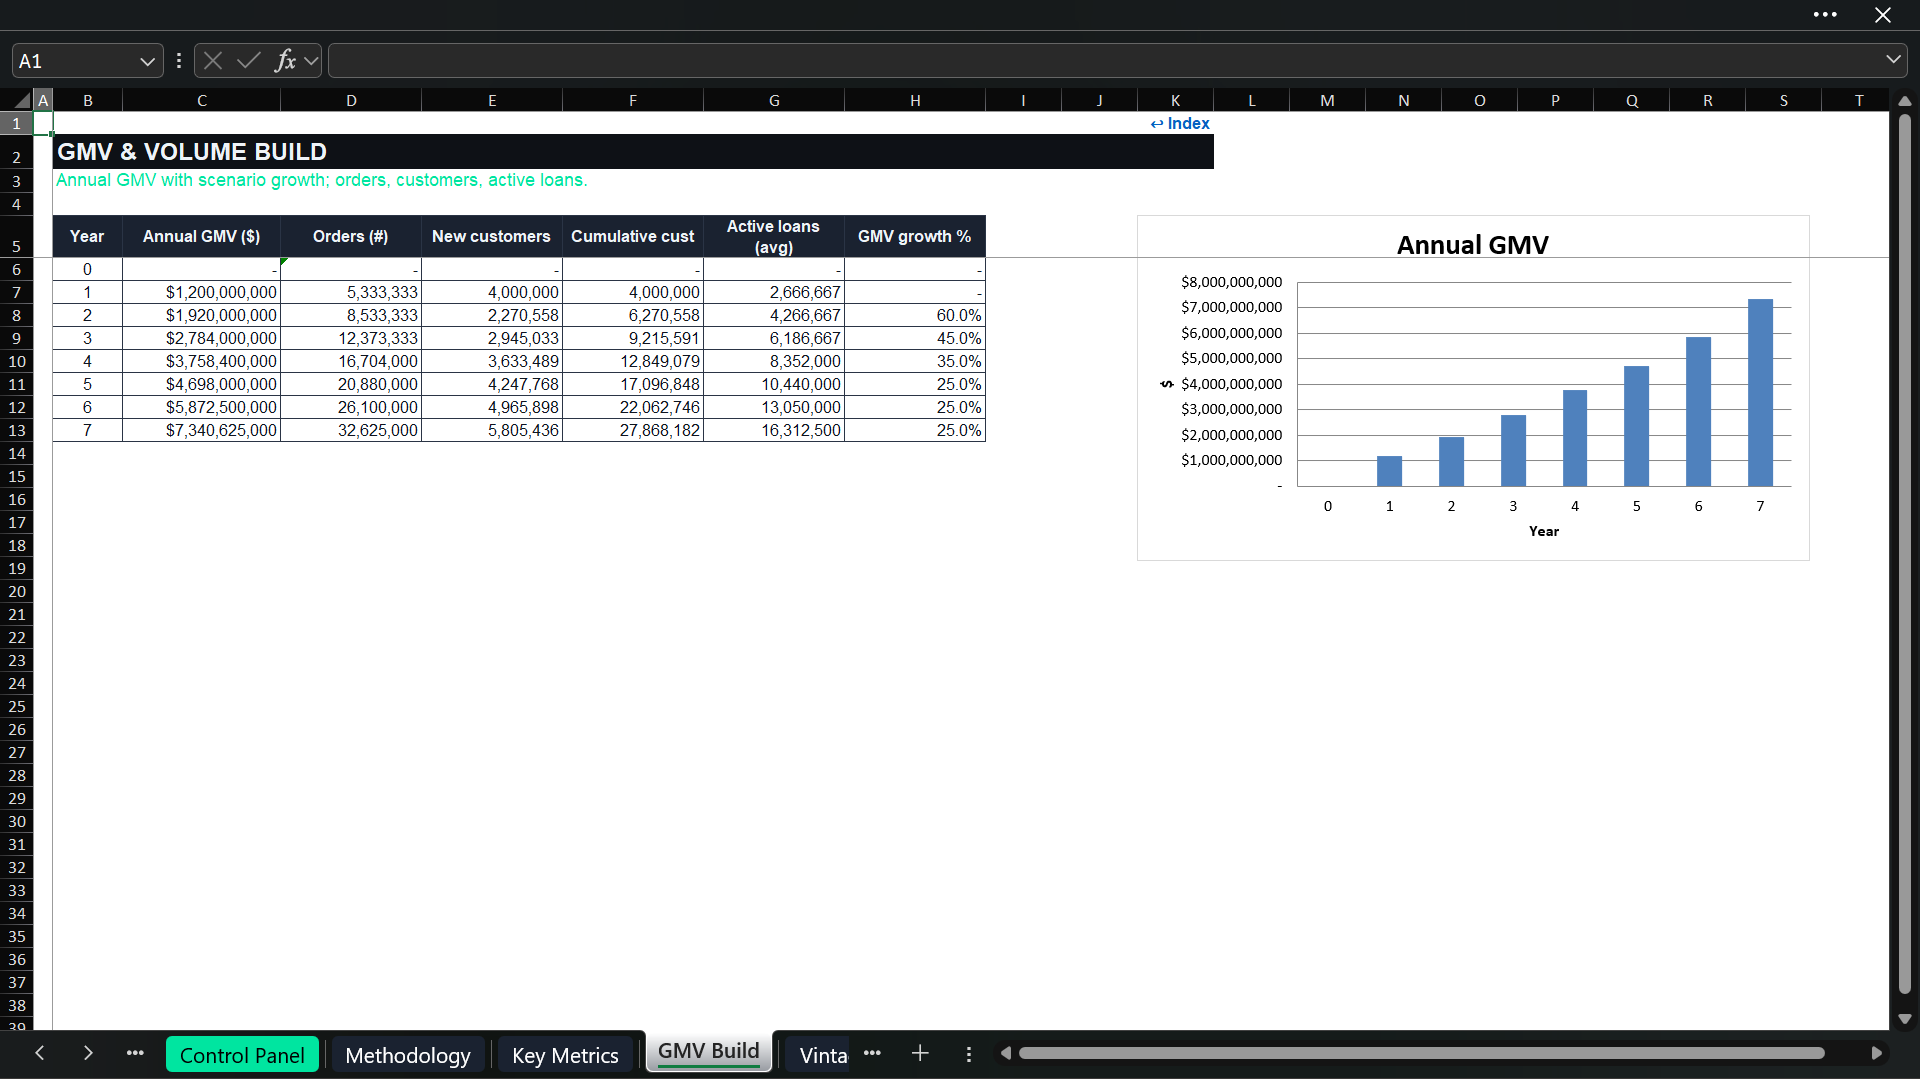
The model begins with annual GMV and scenario-adjusted growth. Average order value converts GMV into financed orders, while new customers, cumulative customers, and average active loans provide volume and acquisition context. The seven-year build creates the transaction base that drives revenue, receivables, operating costs, customer acquisition, and funding needs.

๐Ÿงฉ MERCHANT-CATEGORY PORTFOLIO MIX
Six editable categories are included: fashion and apparel, electronics and big-ticket purchases, health and beauty, home and furniture, travel and experiences, and other or general retail. Each category has its own GMV share, repeat-purchase rate, and credit-loss multiplier.
The model calculates blended repeat frequency and credit-risk intensity, so portfolio-mix changes flow into customer value and losses.

๐Ÿ“‰ 28-QUARTER VINTAGE LOSS TRIANGLE
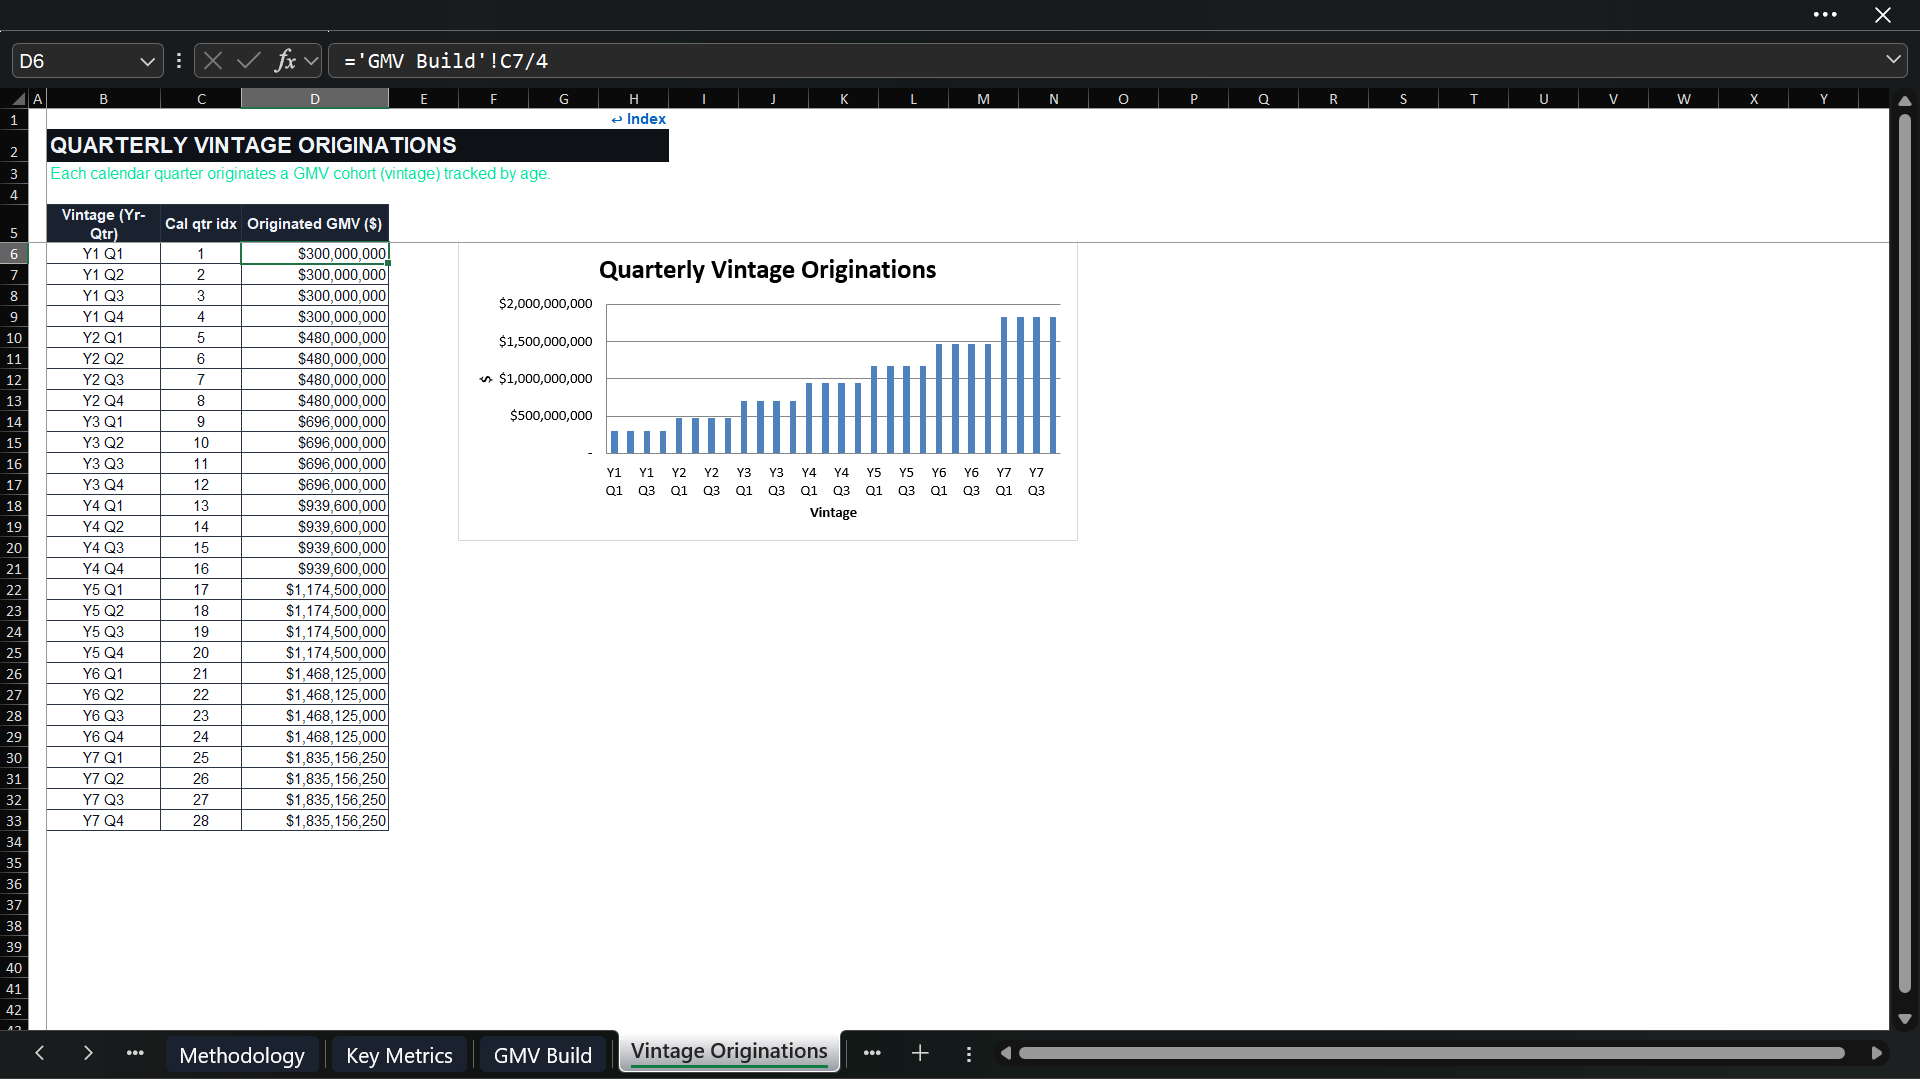
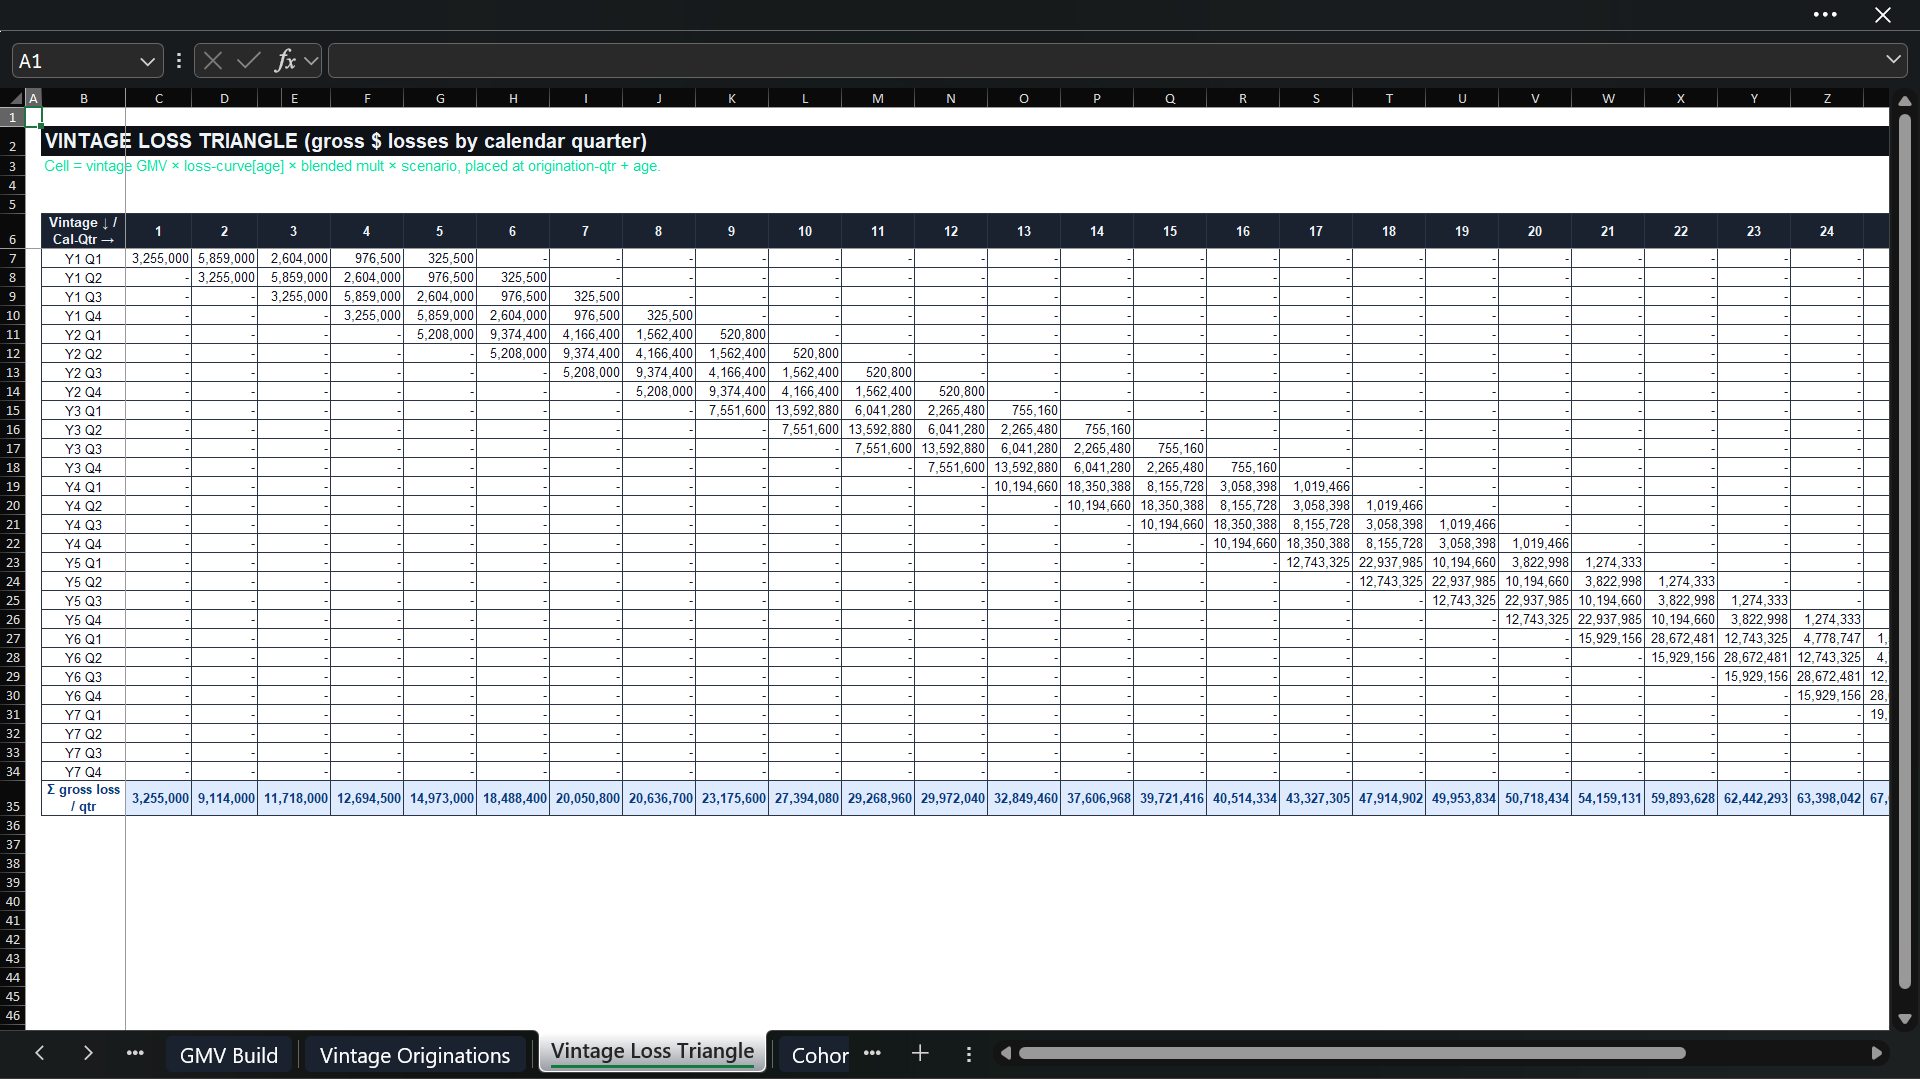
The vintage engine is the analytical core of the workbook. Annual GMV is divided into 28 quarterly origination cohorts across the seven-year forecast. Each vintage is exposed to a five-quarter marginal loss curve covering 0โ€“3, 3โ€“6, 6โ€“9, 9โ€“12, and 12โ€“15 months after origination.
The 28 ร— 28 loss triangle places each vintageโ€™s emerging losses in the correct calendar quarter. Summing down each calendar column produces the periodโ€™s gross credit losses, avoiding the misleading assumption that all losses occur in the year of origination. A separate cohort-curve schedule presents marginal gross loss, cumulative gross loss, and cumulative net loss after recoveries.
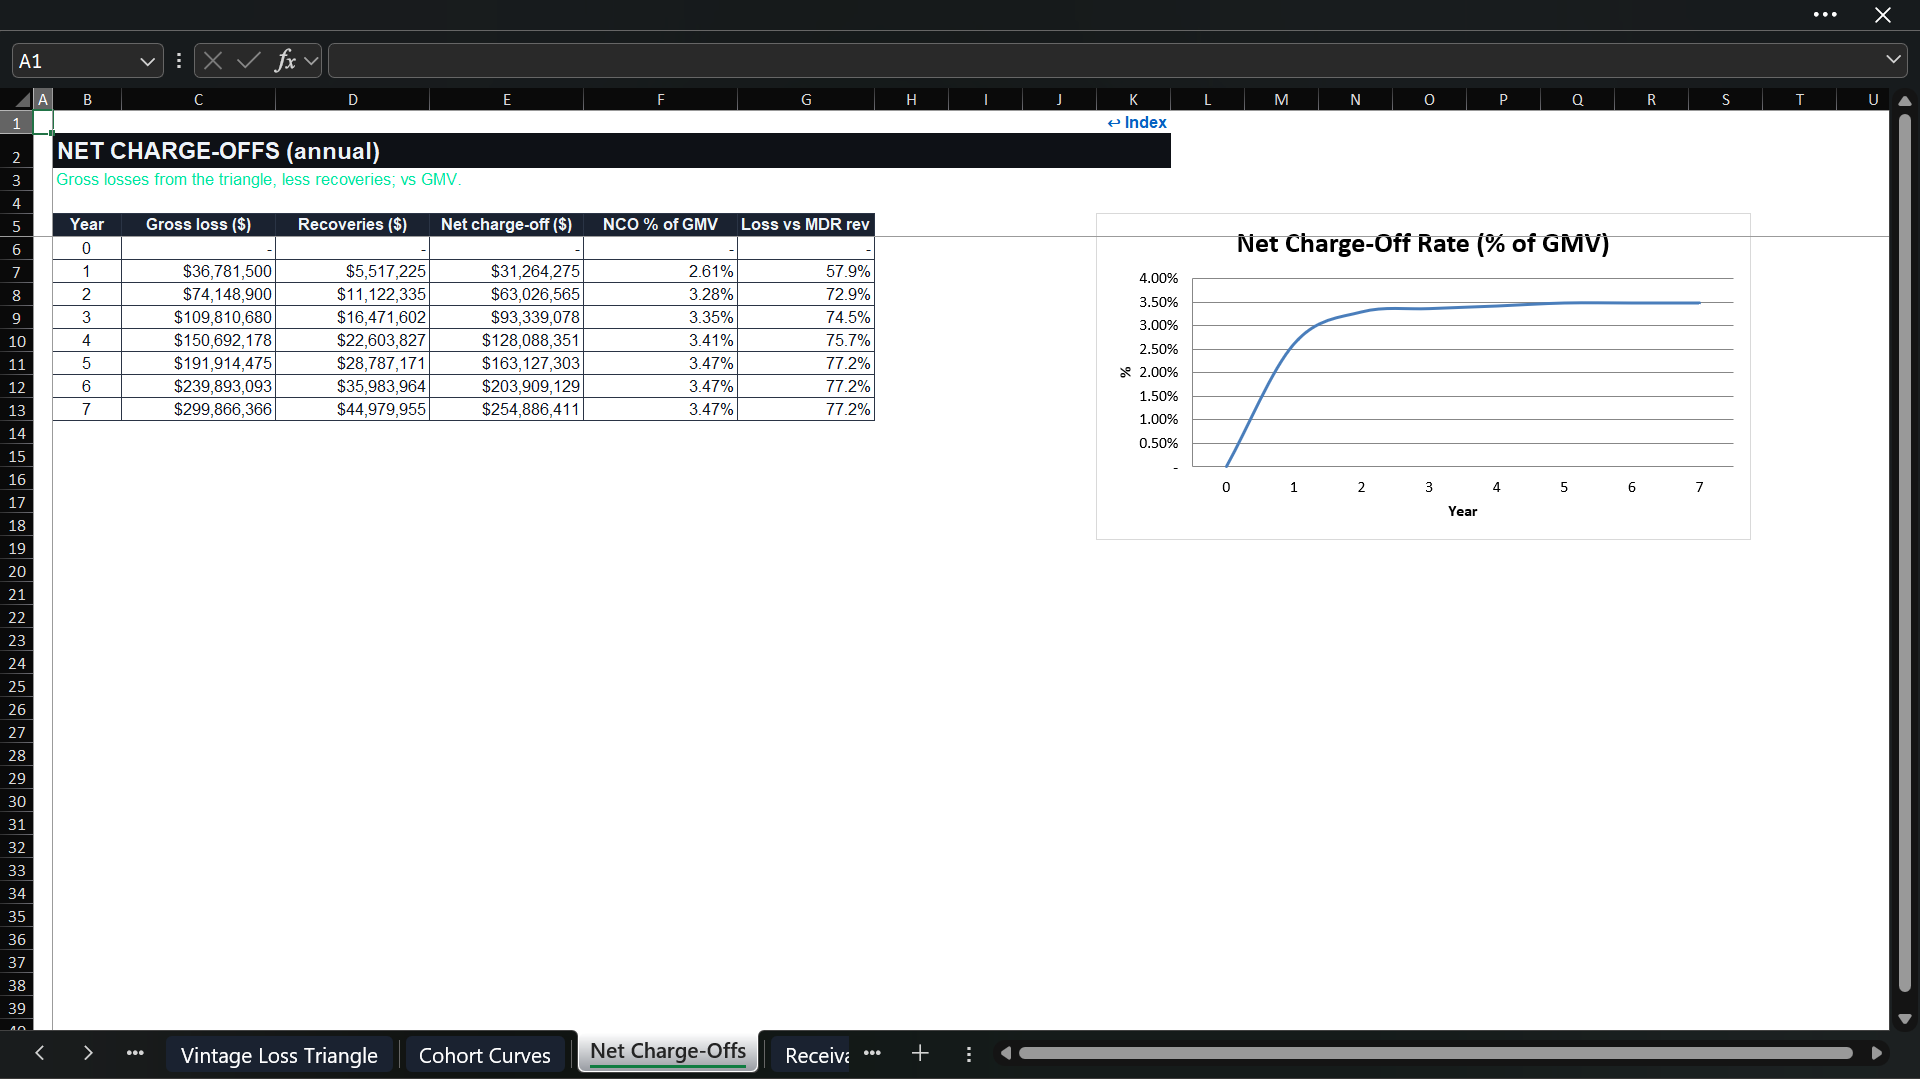
Annual net charge-offs aggregate the triangle, deduct recoveries, and calculate NCO as a percentage of GMV. This reveals loss seasoning and the difference between current originations and recognized losses.

๐Ÿ’ต MULTI-STREAM REVENUE MODEL
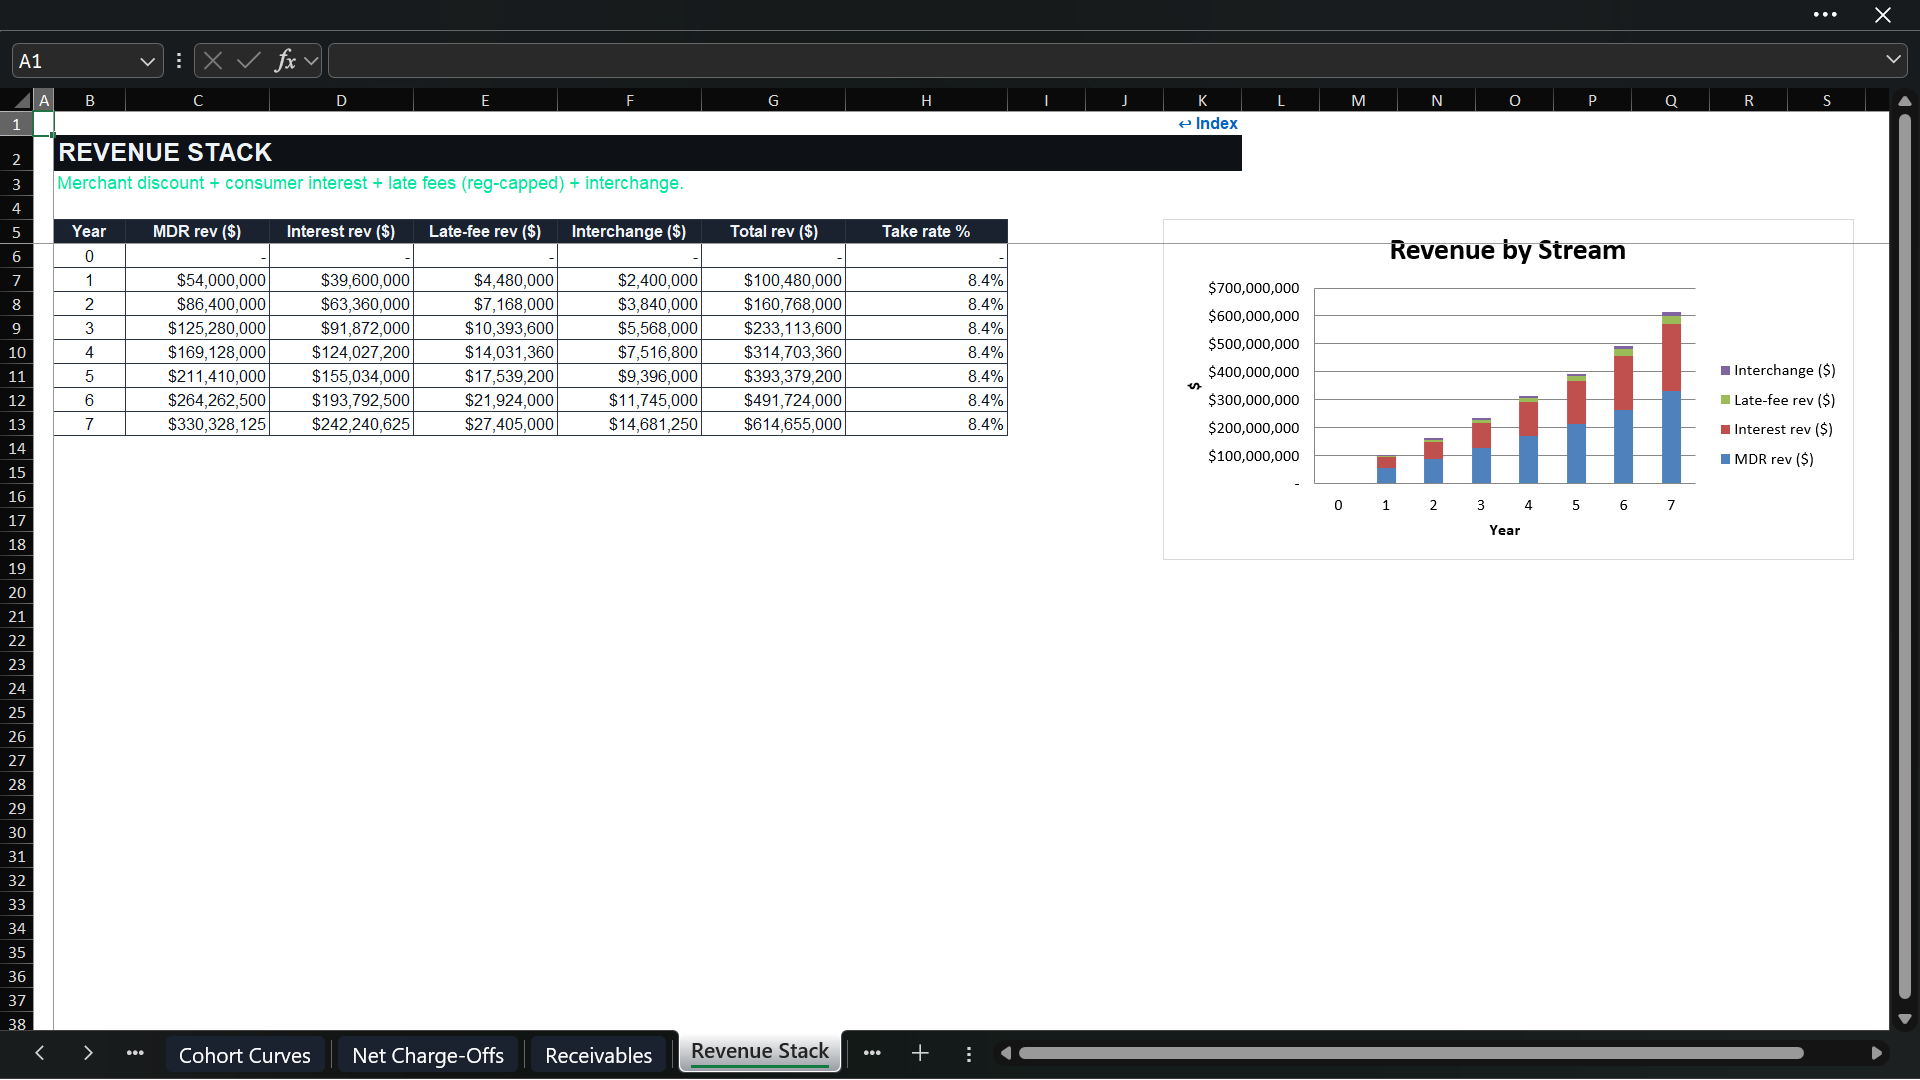
Revenue is separated into four linked sources:
  • Merchant discount-rate revenue calculated on GMV.
  • Consumer interest income on the interest-bearing share of originations.
  • Late-fee revenue based on loan volume, fee incidence, and the effective regulatory cap.
  • Interchange and other revenue calculated as a percentage of GMV.
The model calculates total revenue and the all-in take rate, showing which monetization streams support growth.

โš–๏ธ LATE-FEE REGULATORY ANALYSIS
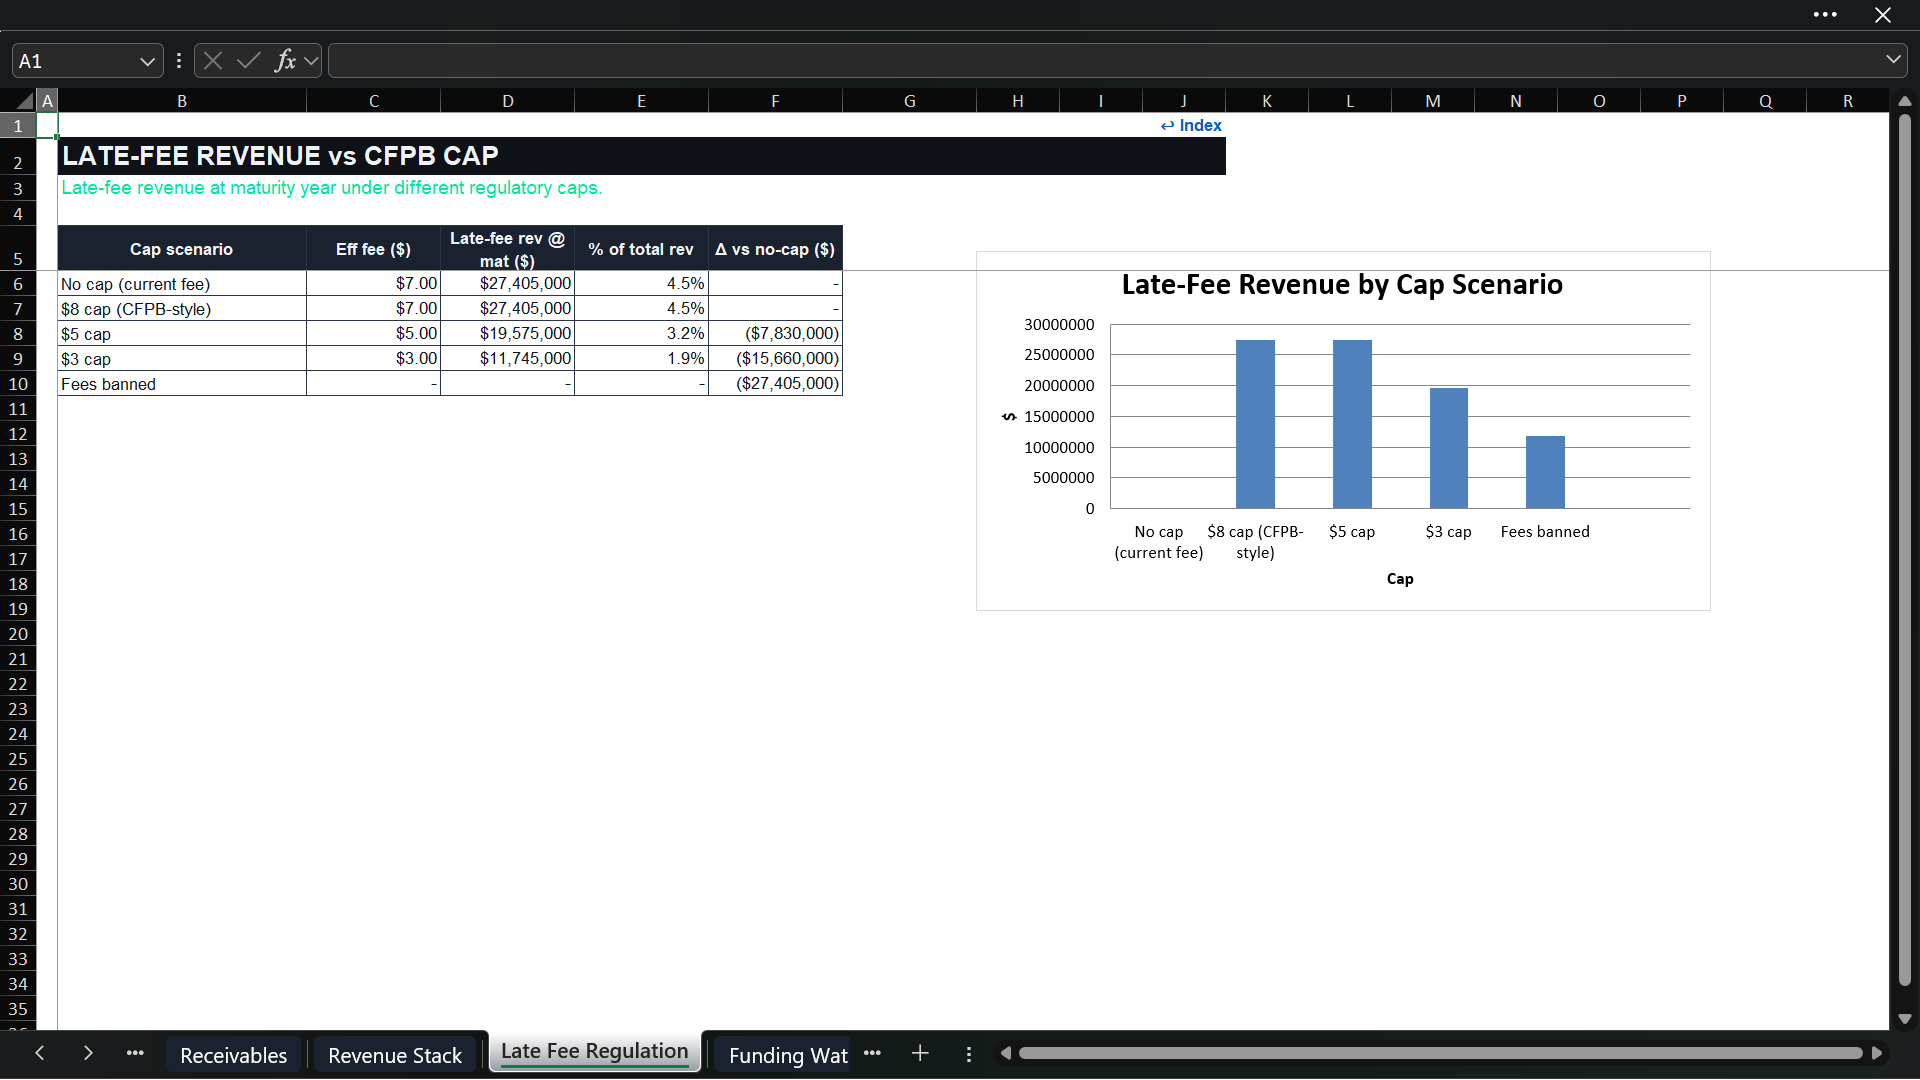
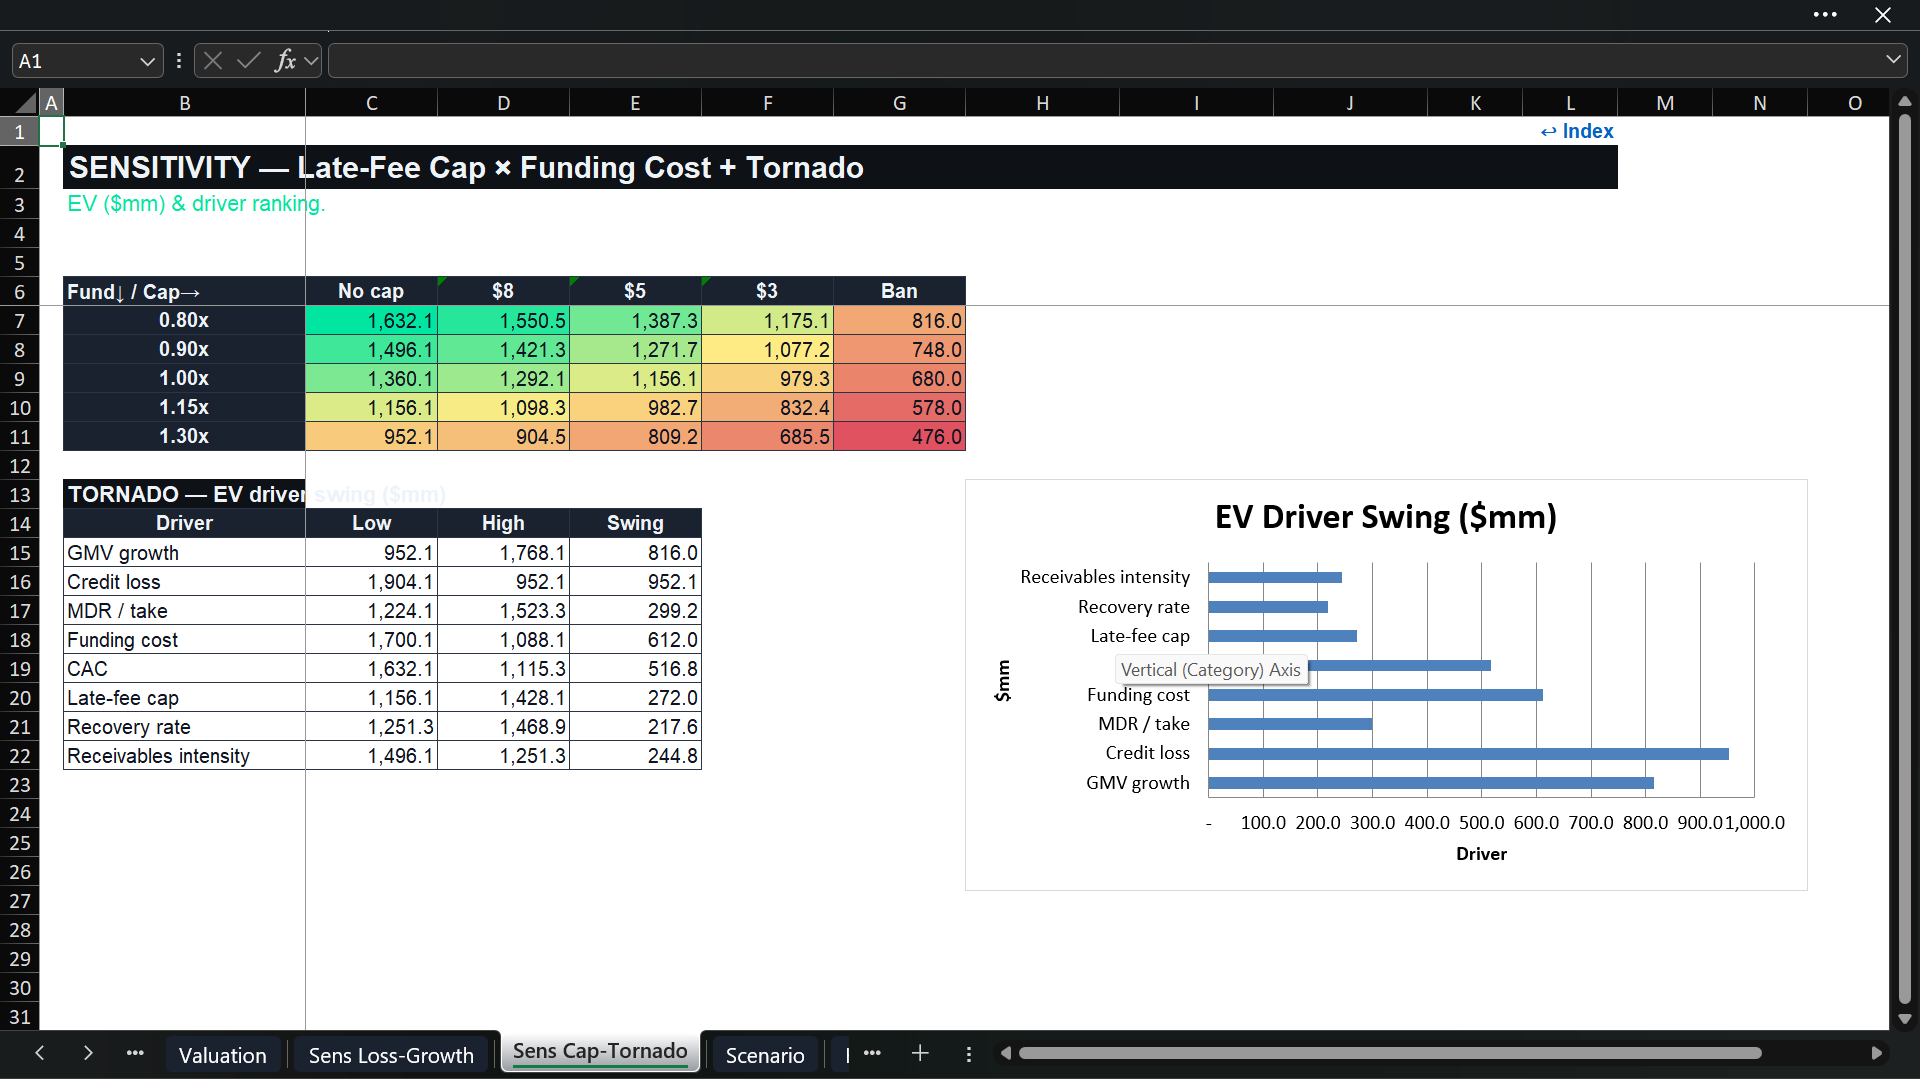
A dedicated regulatory schedule compares maturity-year late-fee revenue under five cases: current fee/no cap, an $8 cap, a $5 cap, a $3 cap, and a complete fee ban. For every case, the workbook reports the effective fee, revenue, share of total revenue, and change versus the current-fee case.
The Control Panel also includes a switch to apply or remove the modelโ€™s regulatory cap. This module is designed for scenario analysis only; it is not a legal interpretation of any current rule, court decision, or regulator position.

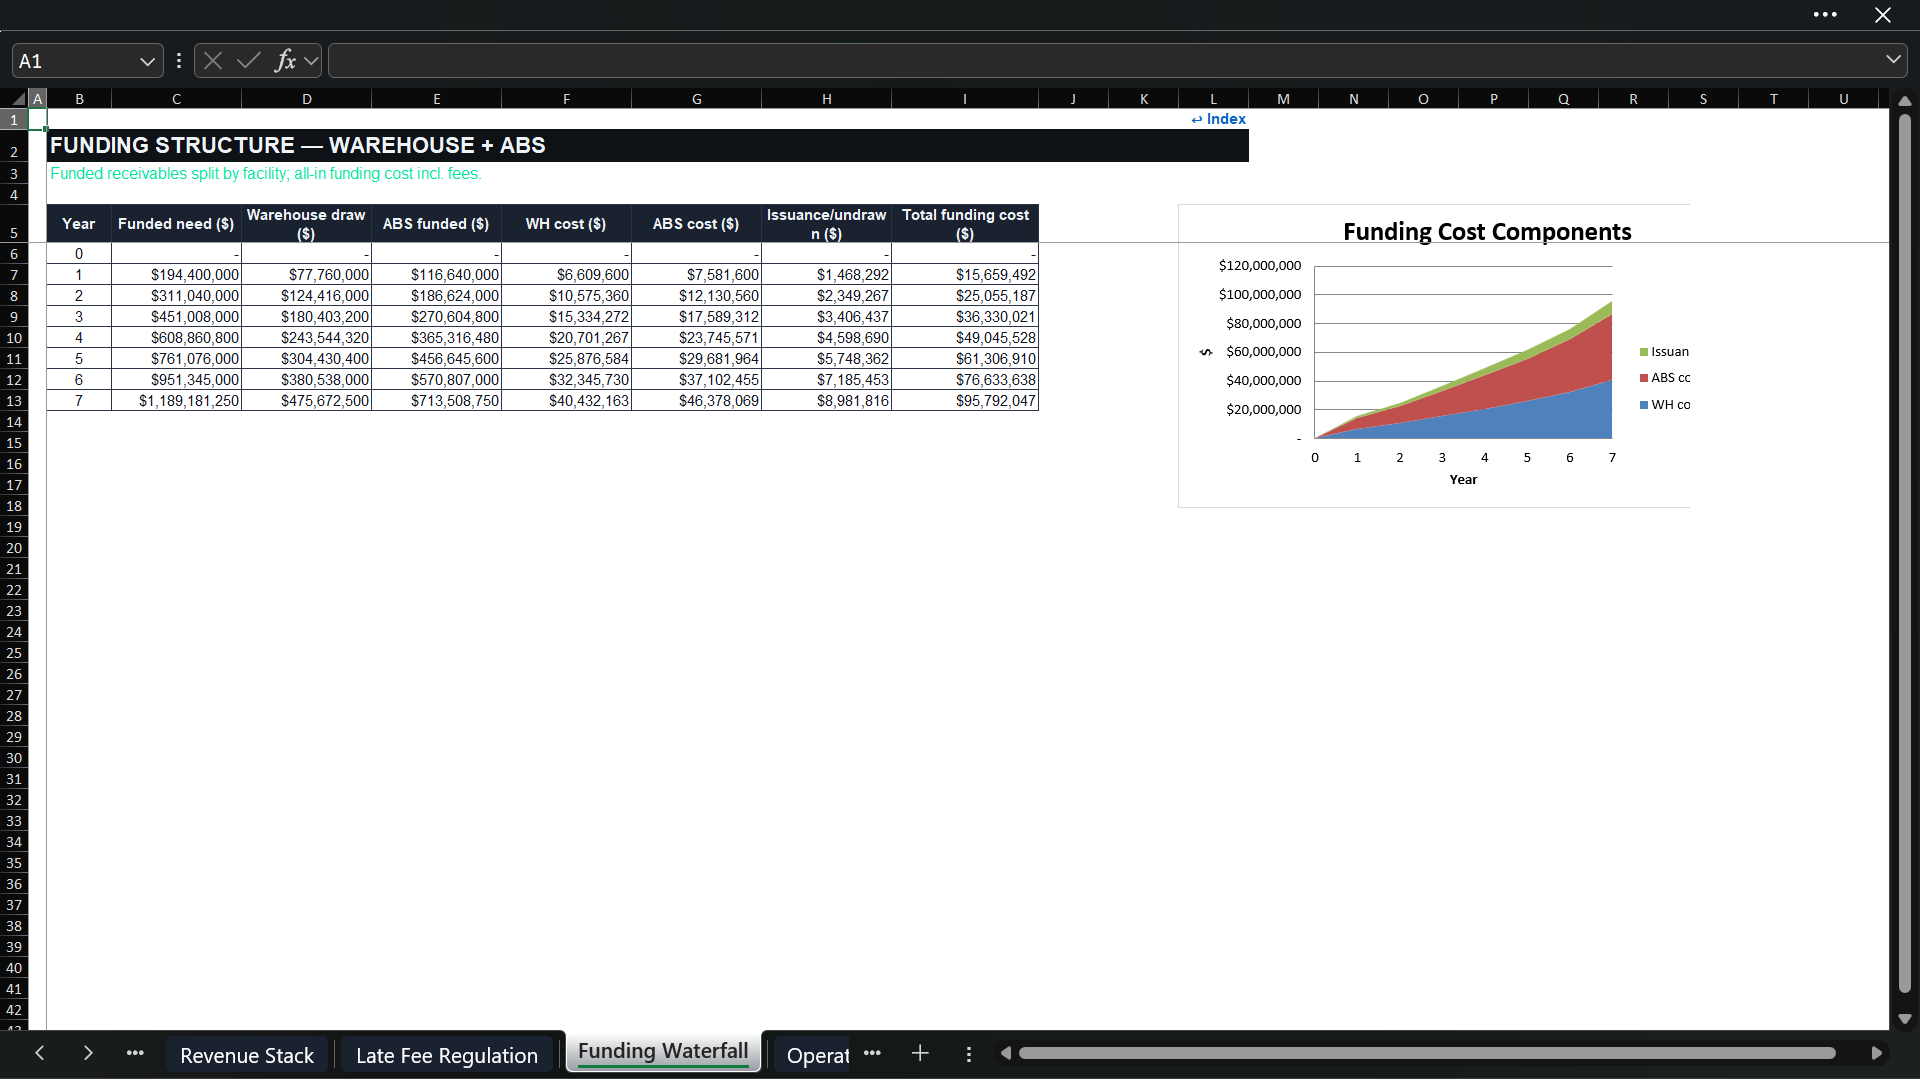
๐Ÿฆ RECEIVABLES & FUNDING WATERFALL
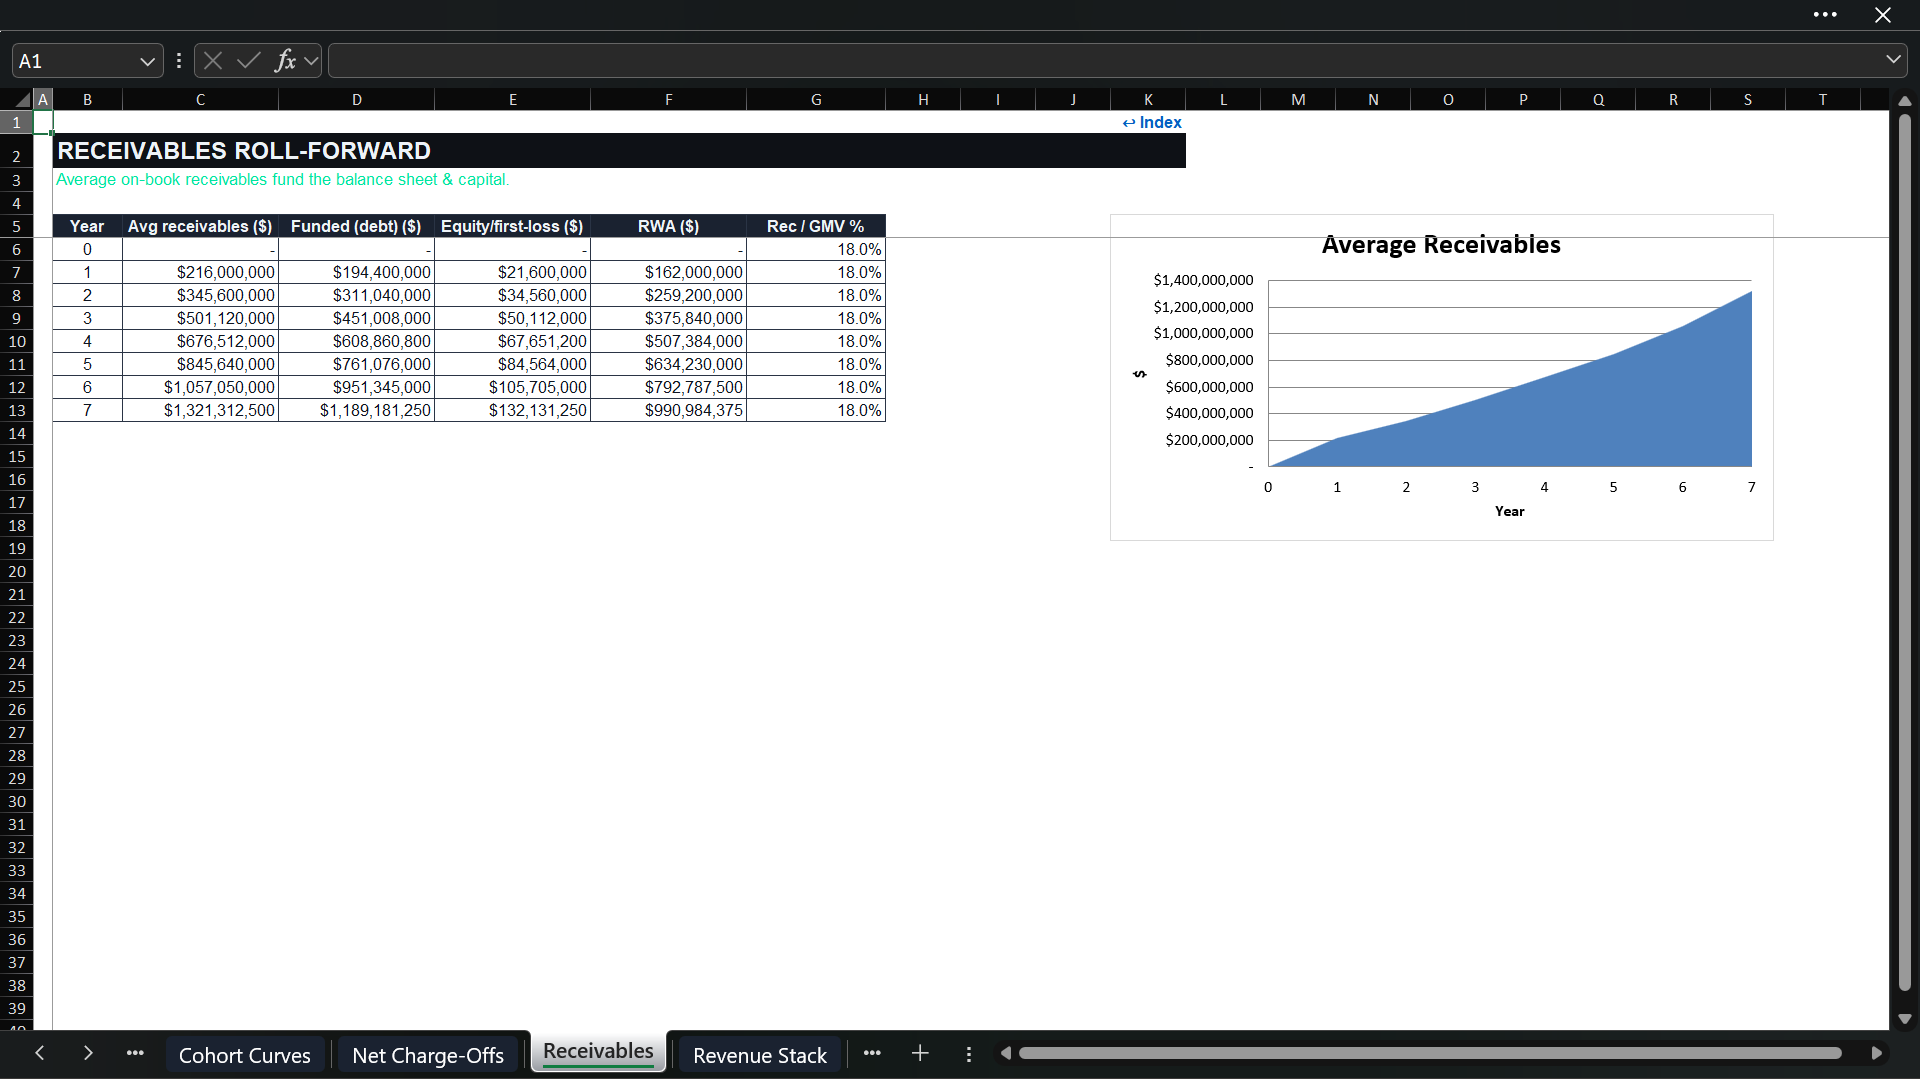
Average on-book receivables are estimated as a percentage of annual GMV. The receivables schedule separates debt-funded balances from the equity or first-loss tranche and calculates credit risk-weighted assets.
The funding selector supports three structures:
  • Warehouse facility.
  • ABS securitization.
  • Blended warehouse and ABS funding.
The funding waterfall applies the relevant advance rates and divides funded receivables between warehouse draw and ABS issuance. It calculates warehouse interest, ABS funding cost, securitization fees, warehouse undrawn fees, and total annual funding cost. This allows users to compare a bank-facility strategy with securitization or a blended capital-markets path.
The schedule is analytical, not a lender-specific borrowing-base, covenant, trigger, amortization, or legal-document model.

๐Ÿงฎ OPERATING COSTS & UNIT ECONOMICS
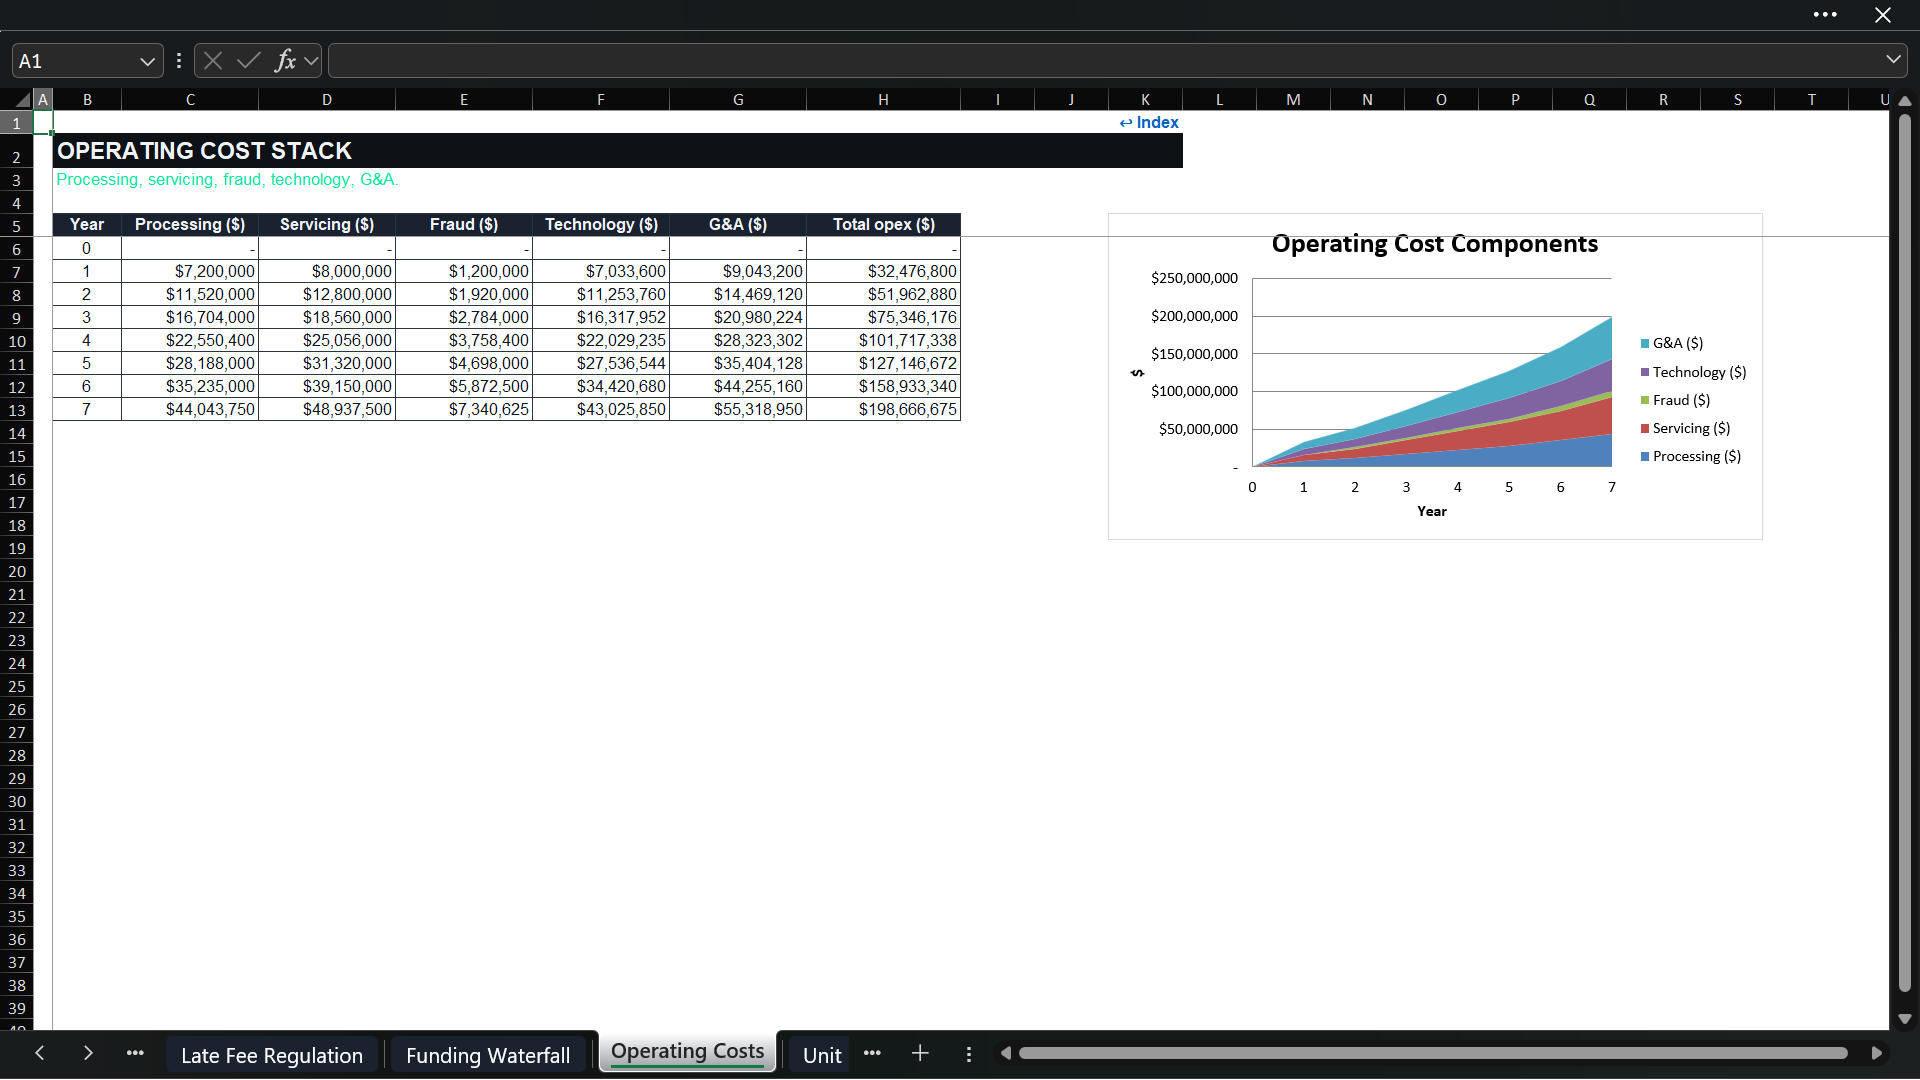
The operating-cost stack includes payment processing, loan servicing, fraud loss, technology and platform expense, and G&A. Customer-acquisition spend is modeled separately from core operating costs in the P&L.
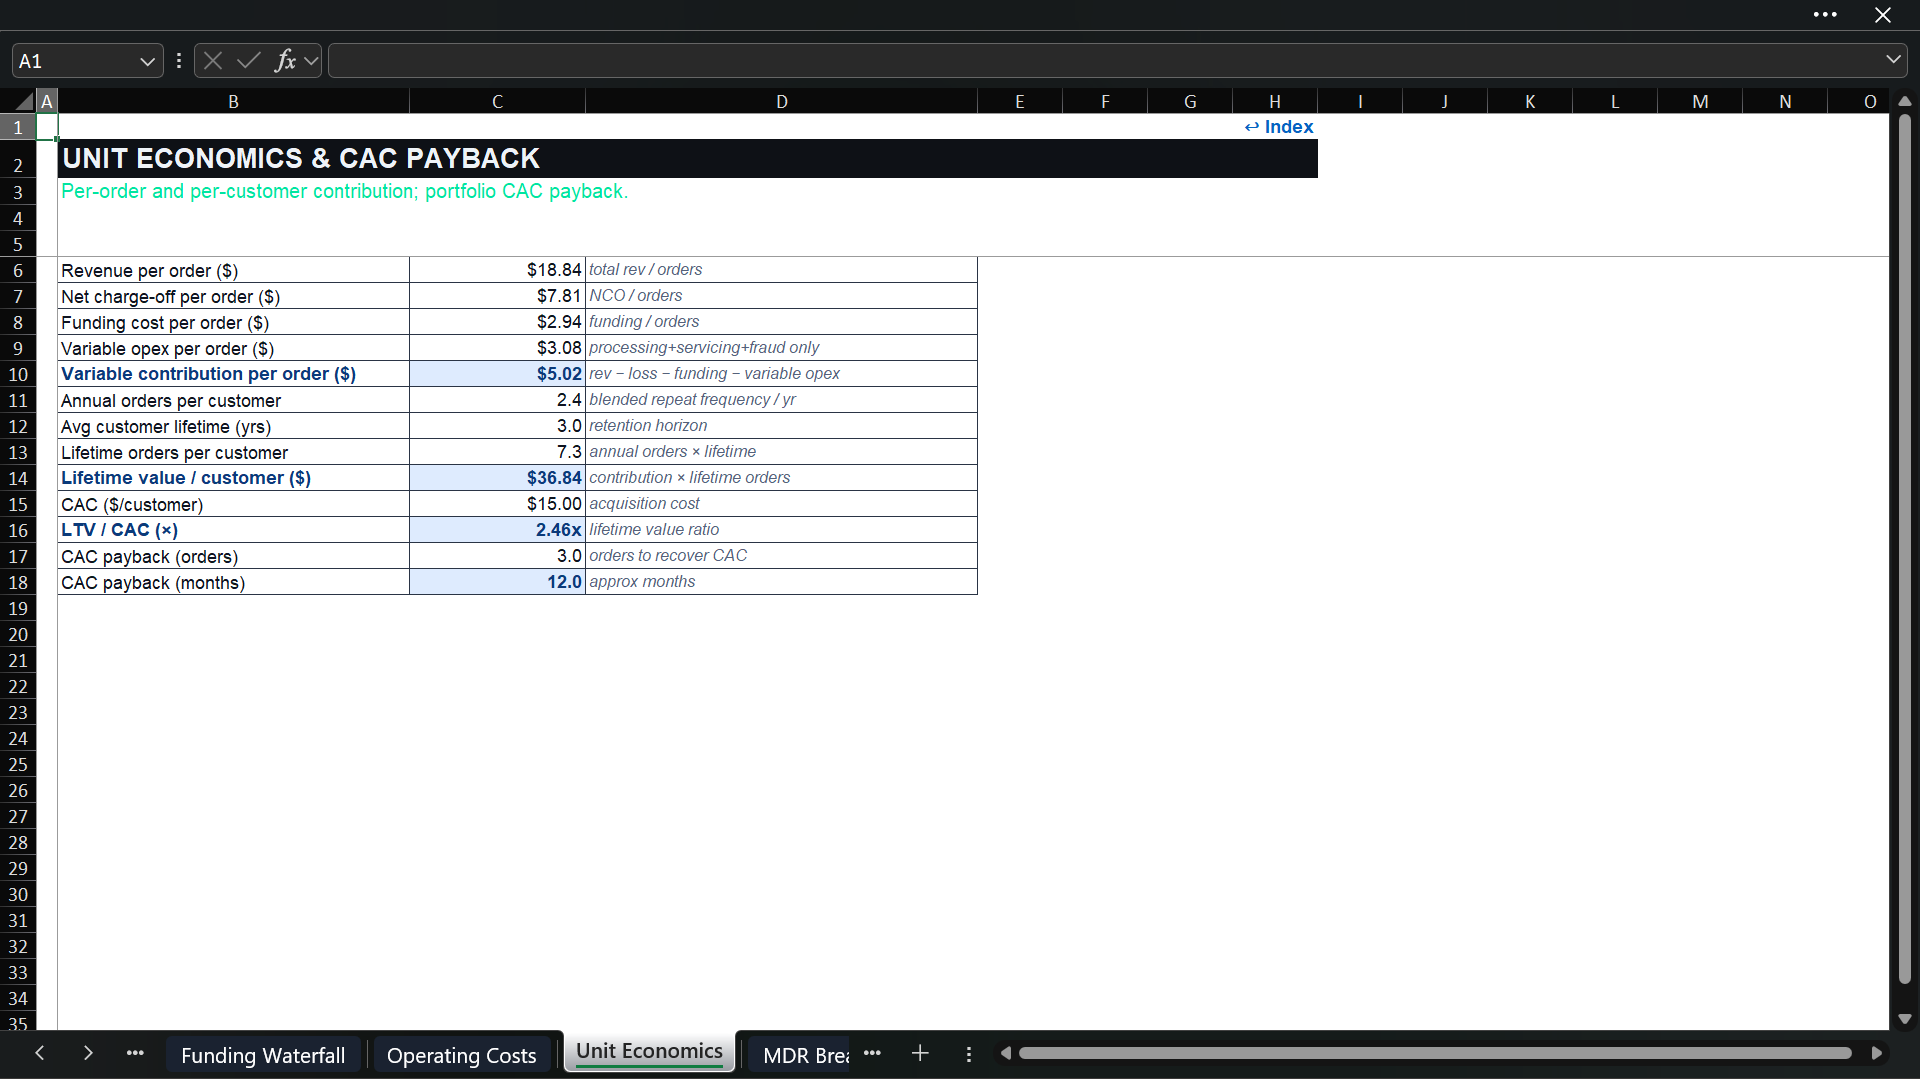
The unit-economics schedule calculates:
  • Revenue per order.
  • Net charge-off per order.
  • Funding cost per order.
  • Variable operating cost per order.
  • Variable contribution per order.
  • Annual and lifetime orders per customer.
  • Lifetime value per customer.
  • CAC, LTV/CAC, CAC-payback orders, and approximate payback months.
These outputs connect transaction economics to customer acquisition after credit and funding costs.

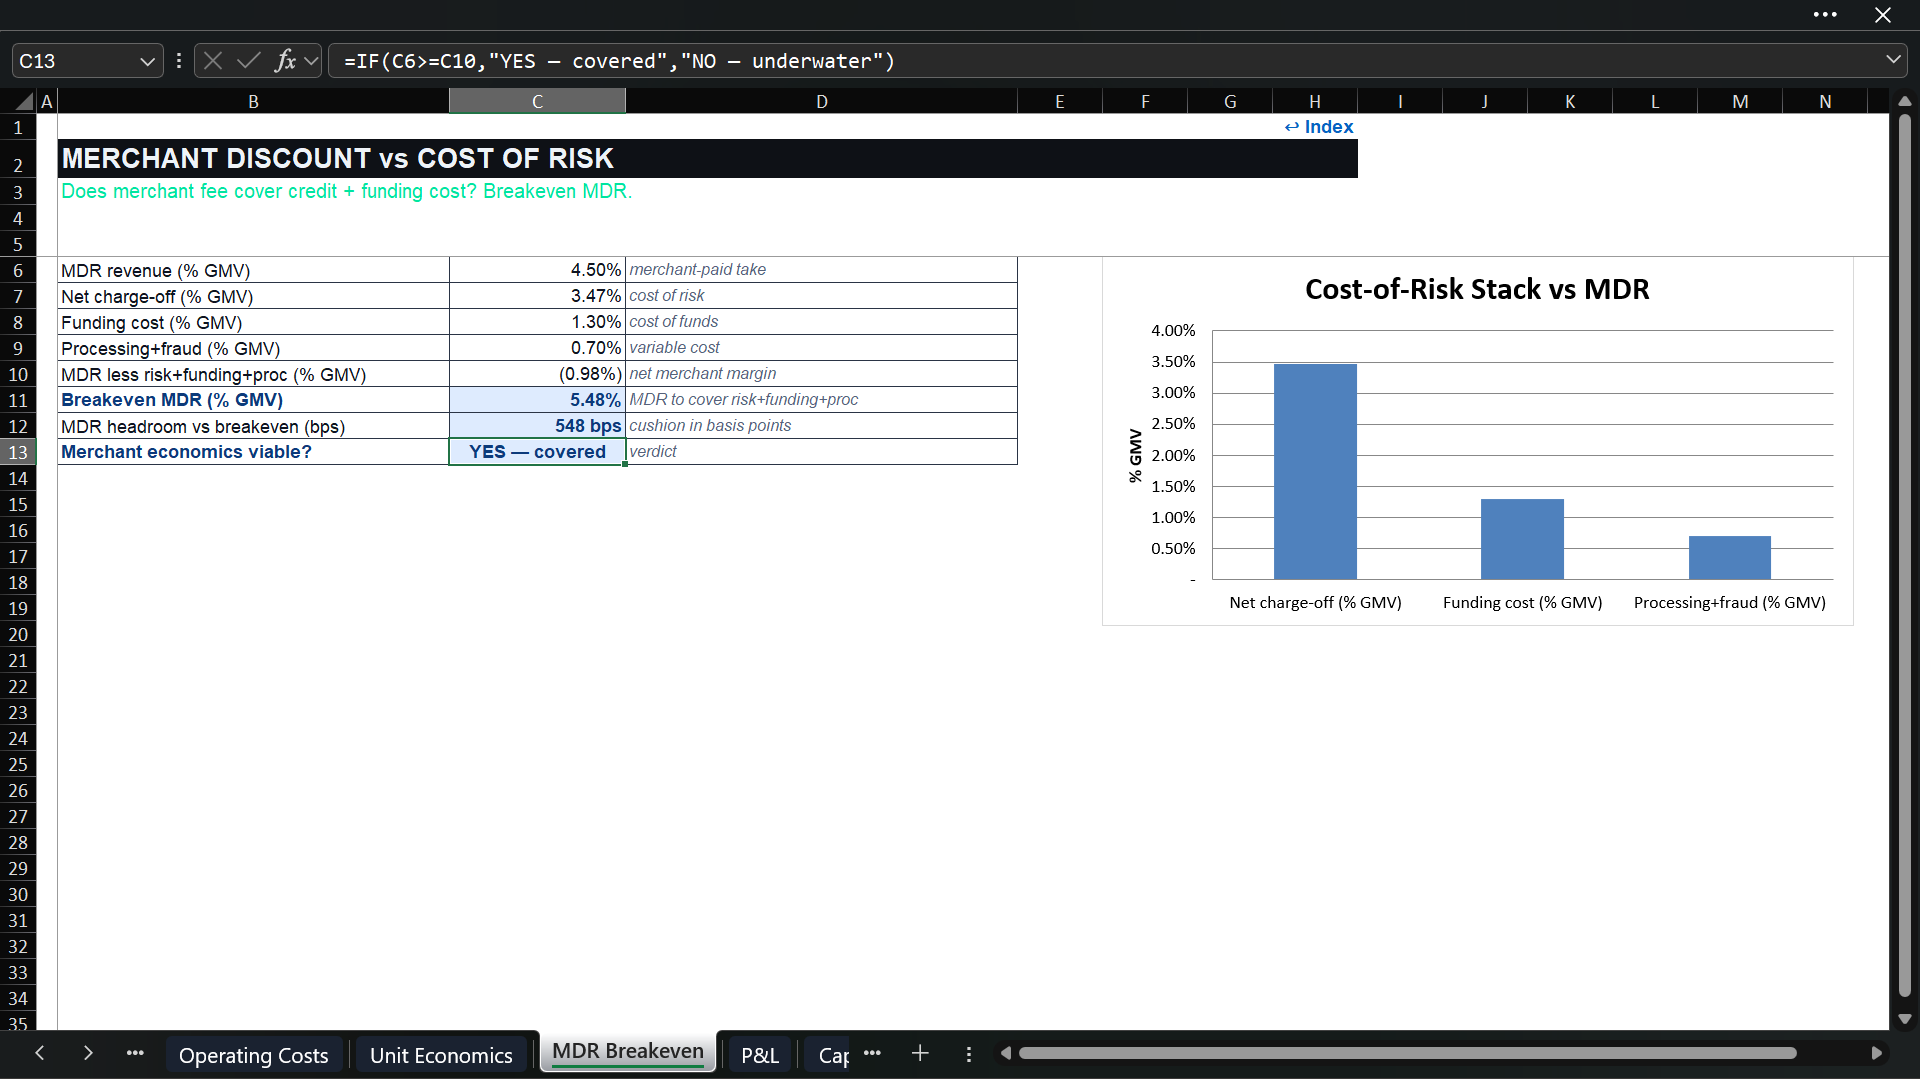
๐Ÿท๏ธ MERCHANT DISCOUNT-RATE BREAKEVEN
The model builds a BNPL-specific merchant-fee benchmark by adding the net charge-off rate, funding-cost rate, and processing plus fraud costs. This produces the MDR required for merchant revenue alone to cover those direct portfolio costs, together with the difference between current MDR and the calculated breakeven requirement.
Read this analysis alongside consumer interest, late fees, and interchange because merchant revenue is only one part of total monetization. Review the formulas against your definition of merchant-level breakeven.

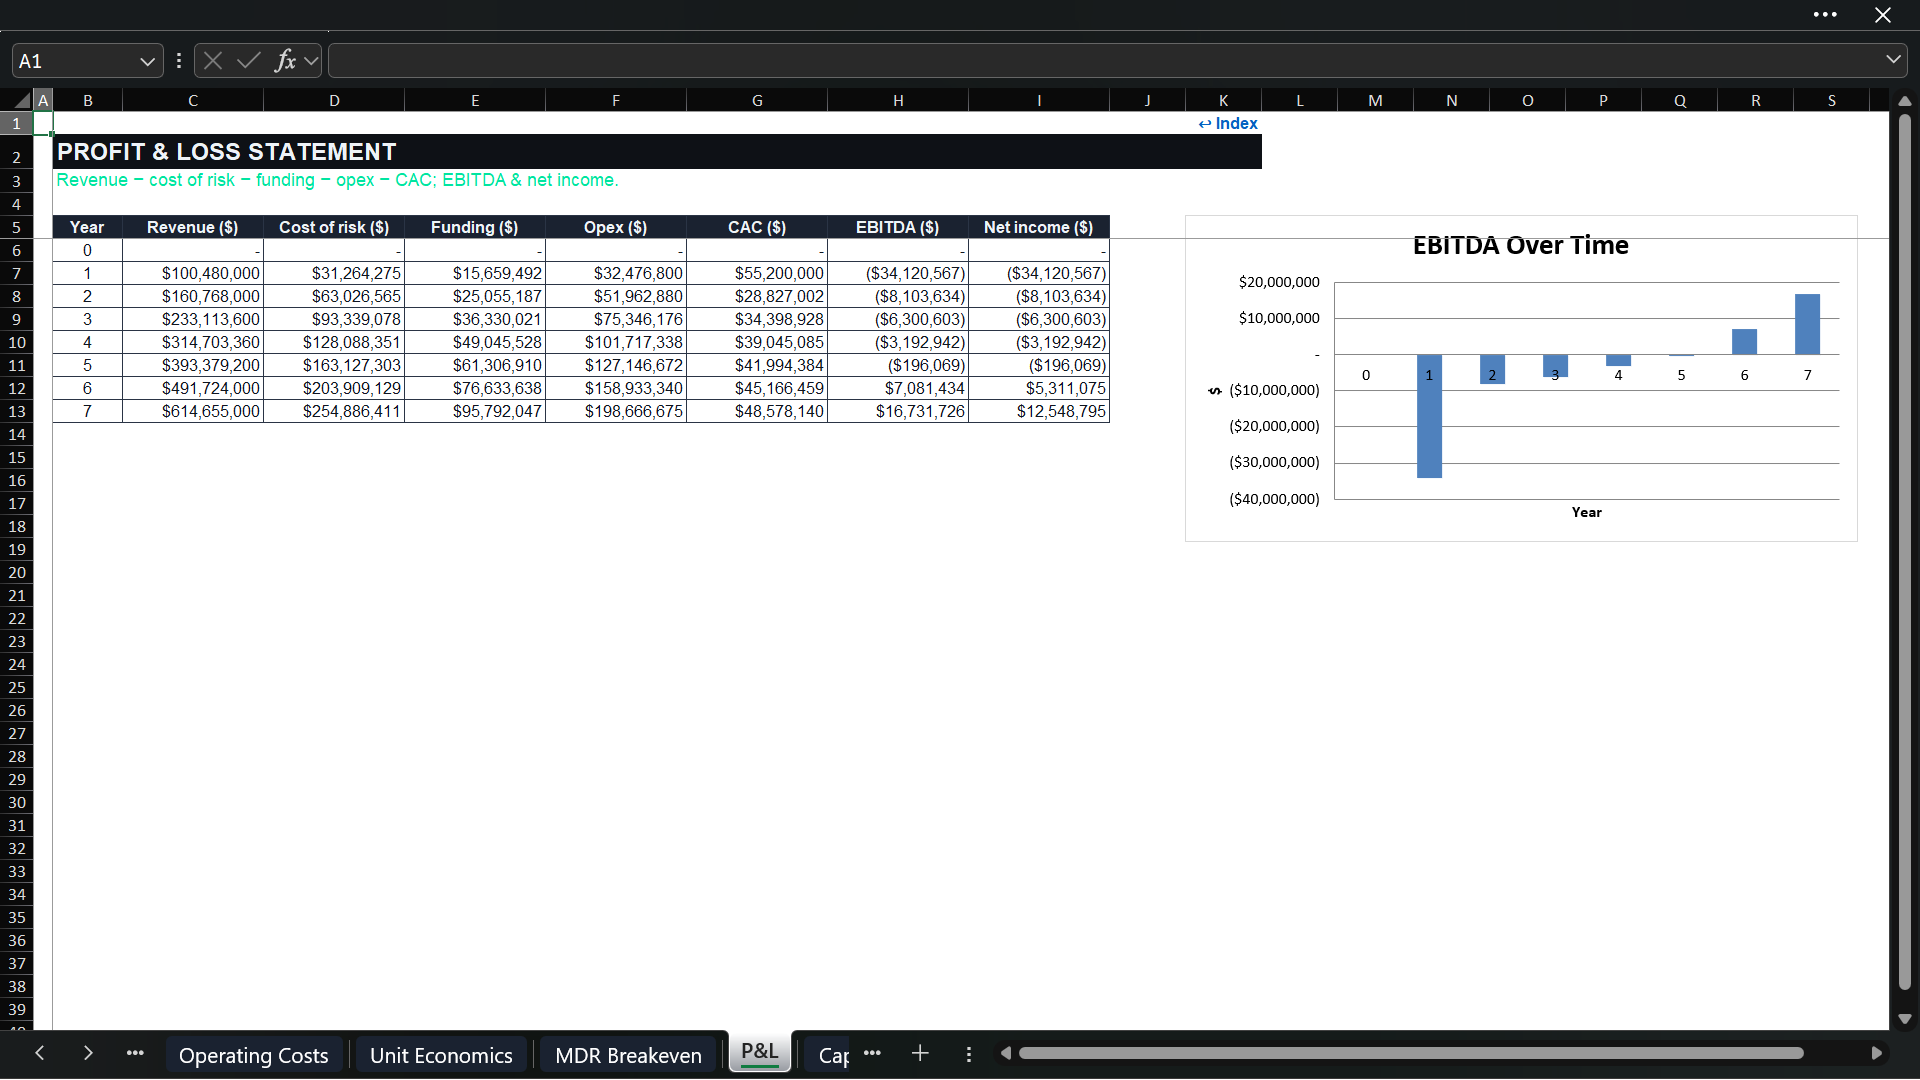
๐Ÿ“Š SEVEN-YEAR P&L & PROFITABILITY
The linked P&L reports total revenue, net charge-offs, funding expense, operating costs, customer-acquisition spend, EBITDA, and net income from Year 0 through Year 7. This reveals how growth, credit losses, cost of funds, opex, and CAC interact before the platform reaches scale.
Cost of risk and funding are separated from opex, making profitability easier to diagnose.

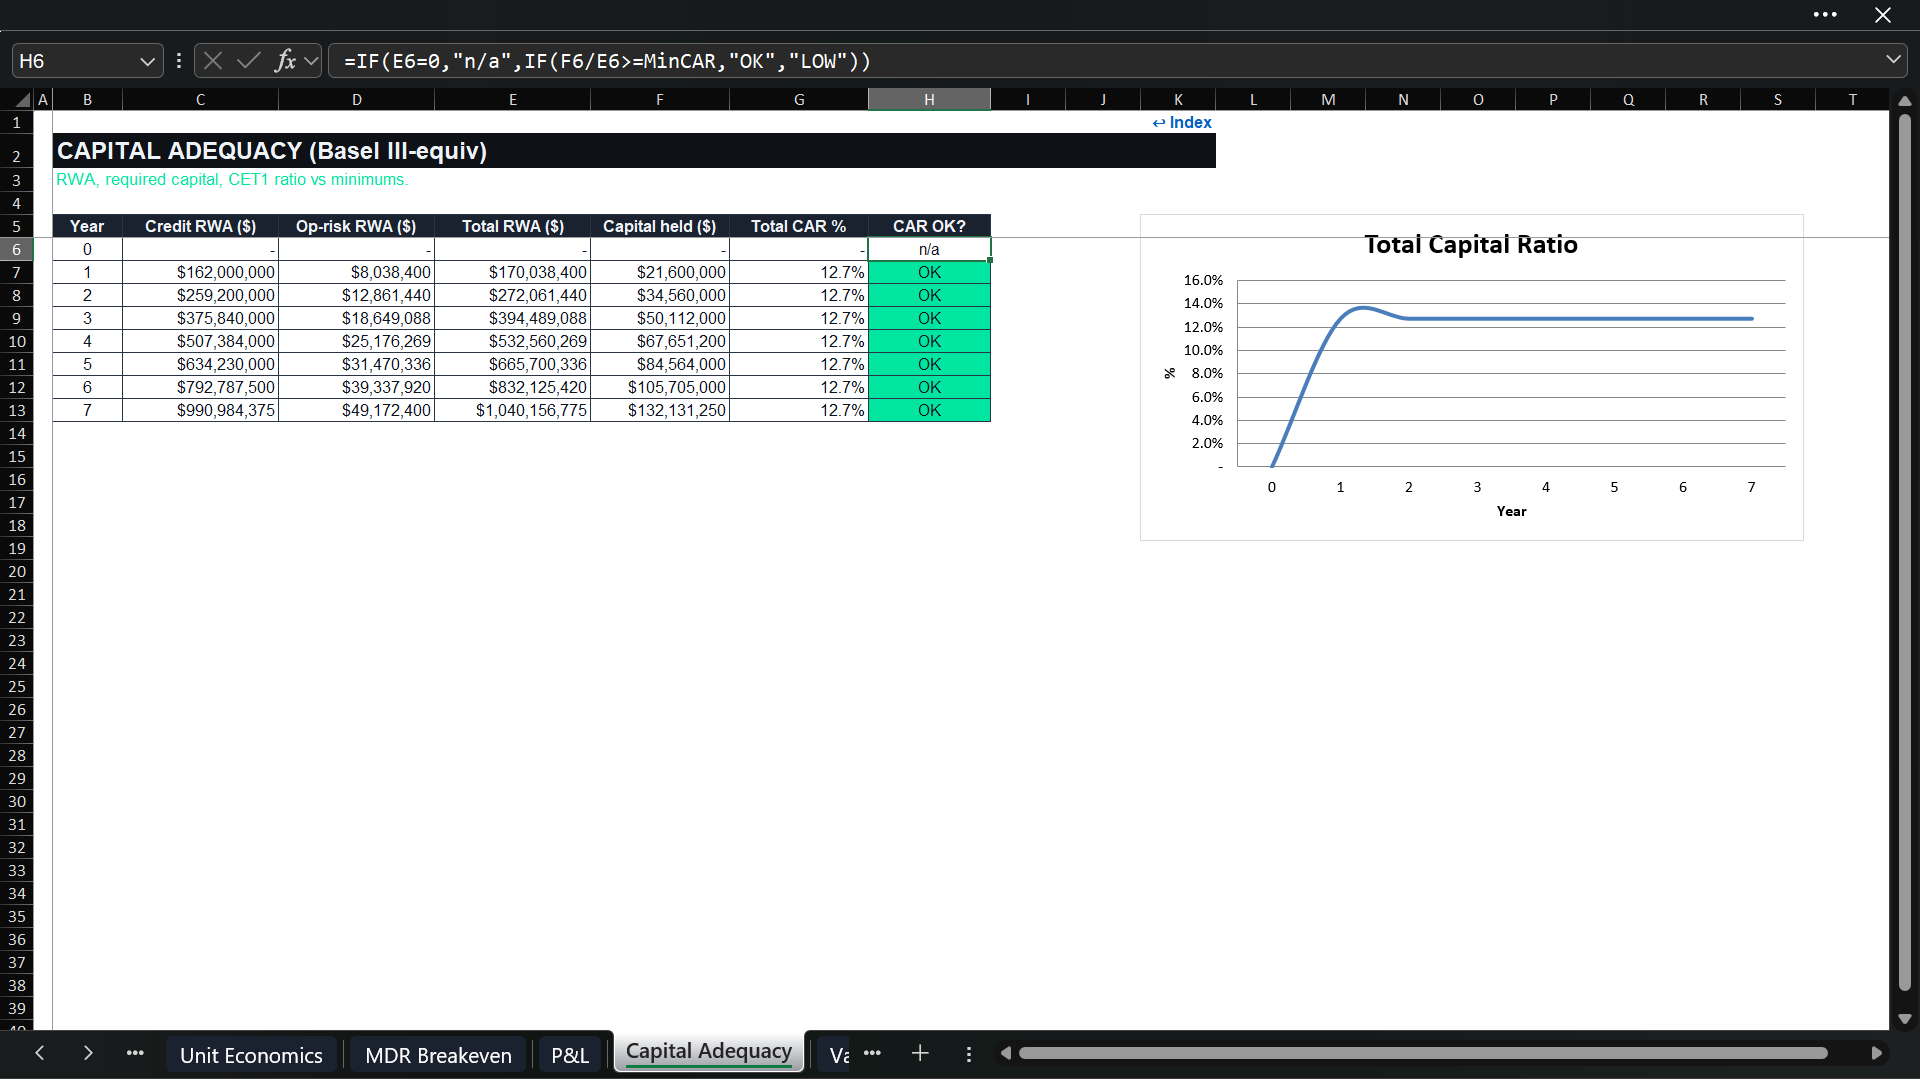
๐Ÿ›ก๏ธ CAPITAL ADEQUACY
The Basel III-equivalent capital schedule applies an editable risk weight to receivables and adds operational-risk RWA based on revenue. It compares the equity or first-loss capital held against total risk-weighted assets and tests the resulting total capital ratio against the selected minimum.
Outputs include credit RWA, operational-risk RWA, total RWA, capital held, capital ratio, and annual status. This is a simplified framework, not a jurisdiction-specific regulatory-capital calculation.

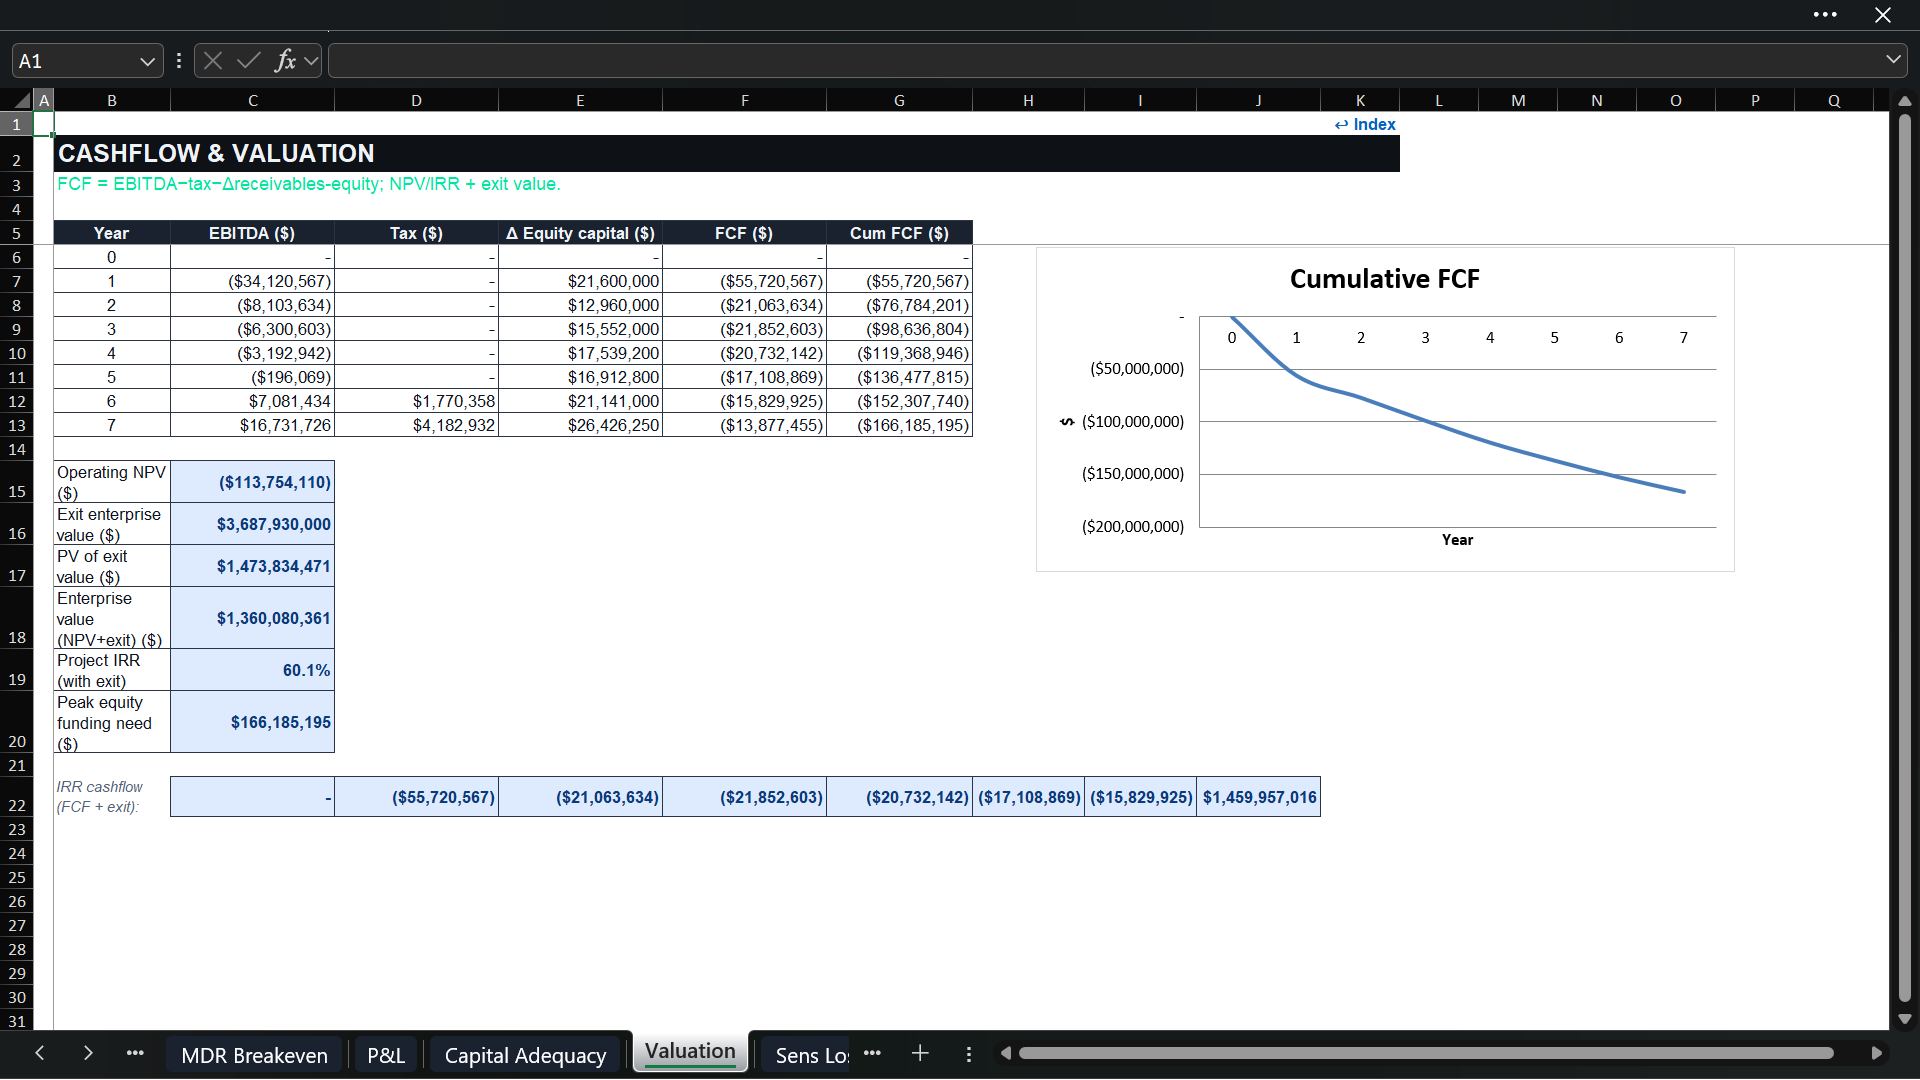
๐Ÿ’Ž CASH FLOW & VALUATION
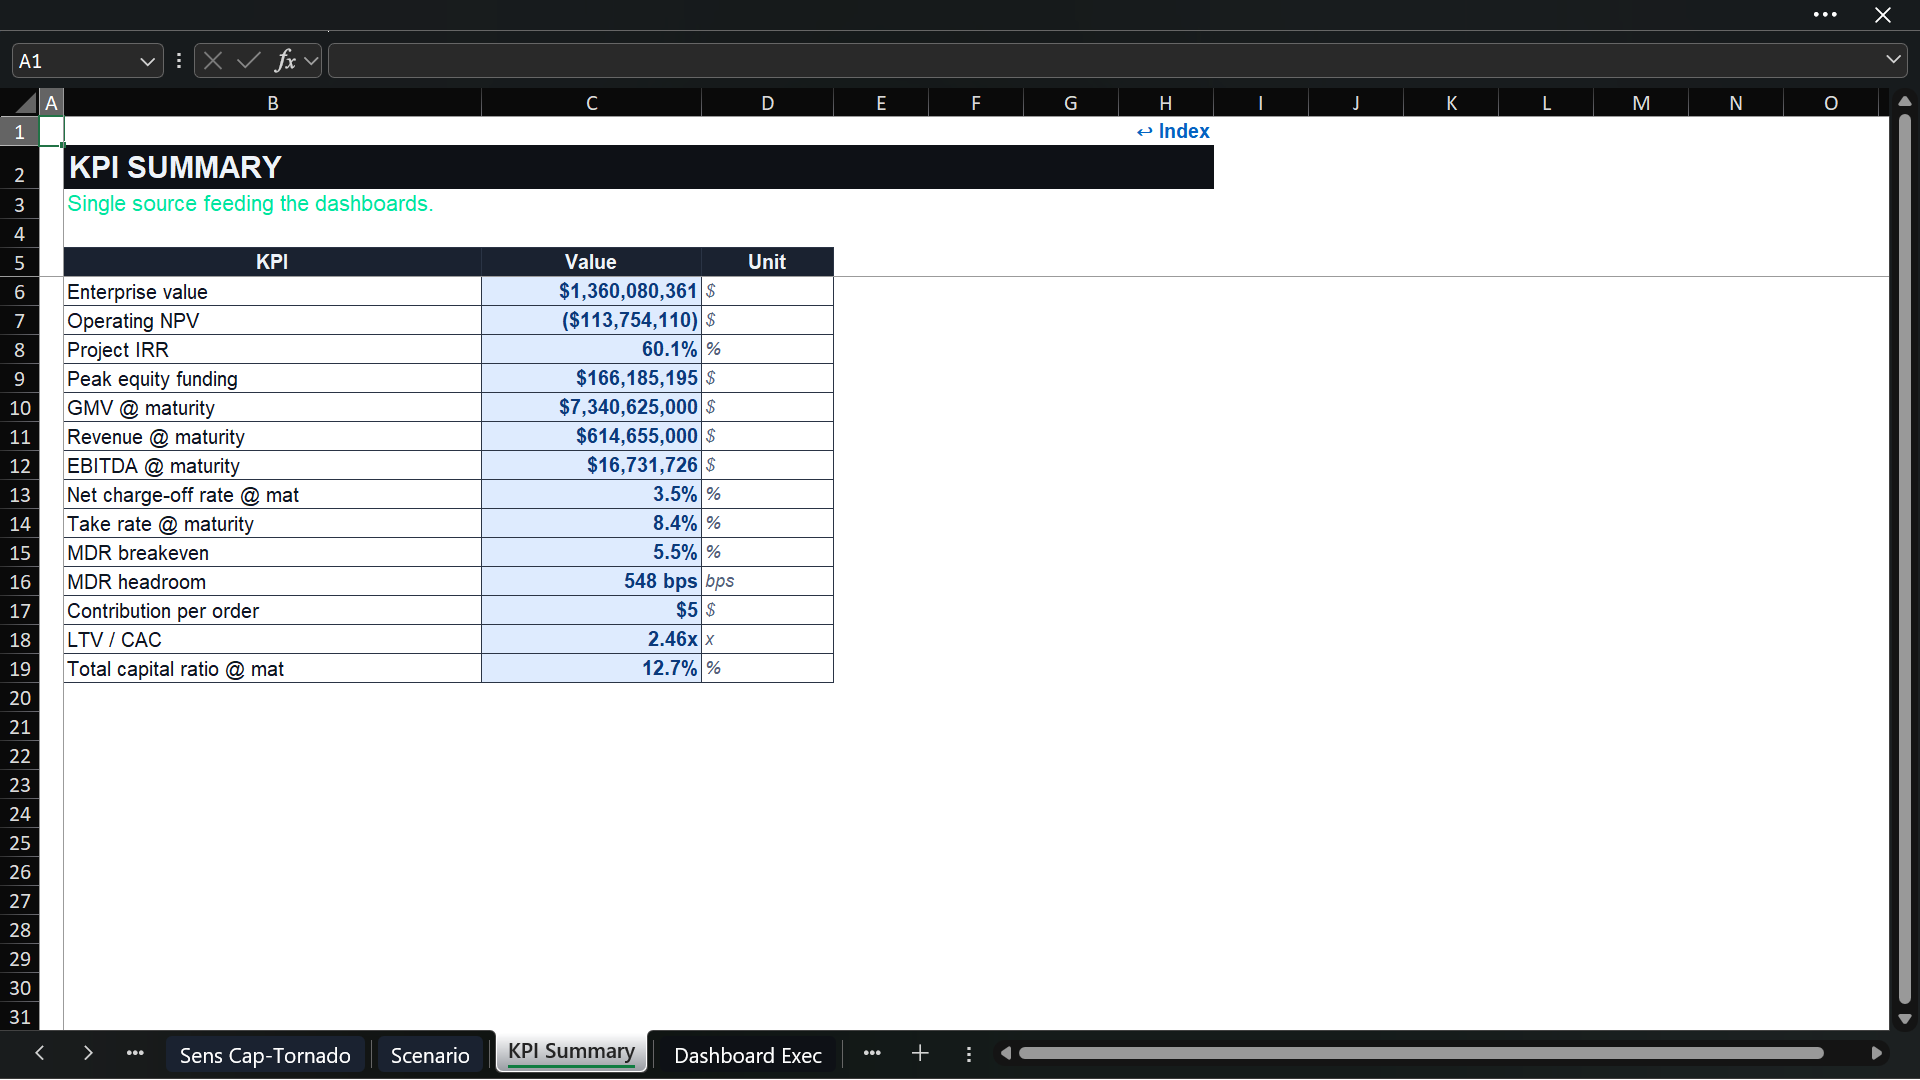
The valuation schedule converts EBITDA into free cash flow after cash tax and increases in equity or first-loss capital. It calculates operating NPV, terminal enterprise value using an editable EV/revenue multiple, present value of the exit, total enterprise value, project IRR including the exit, and peak equity funding requirement.
The model is an unlevered platform valuation with explicit receivables funding and first-loss capital. It does not include a full balance sheet, shareholder waterfall, option pool, dilution, or covenant package.

๐Ÿงญ SCENARIOS, SENSITIVITY VIEWS & DRIVER RANKING
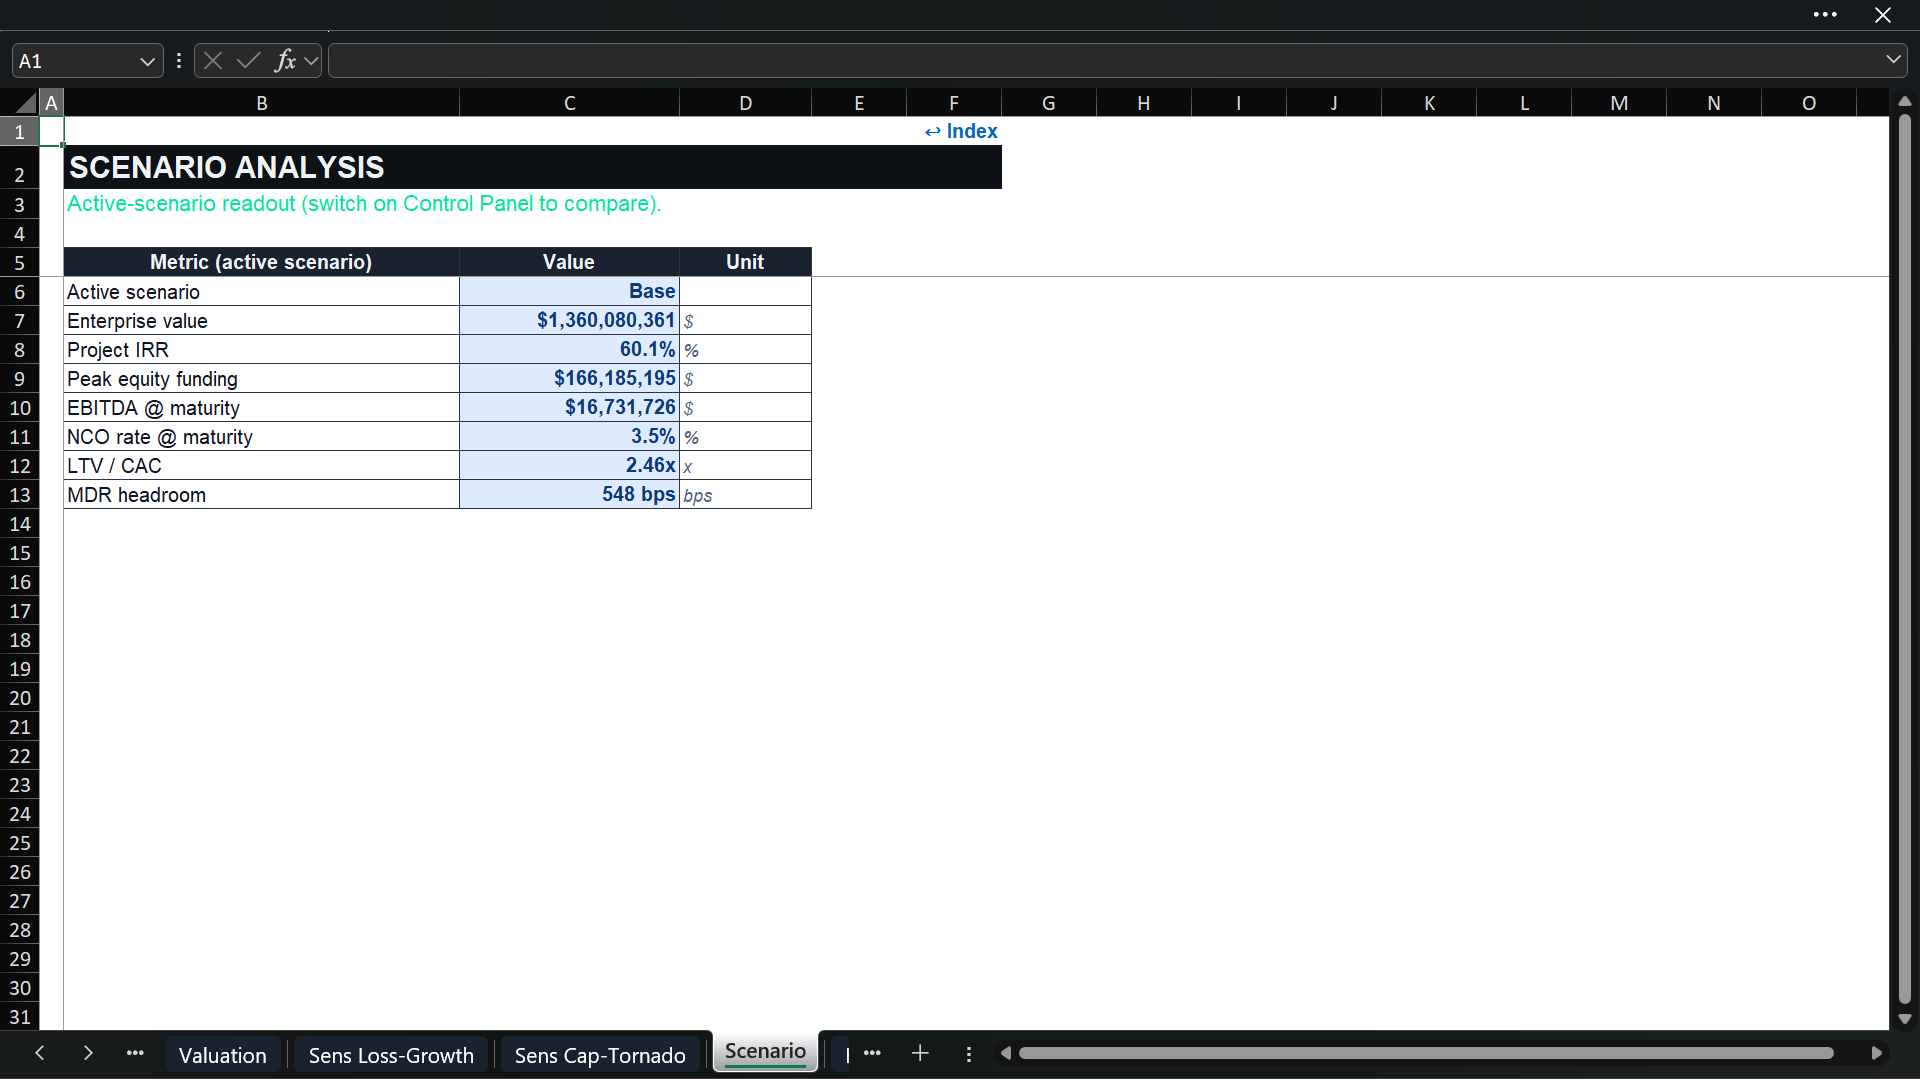
The Bear, Base, and Bull selector changes five central drivers: GMV growth, credit loss, MDR/take rate, funding cost, and CAC. The active case flows through the operating model and produces a summary of enterprise value, project IRR, peak equity funding, mature EBITDA, net charge-off rate, LTV/CAC, and merchant-fee breakeven output.
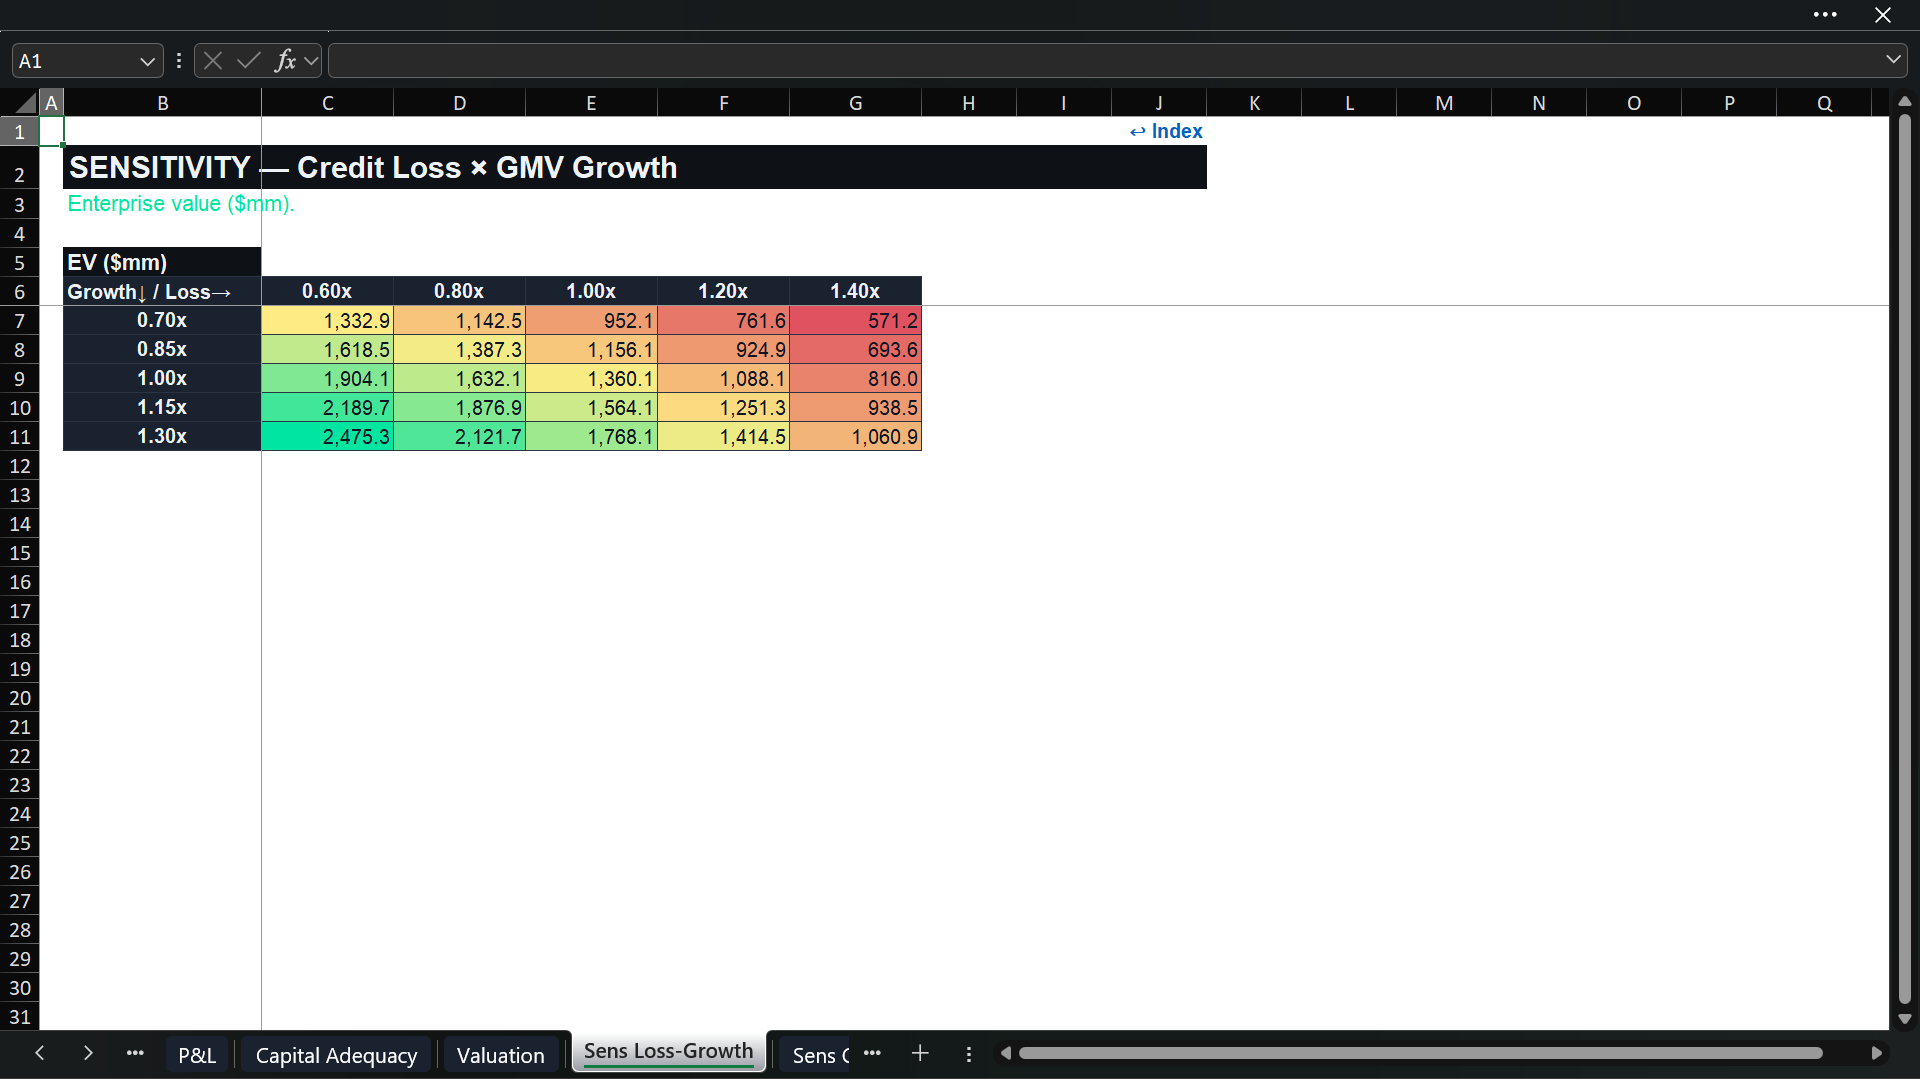
The workbook also contains illustrative enterprise-value grids for credit loss versus growth and funding cost versus late-fee regulation. A tornado-style schedule ranks exposure to GMV growth, credit loss, MDR/take rate, funding cost, CAC, late-fee caps, recovery rate, and receivables intensity. These views help prioritize diligence and frame downside discussions.

๐Ÿ“‰ EXECUTIVE & CREDIT DASHBOARDS
Two dark-theme dashboards summarize the model:
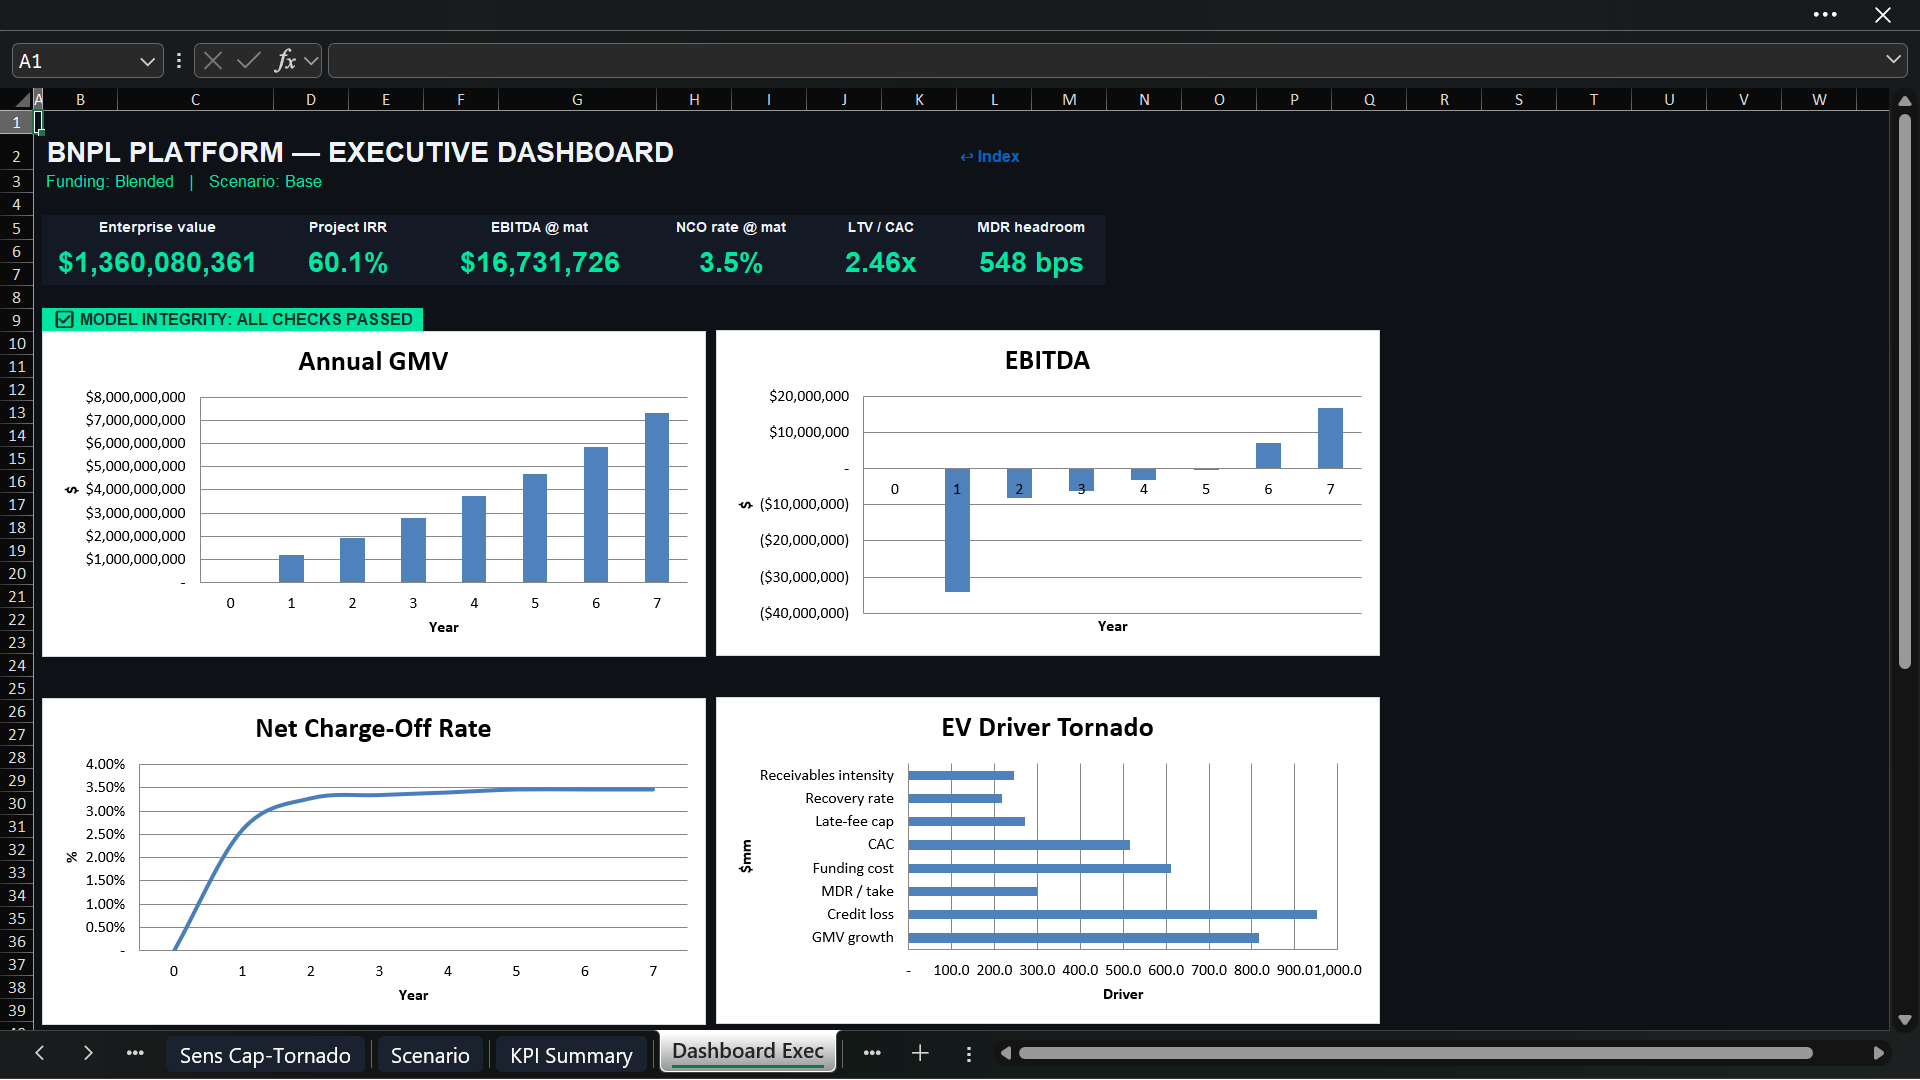
  • Executive Dashboard: enterprise value, project IRR, mature EBITDA, LTV/CAC, take rate, merchant-fee breakeven output, annual GMV, EBITDA trend, net charge-off rate, and value-driver ranking.
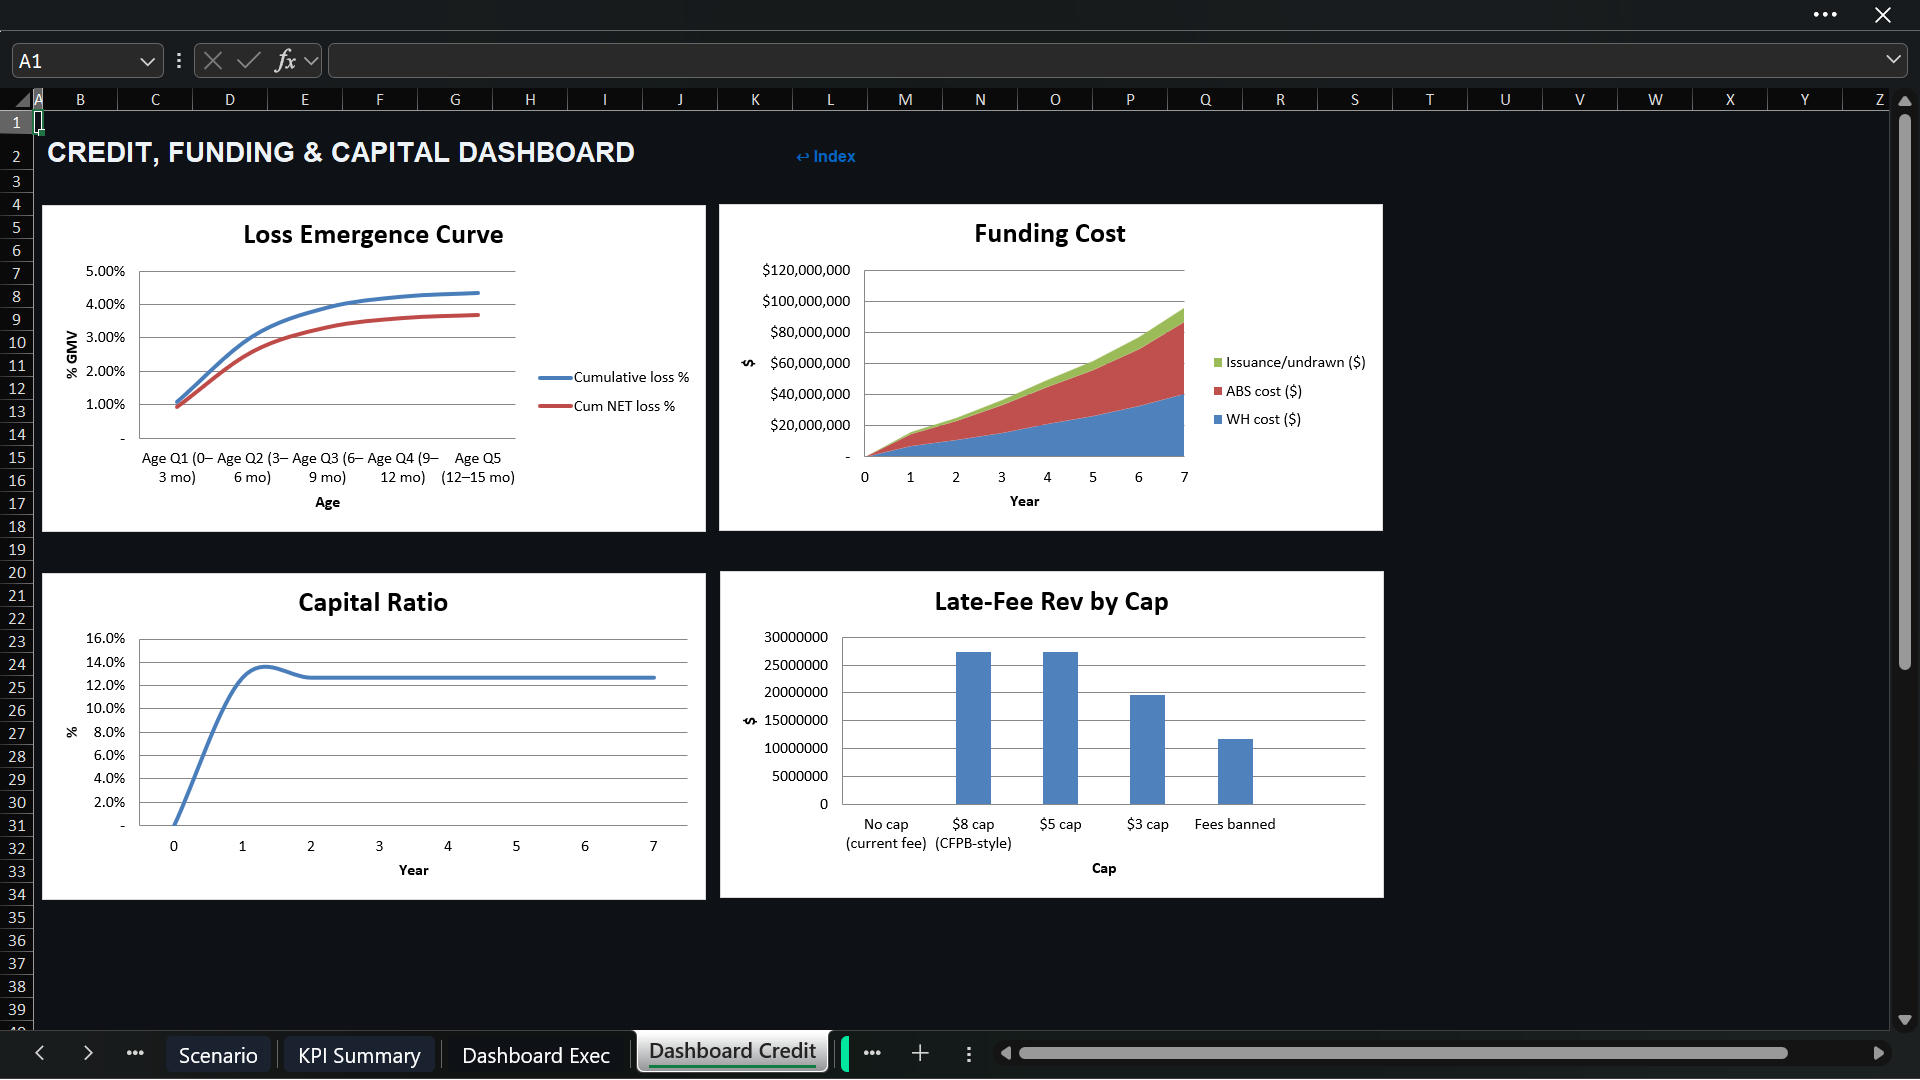
  • Credit, Funding & Capital Dashboard: loss-emergence curve, funding-cost stack, capital ratio, and late-fee revenue by regulatory case.
The workbook contains 23 embedded Excel charts across calculation sheets and dashboards.

โœ… AUDITABILITY, CONTROLS & DOCUMENTATION
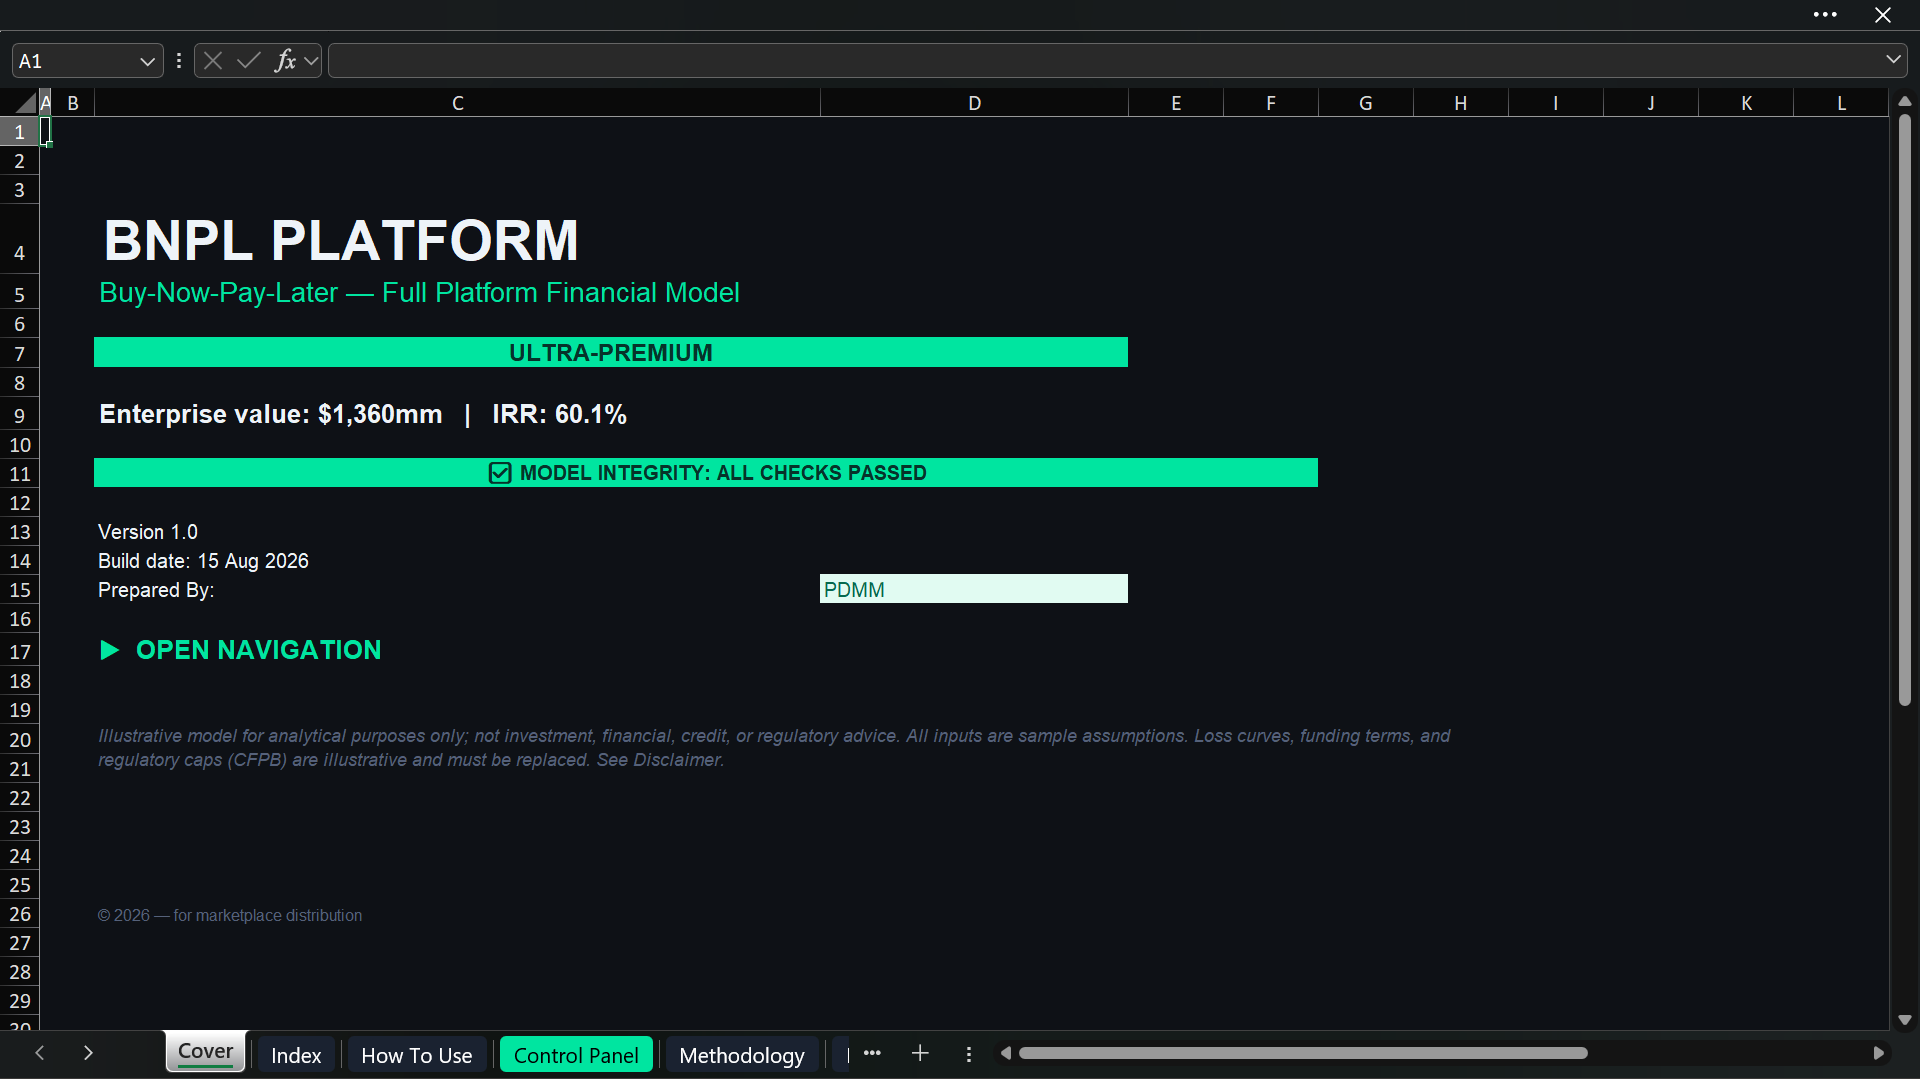
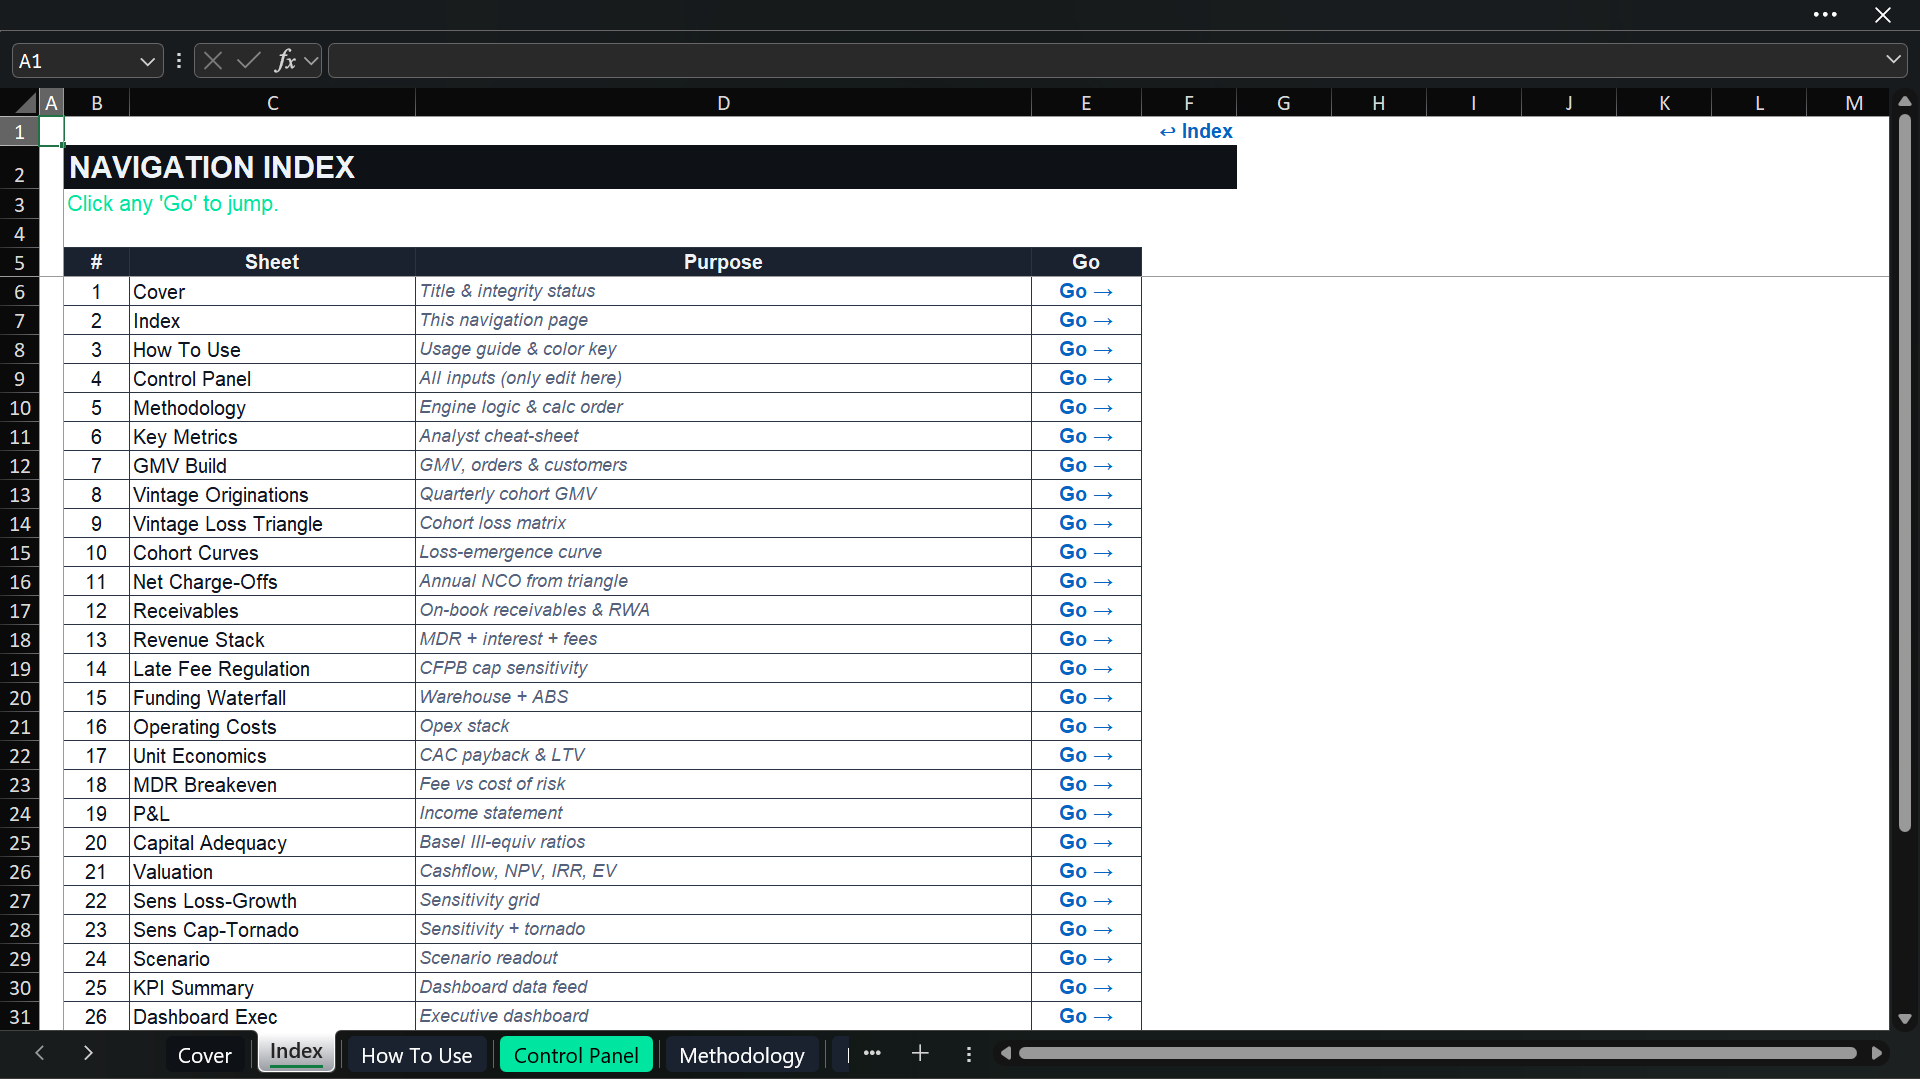
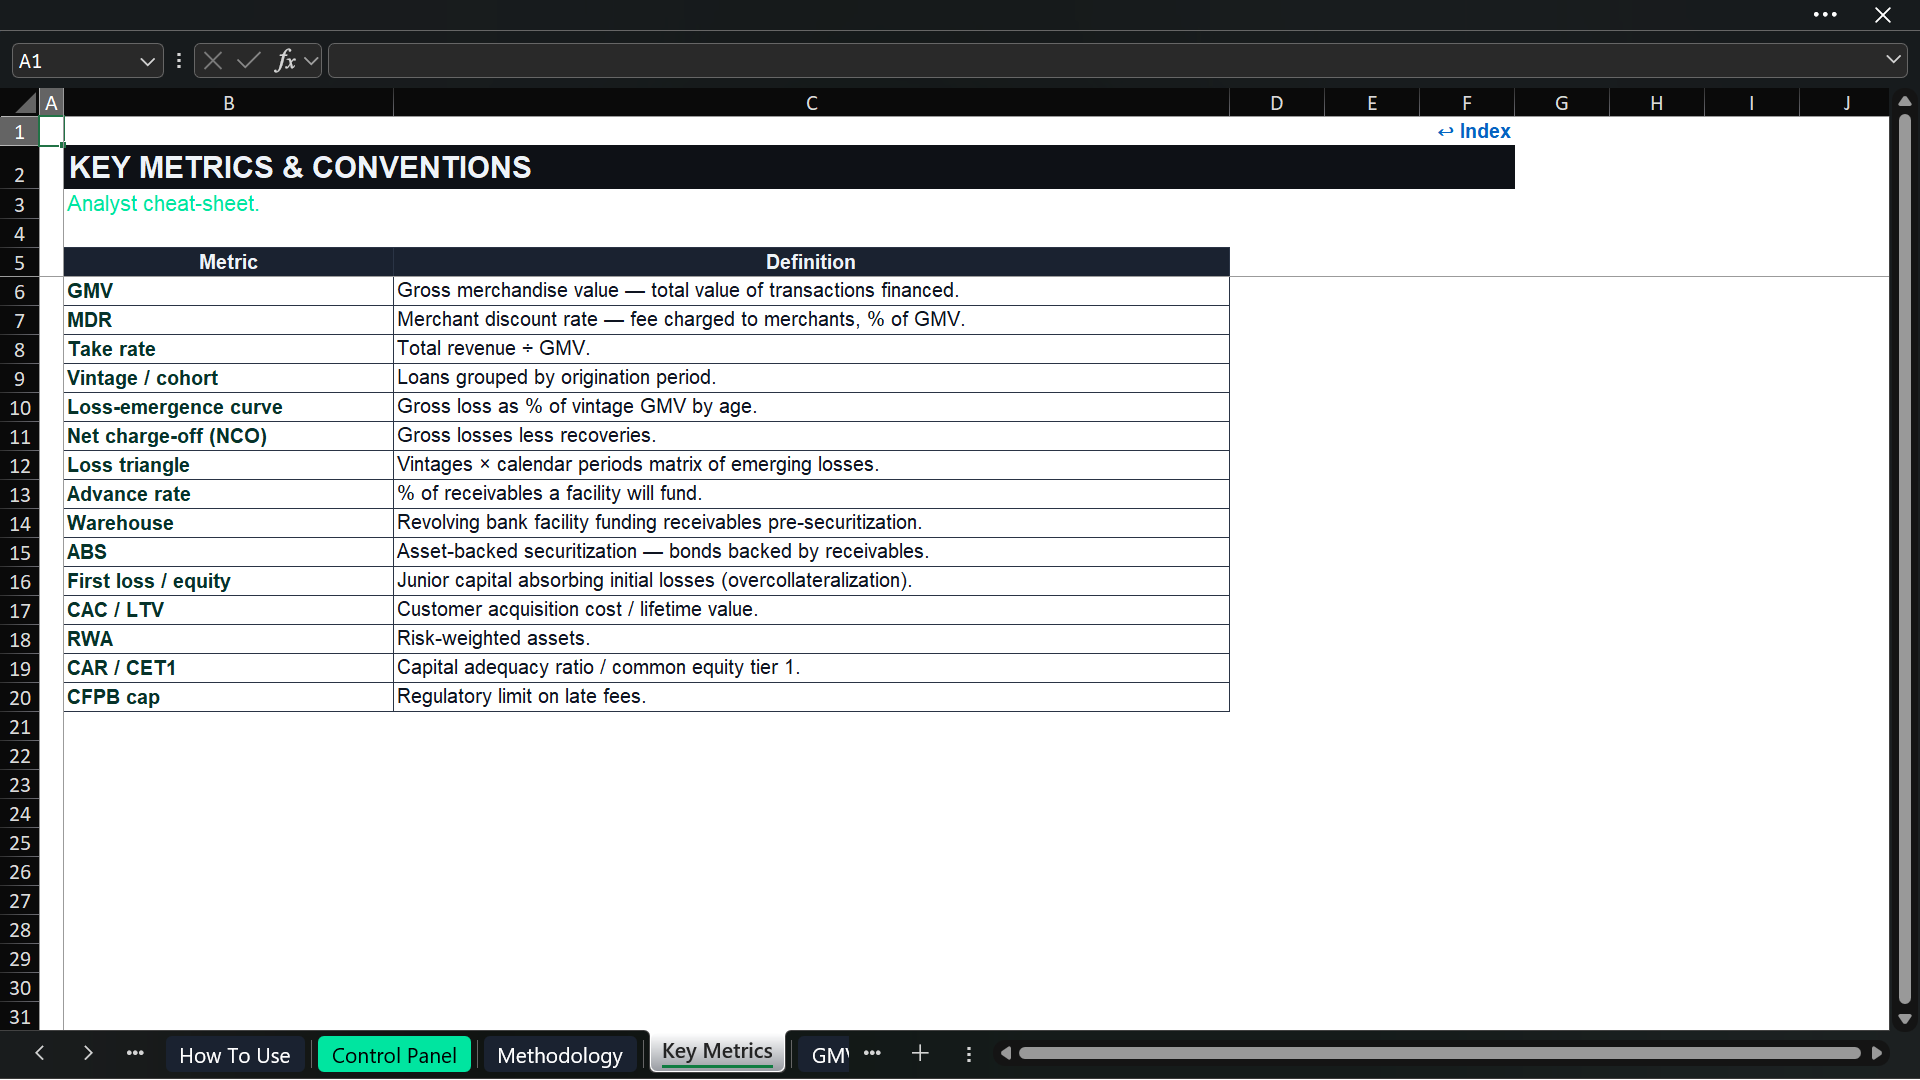
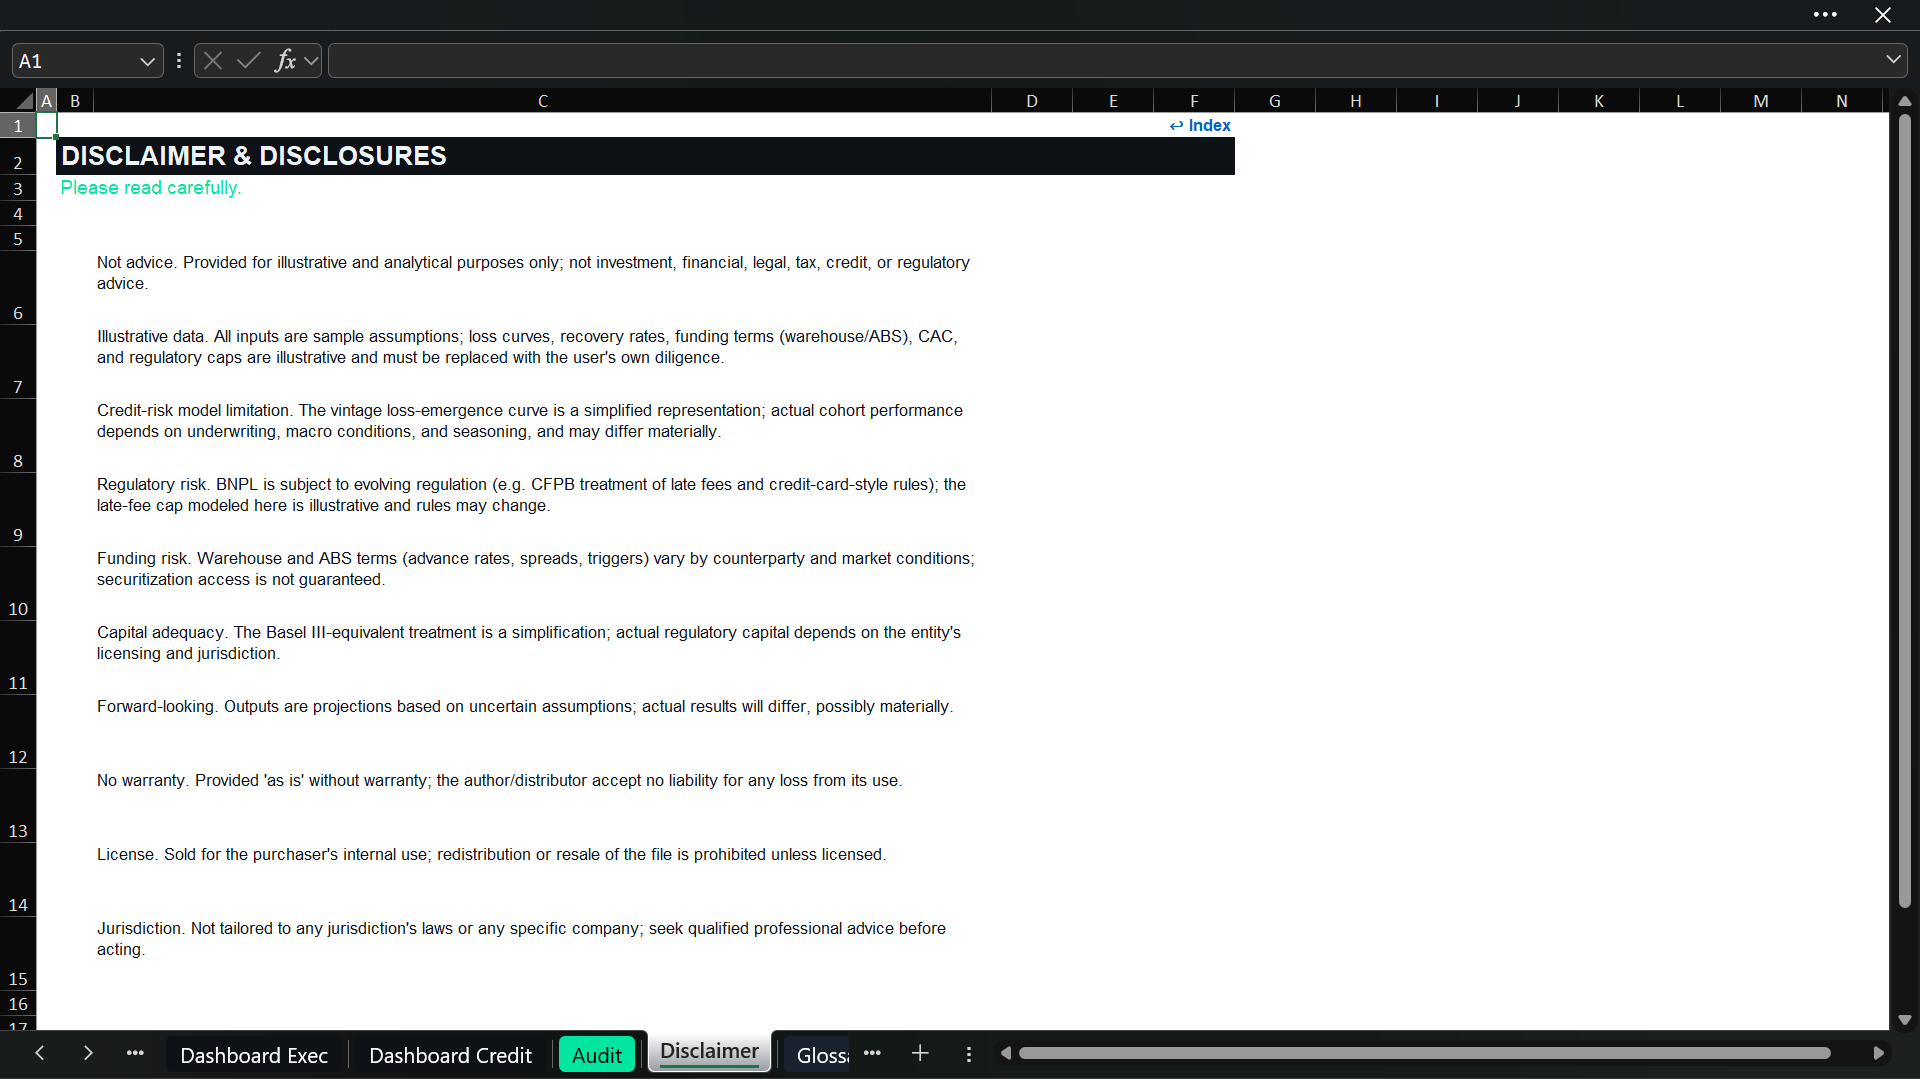
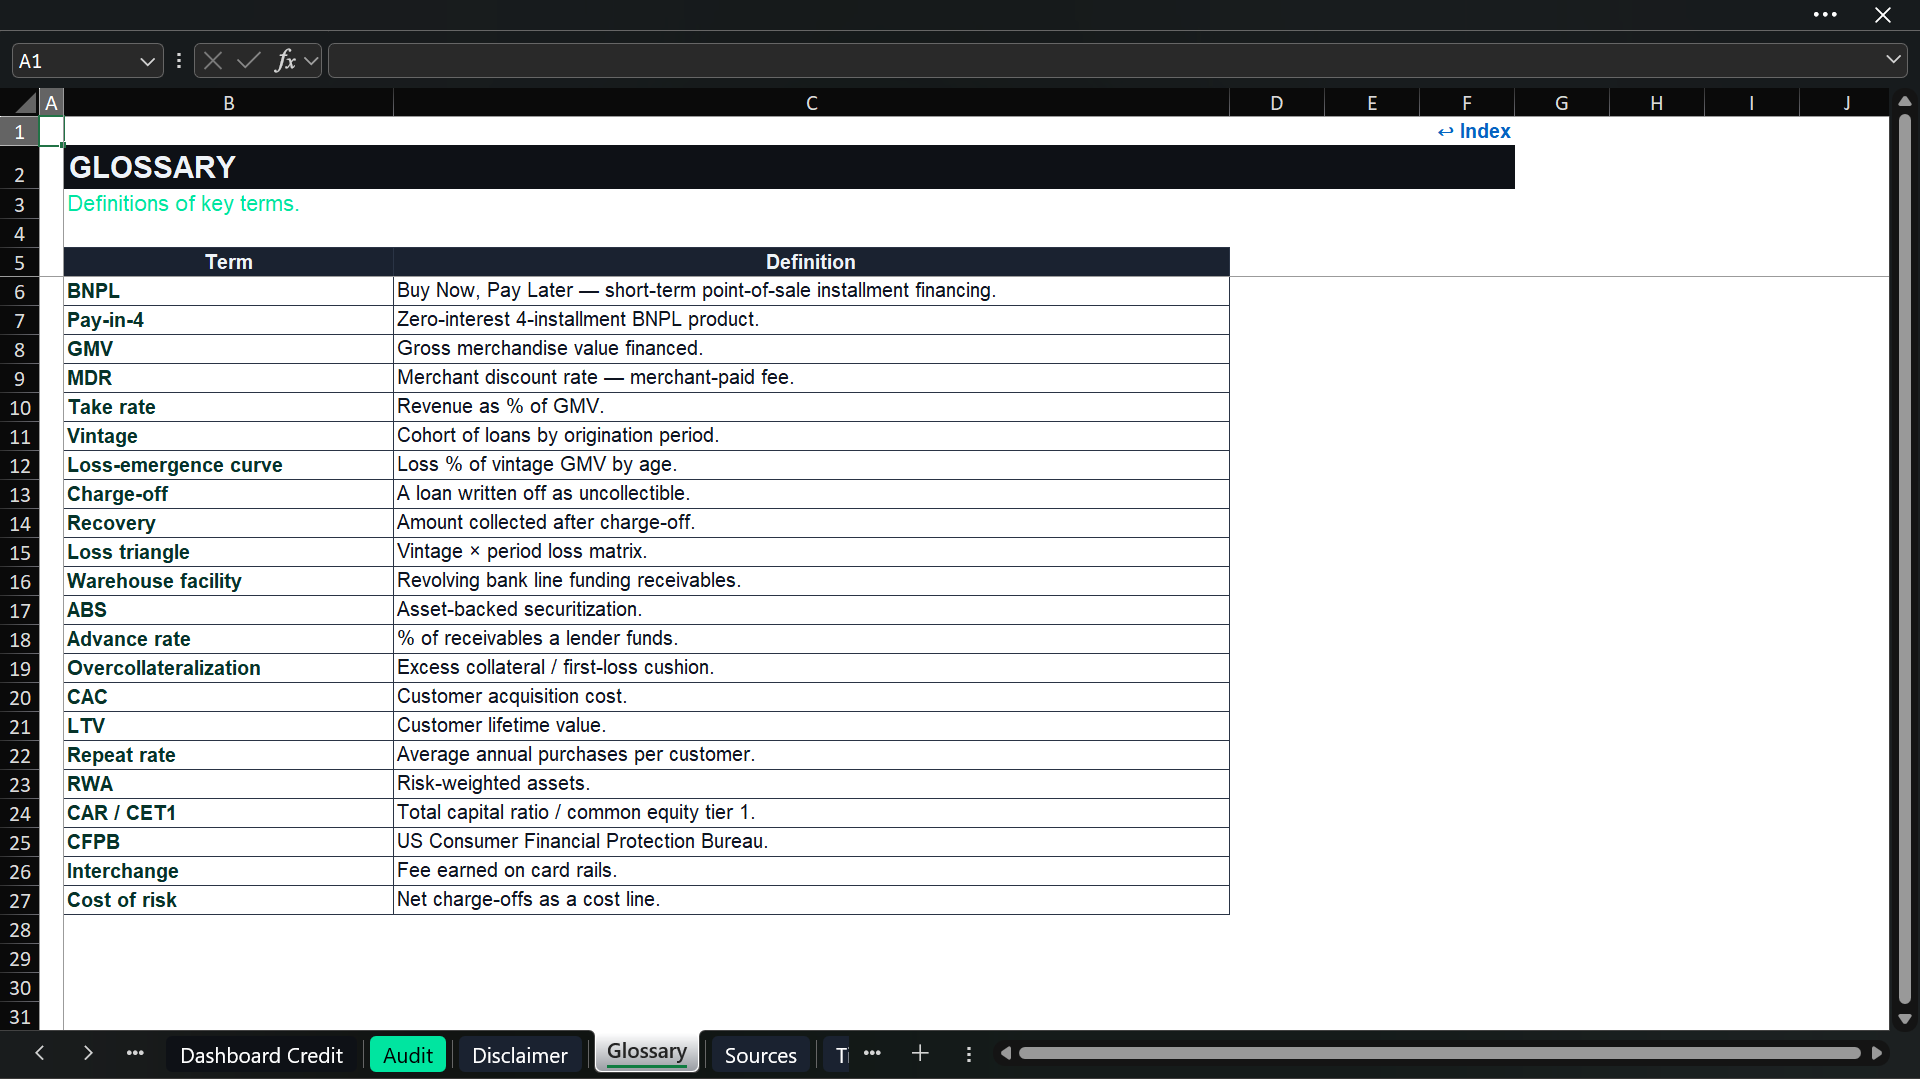
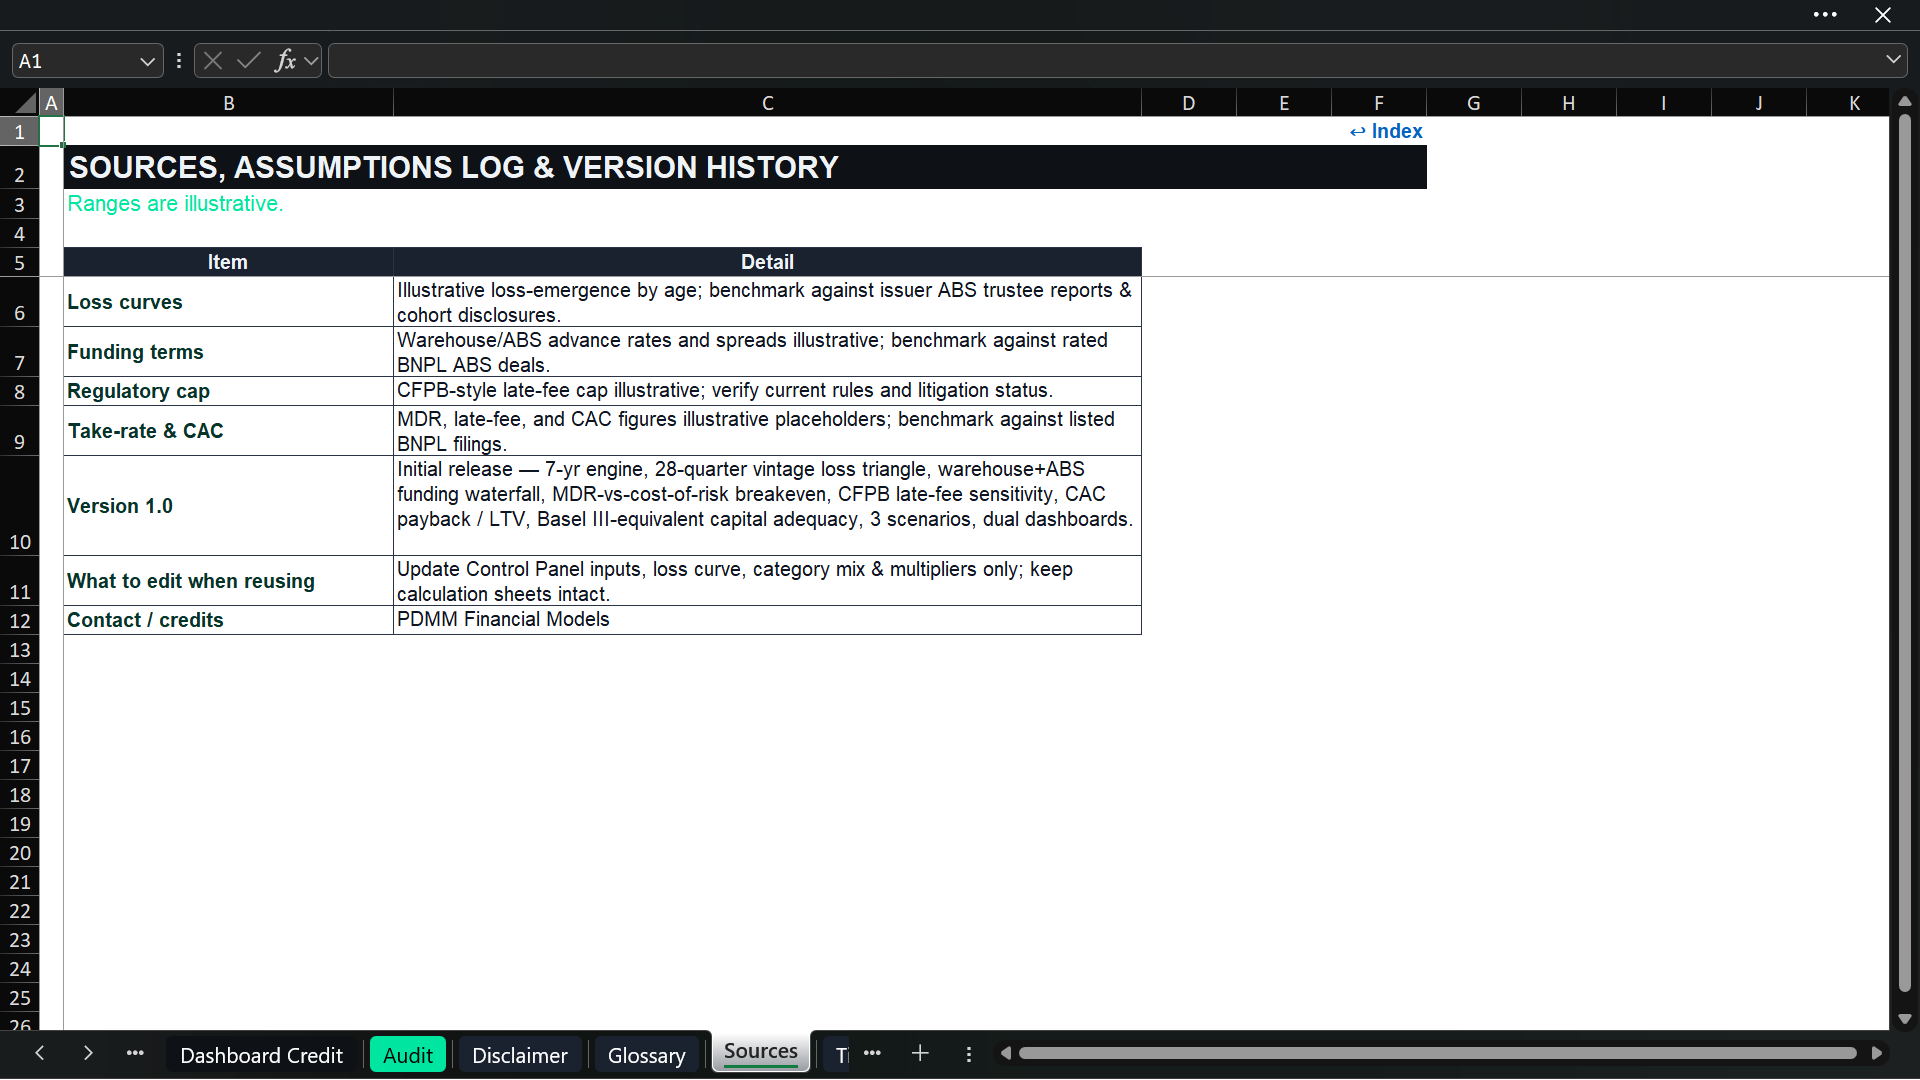
The 32-sheet workbook includes a Cover, navigation Index, How to Use guide, methodology, key-metric definitions, assumptions, calculations, dashboards, Audit sheet, disclaimer, glossary, sources log, and timeline.
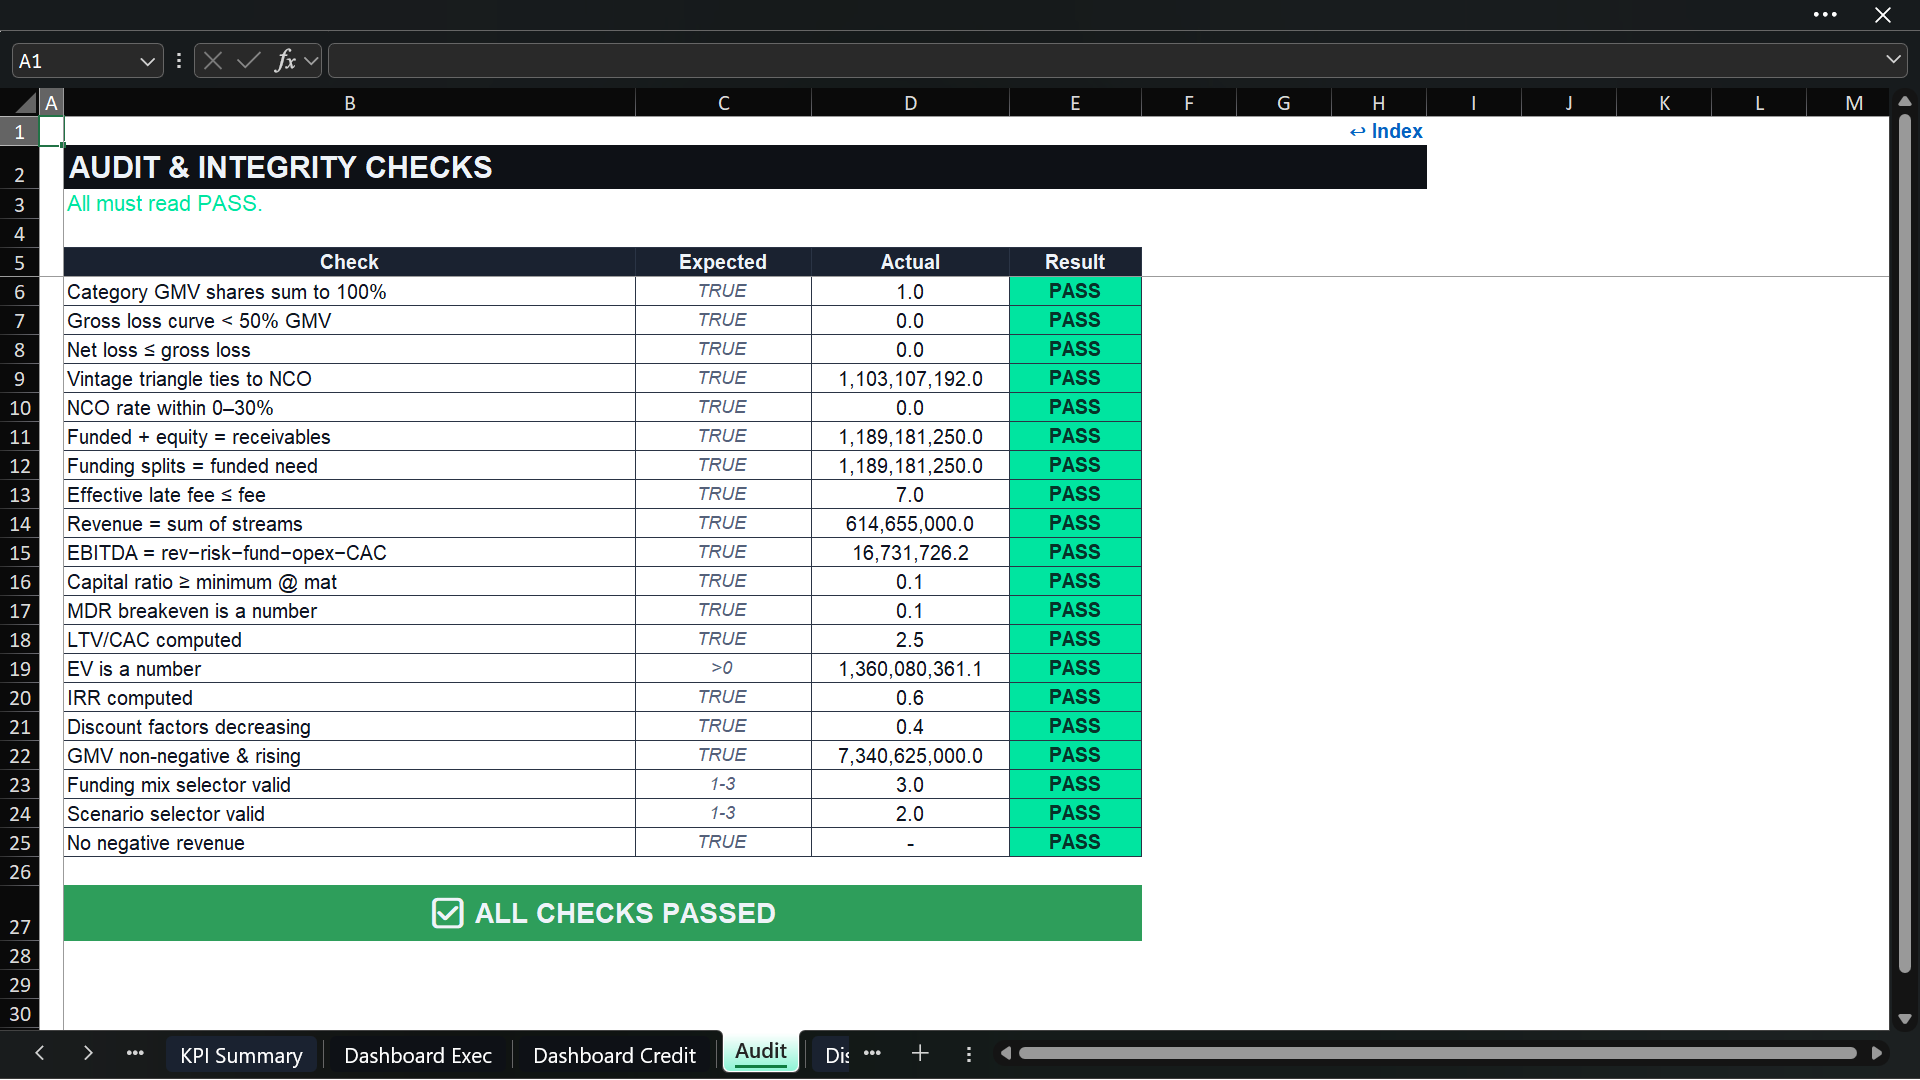
Twenty formula-driven checks cover portfolio shares, loss-curve limits, recoveries, triangle reconciliation, net charge-off rates, receivables funding, late fees, revenue, EBITDA, capital ratio, merchant-fee breakeven output, LTV/CAC, enterprise value, IRR, discount factors, GMV, funding and scenario selectors, and non-negative revenue. The supplied base case reads โ€œALL CHECKS PASSED.โ€
The file is fully editable and macro-free. Formulas remain visible, inputs are centralized, and calculation sheets are linked rather than populated with pasted outputs.

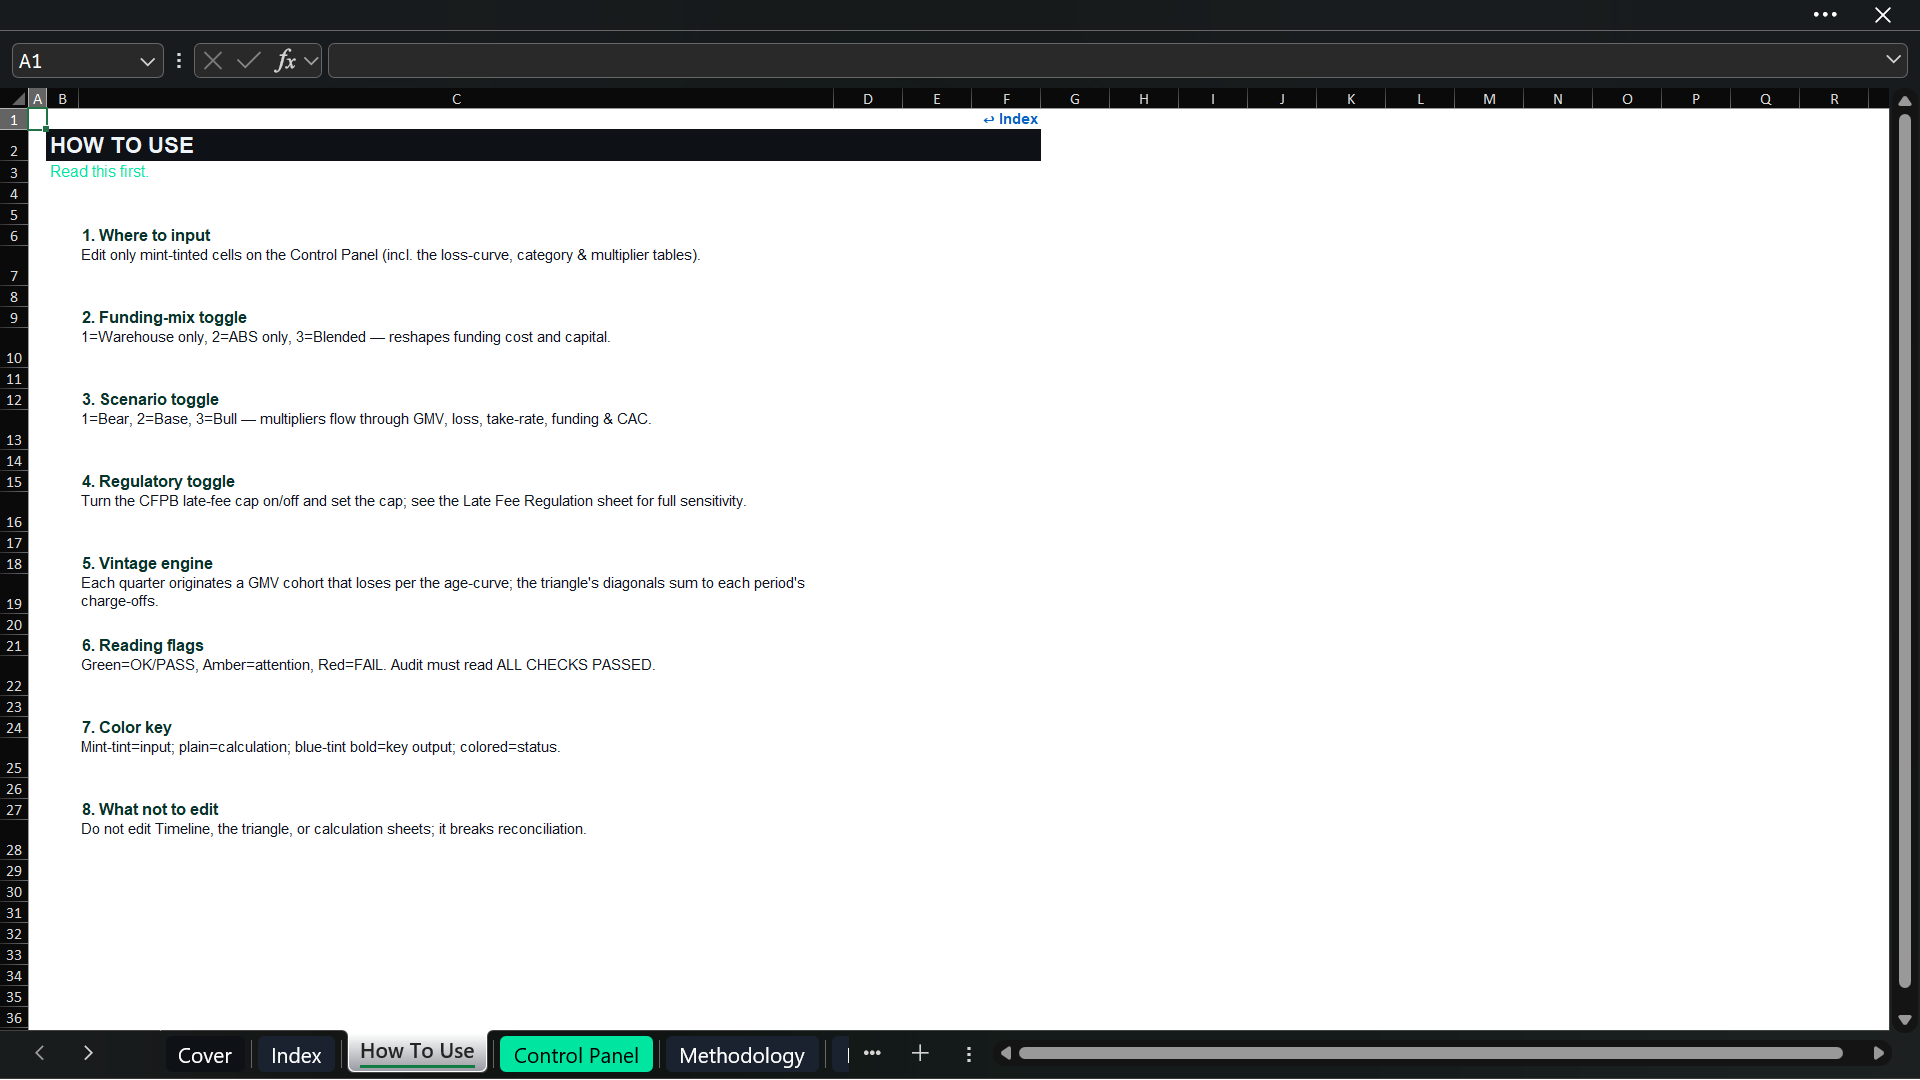
๐Ÿ› ๏ธ HOW TO USE THE MODEL
  1. Read the Cover, How to Use, Methodology, and Key Metrics sheets.
  2. Edit only the mint-tinted cells on the Control Panel.
  3. Replace the sample GMV, customer, pricing, loss, recovery, funding, cost, regulatory, capital, tax, and valuation inputs.
  4. Confirm merchant-category shares total 100% and review the five-quarter loss curve.
  5. Select warehouse, ABS, or blended funding and choose Bear, Base, or Bull.
  6. Review the loss triangle, NCO, receivables, revenue, funding, unit economics, P&L, capital, and valuation schedules.
  7. Use both dashboards and sensitivity views for decision discussions.
  8. Confirm every validation flag is OK and the Audit sheet reads โ€œALL CHECKS PASSED.โ€

๐Ÿ‘ฅ WHO SHOULD USE THIS TEMPLATE?
  • BNPL and embedded-finance founders preparing a business case.
  • Credit-risk teams building or challenging portfolio loss expectations.
  • Treasury and capital-markets teams assessing warehouse and ABS funding.
  • Investors, lenders, and strategic buyers performing preliminary diligence.
  • Consultants and analysts preparing fintech feasibility or valuation work.
  • Finance teams evaluating growth, unit economics, capital needs, and profitability.

This Best Practice includes
1 Fully Editable Excel Model

Acquire business license for $80.00

Add to cart

Add to bookmarks

Discuss

Further information

Forecast BNPL GMV, transactions, customers, active loans, and receivables over seven years.
Model the timing of credit losses through quarterly vintages and a loss-emergence triangle.
Estimate gross losses, recoveries, net charge-offs, and mature portfolio loss rates.
Test merchant-category mix, repeat frequency, and risk concentration.
Build revenue from MDR, consumer interest, late fees, and interchange or other income.
Measure the effect of alternative late-fee caps and a potential fee ban.
Compare warehouse, ABS, and blended receivables-funding structures.
Calculate funding cost, first-loss capital, risk-weighted assets, and capital adequacy.
Evaluate contribution per order, lifetime value, LTV/CAC, and CAC payback.
Assess merchant-fee breakeven against credit, funding, processing, and fraud costs.
Produce a linked P&L, free cash flow, NPV, enterprise value, project IRR, and funding requirement.
Compare scenarios and identify the drivers with the greatest potential effect on value.

You are launching, operating, investing in, or advising a BNPL or embedded-finance platform.
You need an initial feasibility case linking growth to delayed cohort credit losses.
You want to build or challenge a quarterly vintage loss-emergence assumption.
You need to evaluate multiple merchant and consumer revenue streams.
You want to compare warehouse facilities, ABS securitization, and blended funding.
You need to estimate first-loss capital and simplified risk-based capital adequacy.
You are assessing customer contribution, LTV/CAC, CAC payback, and profitability.
You need a seven-year unlevered valuation with NPV, exit value, IRR, and peak equity funding.
You want dashboards, scenarios, sensitivity views, and audit controls in one editable workbook.
You have platform-specific data to replace the illustrative inputs.

You need a loan-level underwriting, servicing, billing, collections, or ledger system.
You require borrower credit scores, approval rules, fraud models, or expected-credit-loss accounting by individual loan.
You need a detailed monthly liquidity forecast or daily cash-management model.
You require a lender-specific borrowing base, eligibility tests, concentration limits, covenants, triggers, or amortization mechanics.
You need a complete ABS cash-flow waterfall with tranches, credit enhancement, excess spread, triggers, ratings, and bond yields.
You require a full three-statement accounting model with detailed balance sheet and cash-flow statement.
You need jurisdiction-specific Basel, prudential, consumer-credit, late-fee, or legal compliance calculations.
You require cap-table dilution, stock options, fundraising rounds, or an investor distribution waterfall.
You need sensitivities that fully recalculate every operating schedule for every grid point; the included grids are illustrative value-scaling views.
You plan to rely on the sample assumptions without validating them against actual portfolio, commercial, funding, and regulatory evidence.


0.0 / 5 (0 votes)

please wait...