Originally published: 11/03/2024 08:24
Publication number: ELQ-45844-1
View all versions & Certificate
Publication number: ELQ-45844-1
View all versions & Certificate

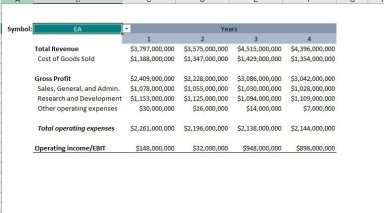
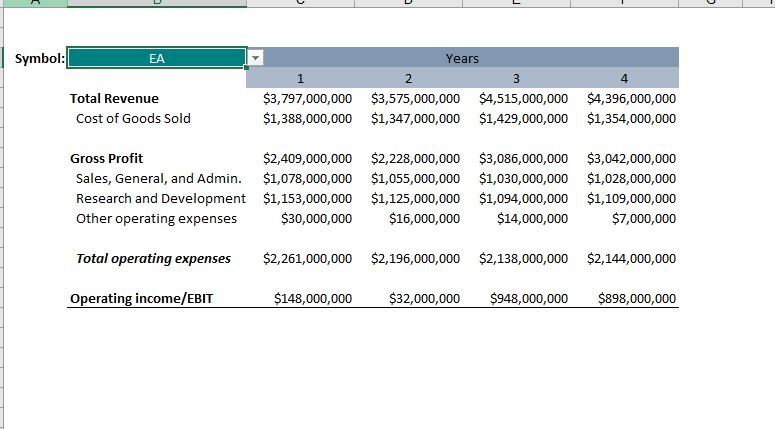
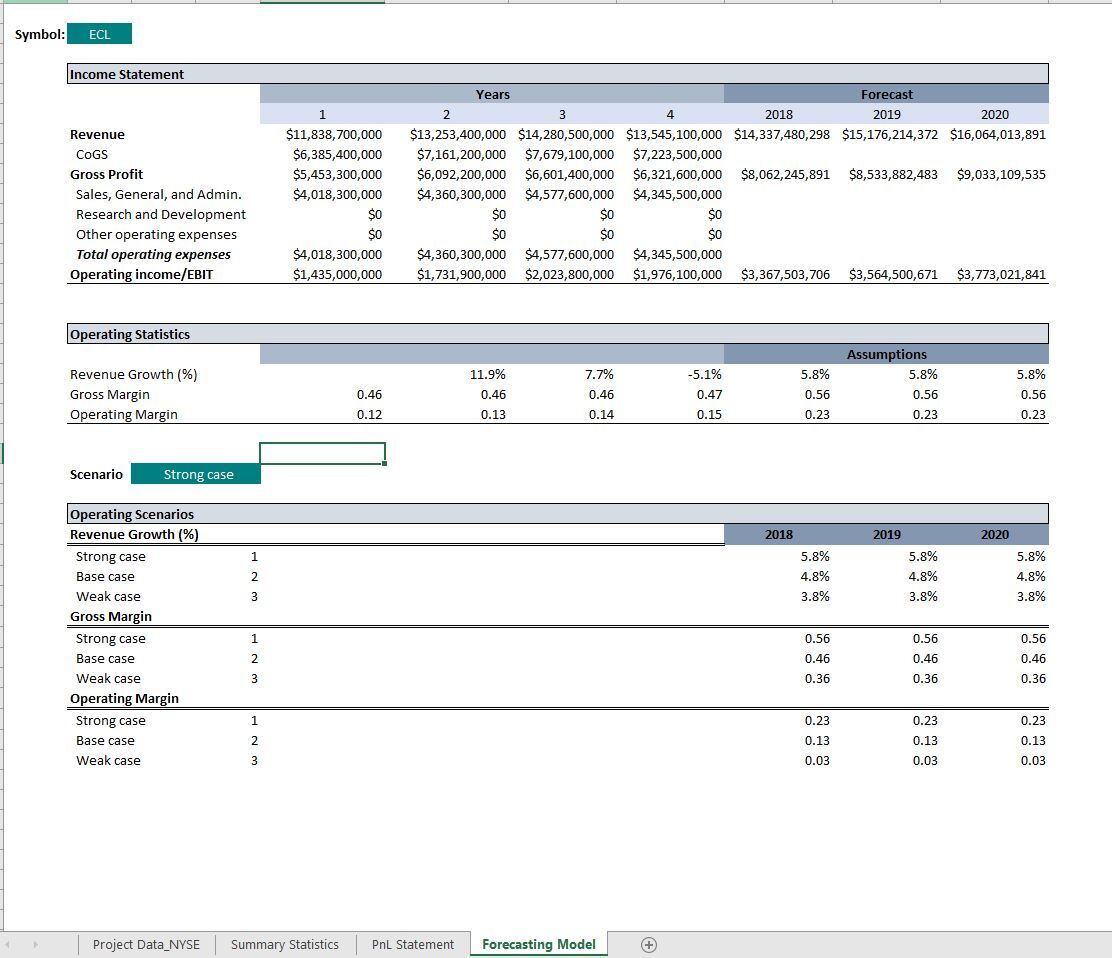
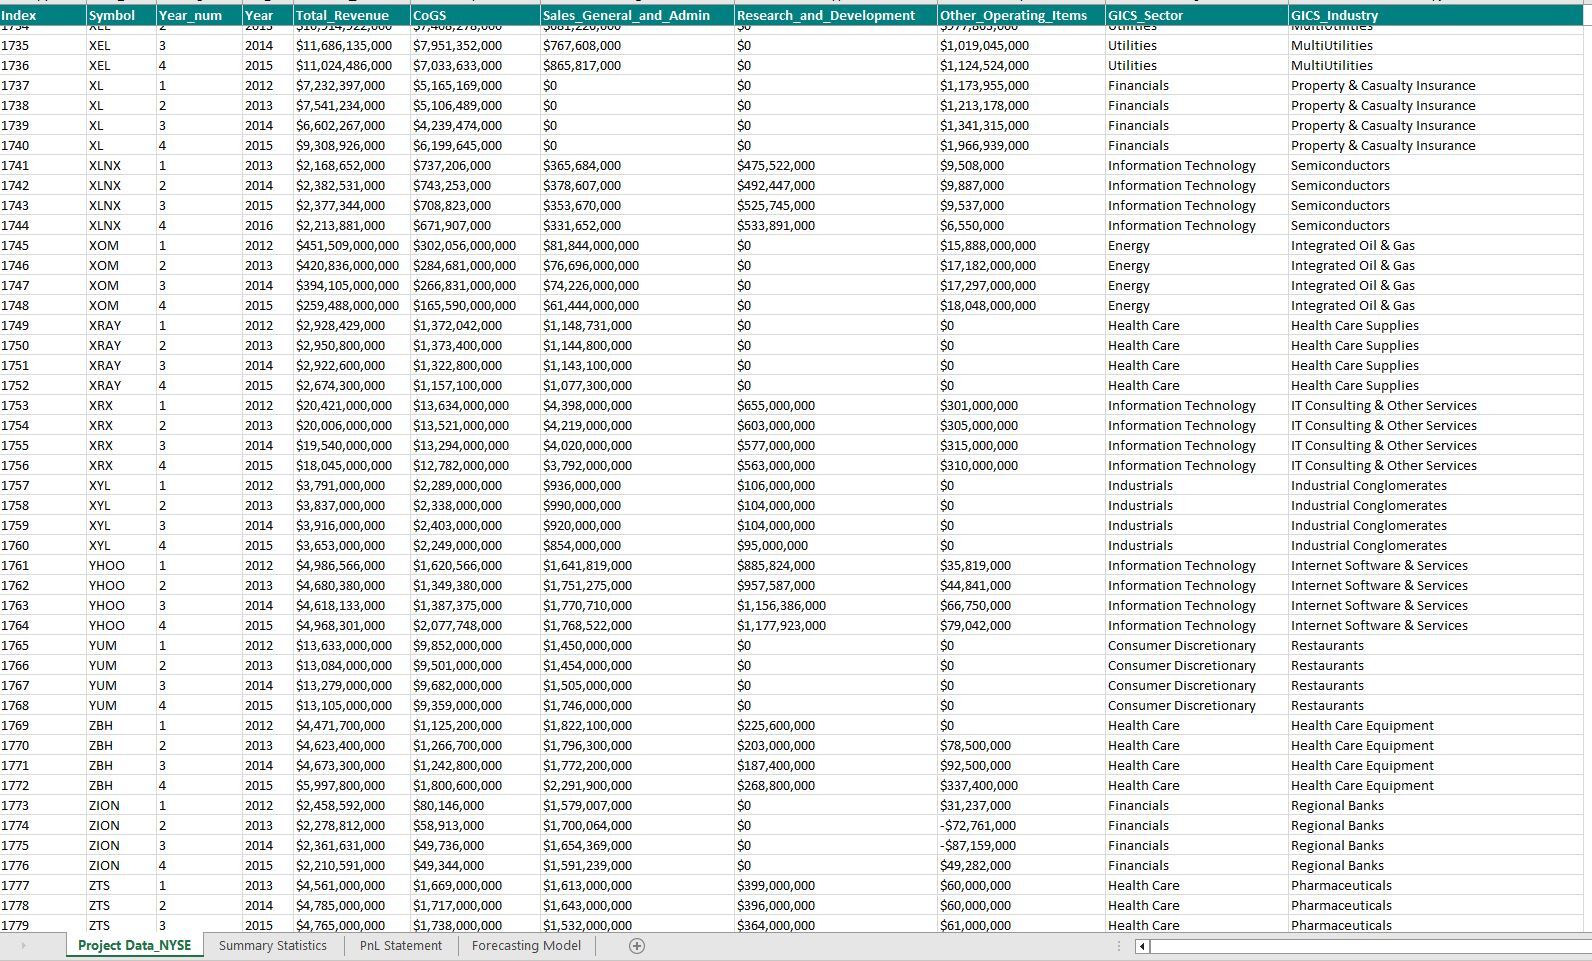
Financial Forecasting Model & PnL Statement
Excel Financial Forecasting Model and PnL Statement using historical NYSE data
Our online platform provides a wide range of engaging and useful templates that cater to various needs.Follow 85
Further information
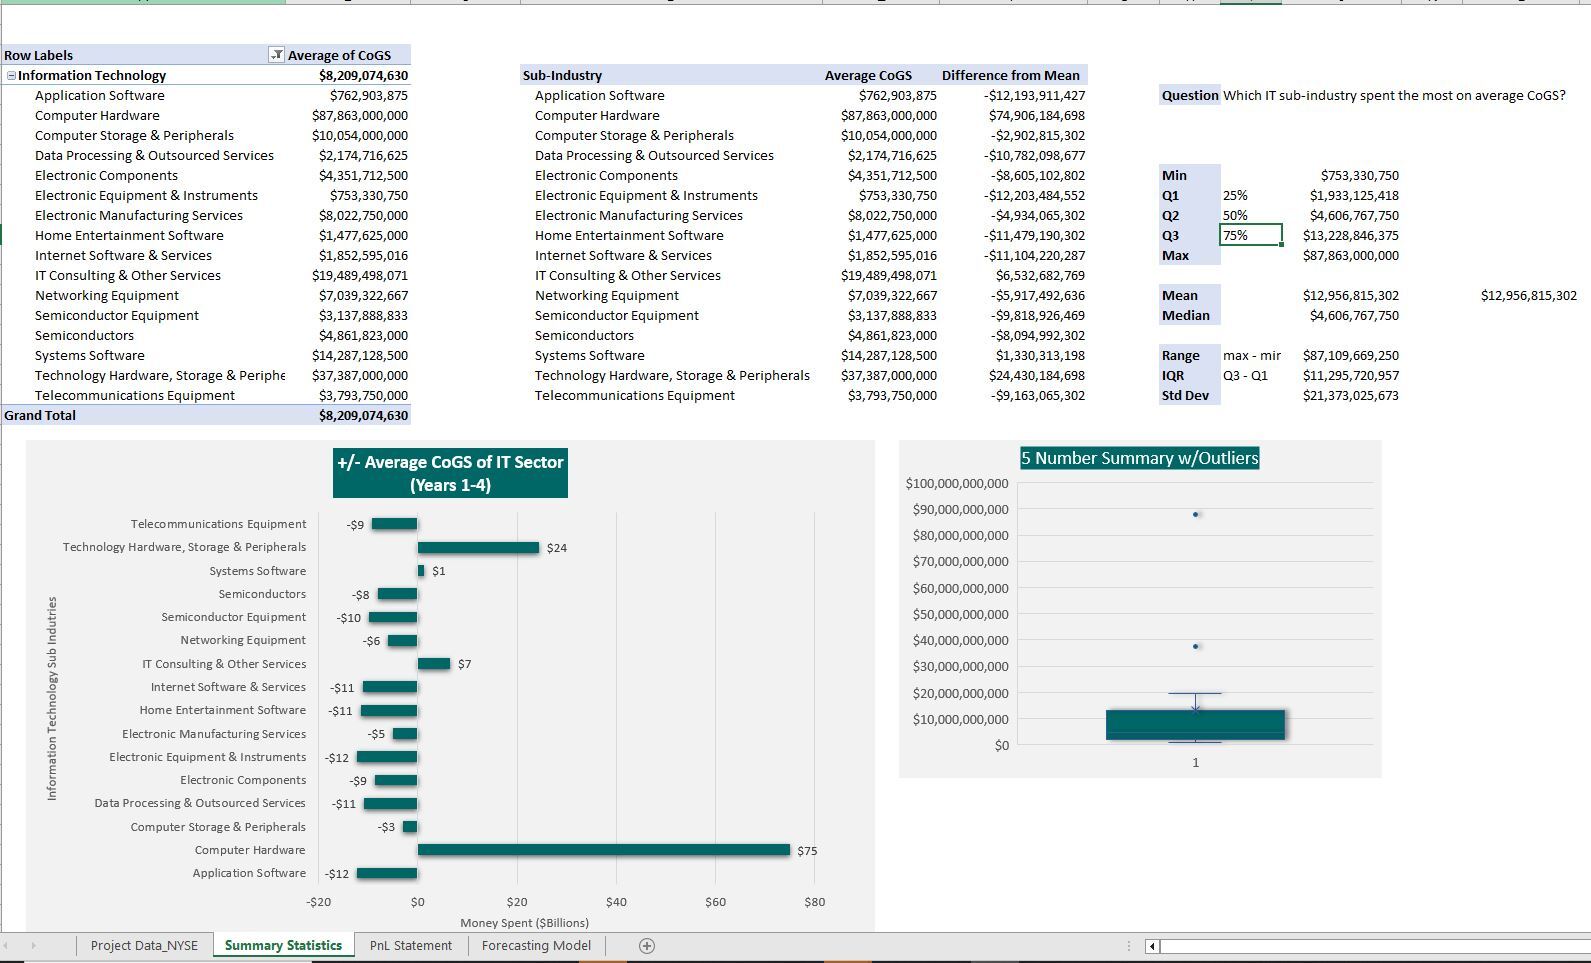
Dashboard
