
Multi-Year M&A / Merger Model — Accretion/Dilution, 5-Year Debt Schedule, PPA & EPS Bridge (Excel + Google Sheets)
Originally published: 26/07/2026 19:37
Publication number: ELQ-68195-1
View all versions & Certificate
certified

Multi-Year M&A / Merger Model — Accretion/Dilution, 5-Year Debt Schedule, PPA & EPS Bridge (Excel + Google Sheets)

A 9-tab Excel & Google-Sheets merger model: 5-year accretion/dilution on GAAP and cash-EPS bases, a debt schedule with no circular references, the as-reported C

Description
The M&A Merger Model — Multi-Year is a full merger-consequences model for investment-banking analysts, corporate-development teams, and senior finance students who must determine — and defend — whether an acquisition is accretive or dilutive to EPS across a five-year horizon.

 Enter the acquirer and target financials, the cash/stock/new-debt consideration, the synergies and tax, and the debt-sweep drivers, and the 5-year pro-forma EPS (on GAAP and cash bases), the accretive/dilutive verdict, the deleveraging debt schedule, the purchase-price allocation, and the balanced Sources & Uses all populate automatically.

The workbook ships pre-filled with a complete, fully sourced worked deal.This is a transparent model, not a black box.

Interest is charged on the beginning debt balance, so the debt schedule contains no circular reference and recalculates cleanly with iterative calculation off.
 It runs on arithmetic-only formulas, unchanged, in both Microsoft Excel and Google Sheets.

**What you get**
- A 5-year pro-forma EPS bridge with an explicit verdict, on GAAP and cash-EPS bases
- A cash/stock/new-debt consideration mix that charges each option its true after-tax earnings cost

- A 5-year debt schedule with mandatory maturities and a cash sweep — no circular reference- The as-reported purchase-price allocation with per-class intangible lives and amortization
- A balanced Sources & Uses that ties to zero

- A synergy sensitivity with a chart, and a dashboard with the multi-year accretion chart

- A real, fully sourced worked deal (CVS/Aetna) to study before changing a cell**Model structure — Excel (9 tabs)

**1. START HERE — what the model does, input order, and the method in plain English

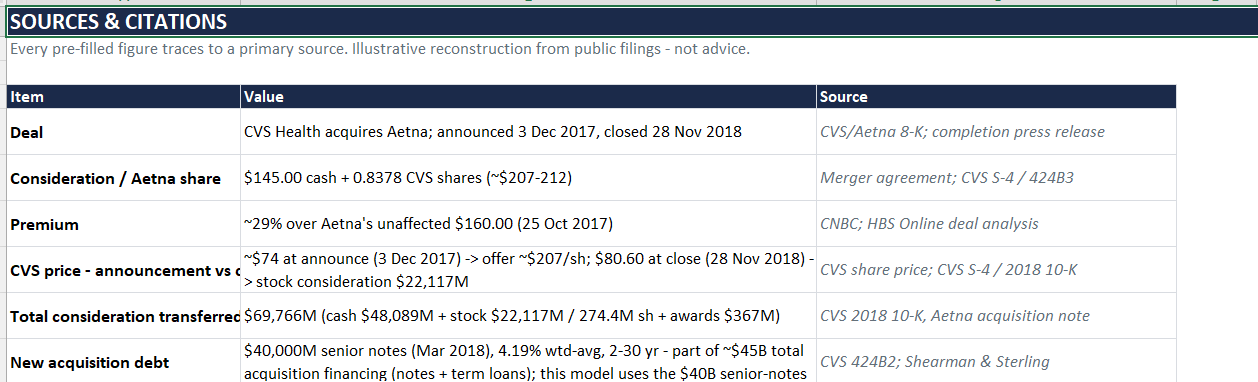
2. Sources — every pre-filled figure with its primary-source citation

3. Assumptions — acquirer & target financials, consideration, financing, synergies, tax, sweep drivers (all $M)

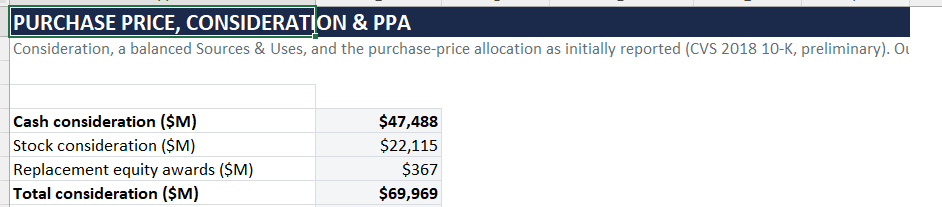
4. Purchase Price & PPA — consideration, balanced Sources & Uses, the as-reported intangible allocation + amort schedule

5. Debt Schedule — 5-year beginning-balance interest, mandatory maturities + cash sweep, deleveraging

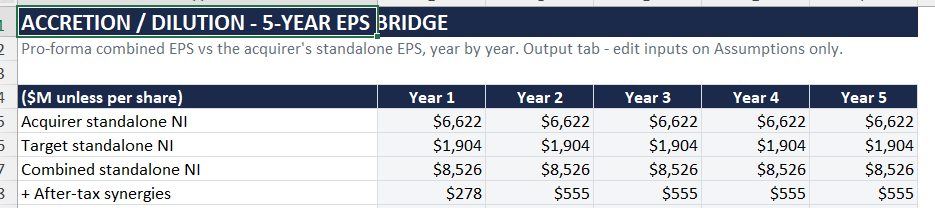
6. Accretion-Dilution — 5-year pro-forma EPS bridge vs standalone, GAAP and cash-EPS, with a verdict

7. Sensitivity — first-year accretion across a range of synergy levels, with a chart8. Dashboard — headline metrics and the multi-year accretion chart

9. License — terms of use, disclaimer, limitation of liability

**Key methodological features**- 5-year accretion/dilution on both GAAP and cash (ex-intangible-amortization) EPS bases- Consideration mix done right: cash, stock, and new debt each carry their real earnings cost

- A debt schedule with no circular reference, mandatory maturities, and a cash sweep- The as-reported purchase-price allocation with per-class intangible lives

- A Sources & Uses that balances exactly; input validation on every input cell- Arithmetic-only

— Excel and Google Sheets; no macros, no VBA, no add-ins

**See it working

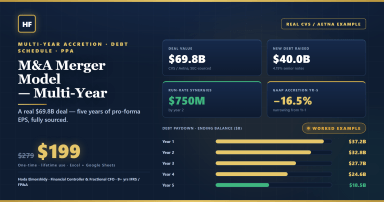
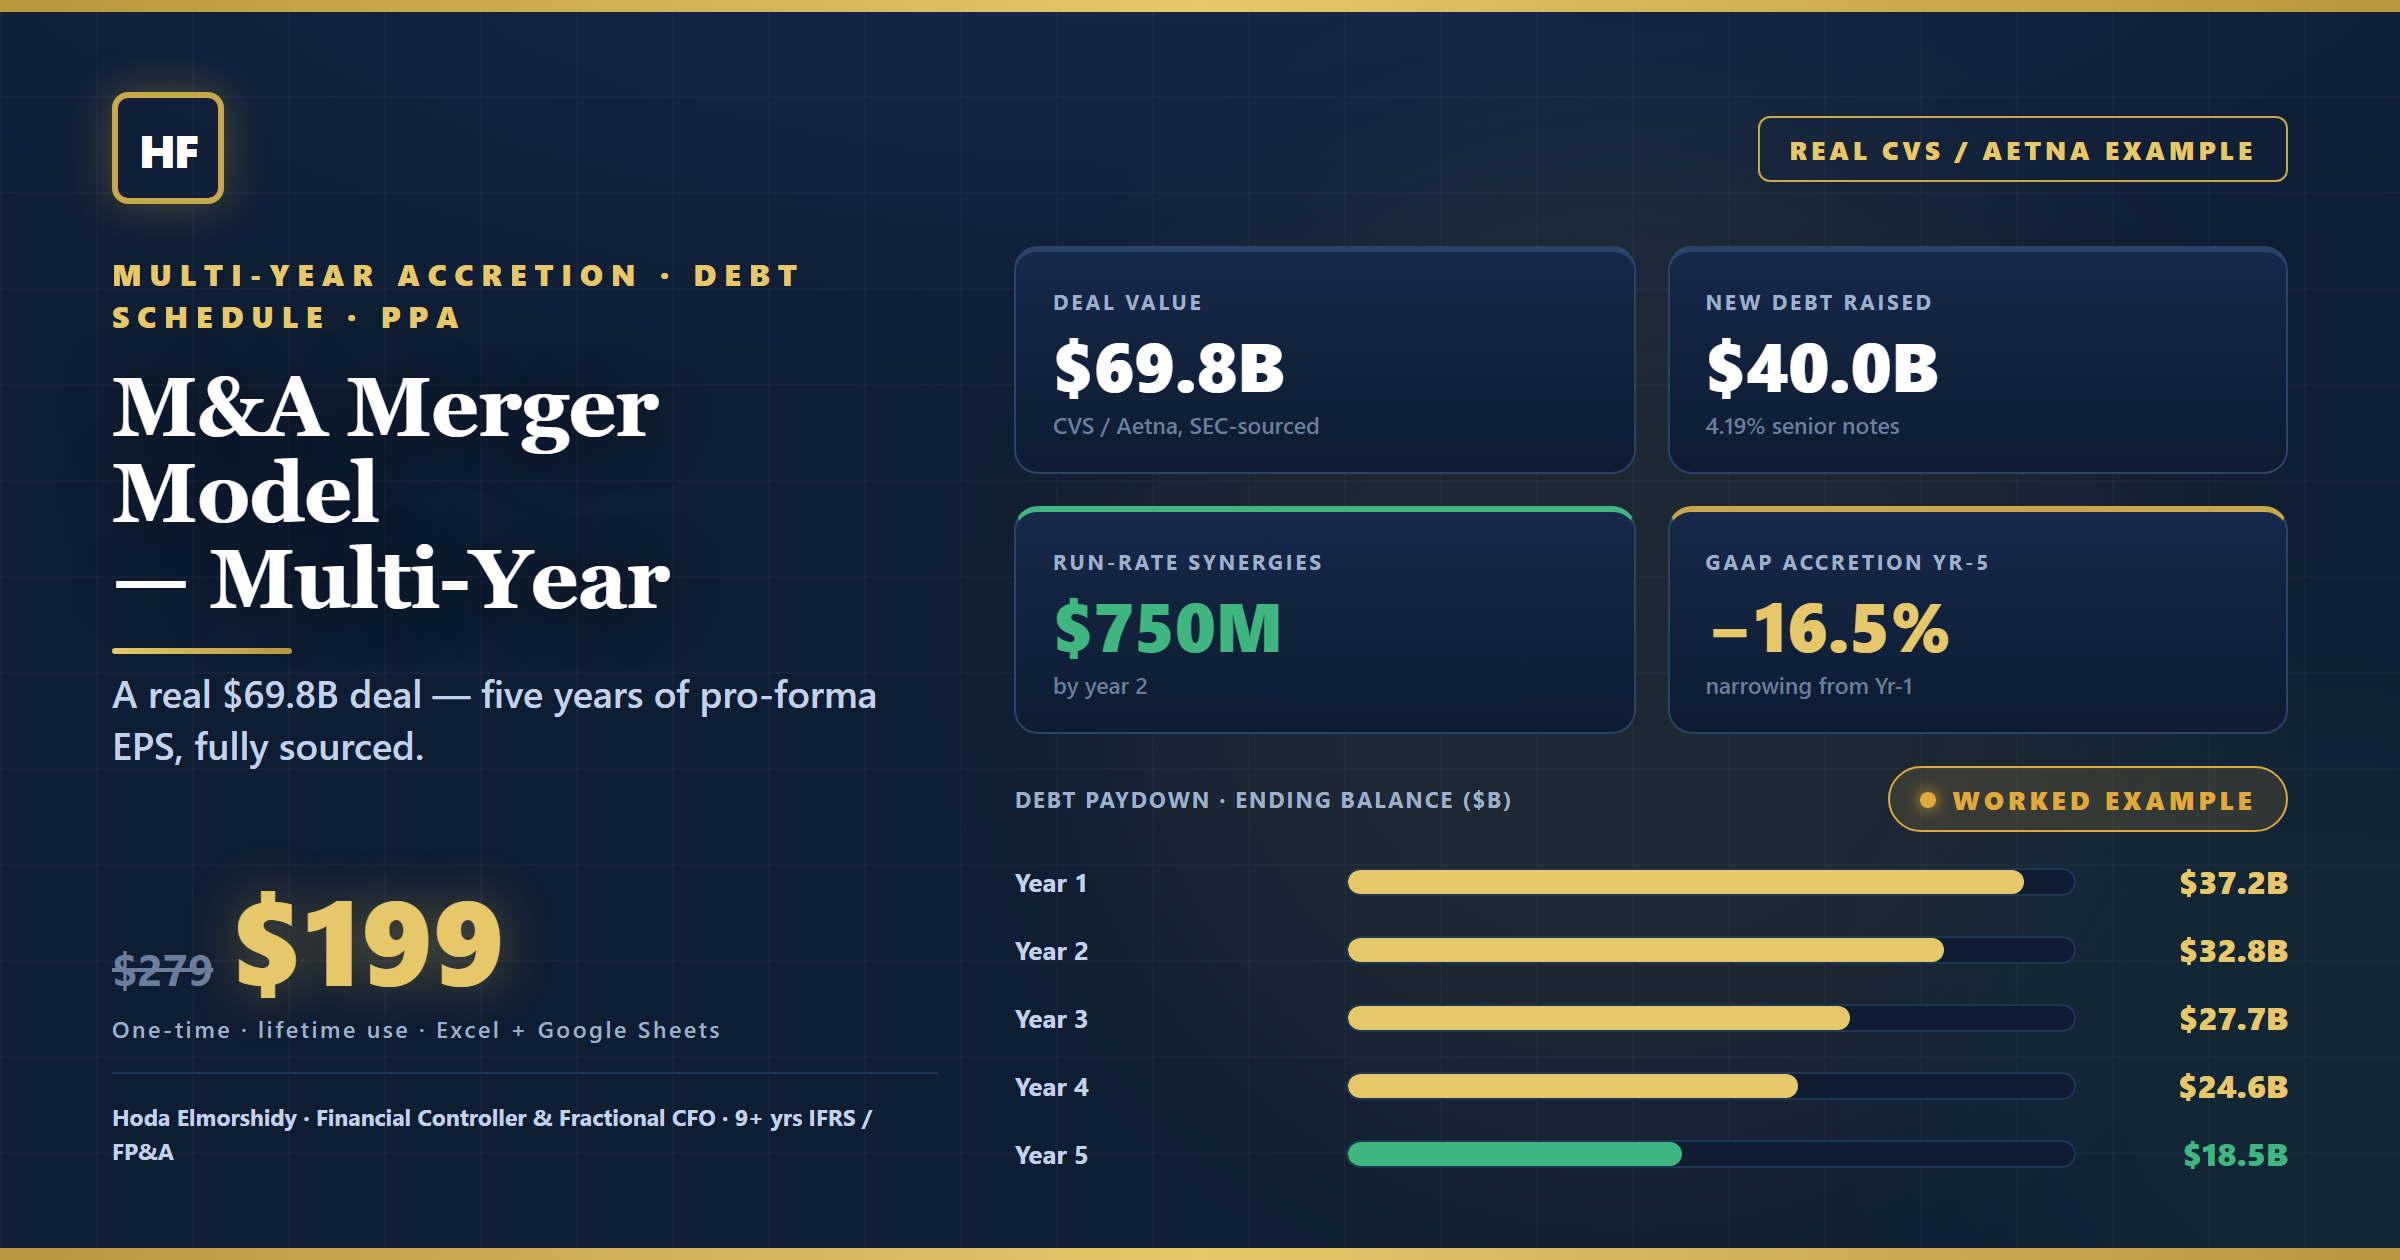
**Pre-loaded with the real CVS Health / Aetna deal: $145.00 cash + 0.8378 CVS shares per Aetna share (~$207 offer, ~29% premium), ~$69.8B consideration, $40.0B new notes at 4.19%, $750M synergies by year two, and CVS's as-reported PPA ($46.7B goodwill, $23.7B intangibles).

 On a trailing-FY2017, zero-growth, no-step-up GAAP basis the deal is dilutive and narrows from −29.7% (Yr 1) to −16.5% (Yr 5) as synergies ramp, debt deleverages $40.0B → $18.5B, and the 3-year tech intangible rolls off; on a cash-EPS basis it is −11.2% to −2.3%. Replace the inputs with your own deal and every output re-prices.


─── ABOUT THE AUTHOR & DISCLAIMER ───
Built by Hoda Elmorshidy — Financial Controller & Fractional CFO, 9+ years in
IFRS reporting, FP&A, commodity trading · CFO/board reporting · UAE VAT &
Corporate Tax and finance automation. Practitioner-grade, not generic.
LICENSE — Single-user, non-transferable, perpetual license for your own or your
organization's internal use; no resale, redistribution, sublicensing, or
repackaging. Provided "as is" without warranty of any kind, express or implied,
including merchantability or fitness for a particular purpose. To the maximum
extent permitted by law, total liability for any claim arising from this product
is limited to the amount you paid for it; not liable for indirect, incidental, or
consequential losses. Nothing here limits rights that cannot be excluded under the
consumer-protection law of your jurisdiction. This purchase is governed by the
terms of the platform you bought it on (Eloquens) and the consumer-protection law
of your own country of residence.
DISCLAIMER — This template is an analytical and educational tool, not
professional financial, investment, tax, accounting, or legal advice, and its use
creates no professional relationship. All assumptions and figures are illustrative
— verify against your own data and current standards (IFRS/GAAP, tax rates) before
relying on any output. The author accepts no liability for decisions made using
this model. The pre-filled CVS Health / Aetna figures are an illustrative
reconstruction from public SEC filings (see the Sources tab), not affiliated with
or endorsed by either company. Business-combination accounting follows US GAAP
ASC 805 / IFRS 3; goodwill not amortized (ASC 350 / IAS 36). The PPA shown is CVS's
allocation as initially reported in the 2018 10-K, later finalized via
measurement-period adjustments in CVS's FY2019 10-K. Last reviewed: June 2026.
─── PRICING STEP ───
Price: $199 USD (compare-at $279; one-time, single-user license) — Excel + Google-Sheets-safe workbook + Methodology PDF
Royalty: confirm the live rate in your seller dashboard before publishing.
─── CONFIRM STEP ───
Note: Eloquens runs a publication review before the listing goes live — allow 1–2 days lead time.
Recommended: attach a free preview (sample-only or watermarked workbook) if a preview slot is
offered — on a curated finance marketplace, buyers convert better when they can see the
structure before paying $199.
────────────────── FAQs ──────────────────
Q: How is this different from a single-period accretion model?
A: It shows five years — accretion changes annually as the acquisition debt pays down and intangibles roll off — and it separates GAAP EPS from cash/adjusted EPS.
Q: Does the debt schedule have circular references?
A: No. Interest is on the beginning balance, so each year depends only on the prior year's ending balance — clean recalculation with iterative calc off.
Q: Is the CVS/Aetna data real?
A: Yes — an illustrative reconstruction from public SEC filings, every figure cited on the Sources tab. Not investment advice; not affiliated with or endorsed by either company.
Q: Does it work in Google Sheets?
A: Yes — a Google-Sheets-safe edition is included; arithmetic-only formulas. Charts may need a one-click refresh on import.
Q: Can I model an asset deal with a tax step-up?
A: Yes — toggle the intangible-amortization deductibility flag on the Assumptions tab.
Q: What's included?
A: Excel edition, Google-Sheets-safe edition, and the Methodology PDF — one download, one price ($199)

This Best Practice includes
- Format: .xlsx (Excel edition) + .xlsx (Google-Sheets-safe edition) + Methodology PDF - Compatibility: Excel 2016, 201

Acquire business license for $199.00

Add to cart

Add to bookmarks

Discuss

Further information

• Determine whether an acquisition is accretive or dilutive to pro-forma EPS over a five-year horizon, on GAAP and cash-EPS bases
• Model a cash/stock/new-debt consideration mix that charges each option its true after-tax earnings cost
• Build a 5-year debt schedule with mandatory maturities and a cash sweep — with no circular reference
• Apply the as-reported purchase-price allocation with per-class intangible lives and amortization
• Provide a transparent, fully traceable merger model — no black box — usable in both Excel and Google Sheets

• Single-acquirer / single-target deals with positive standalone earnings, modelled over a multi-year horizon
• Investment-banking analysts and corporate-development teams preparing accretion/dilution analysis
• Deals funded with a mix of cash, stock, and new debt that pays down over time
• Senior finance and MBA candidates learning the full merger-consequences build
• Users on Microsoft Excel 2016/2019/2021/365 or Google Sheets

• Full three-statement pro-forma consolidation with detailed combined balance sheets (use a 3-statement model)
• Leveraged-buyout sponsor-return analysis (use a dedicated LBO model)
• Multi-target roll-ups or staged/earn-out structures requiring bespoke build-outs
• Deals where the target has negative or non-forecastable earnings


0.0 / 5 (0 votes)

please wait...