Originally published: 02/11/2022 12:09
Last version published: 31/01/2024 10:11
Publication number: ELQ-95962-3
View all versions & Certificate
Last version published: 31/01/2024 10:11
Publication number: ELQ-95962-3
View all versions & Certificate

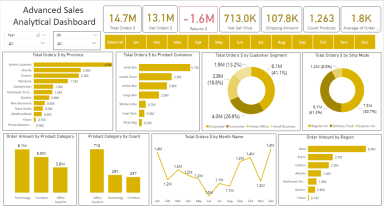
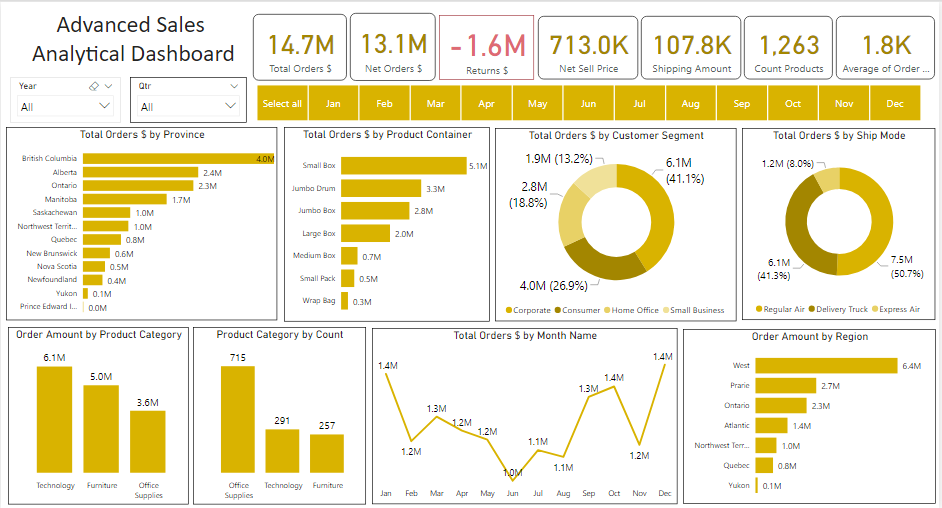
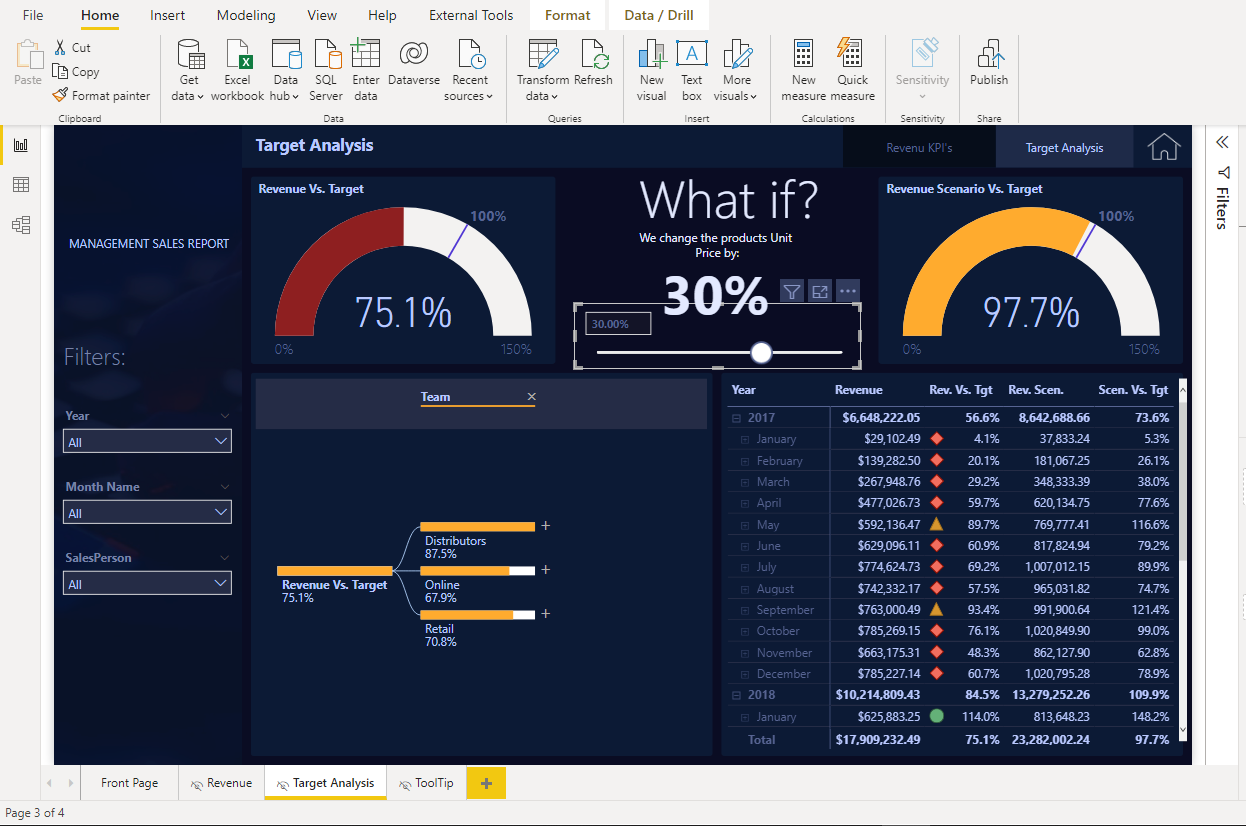
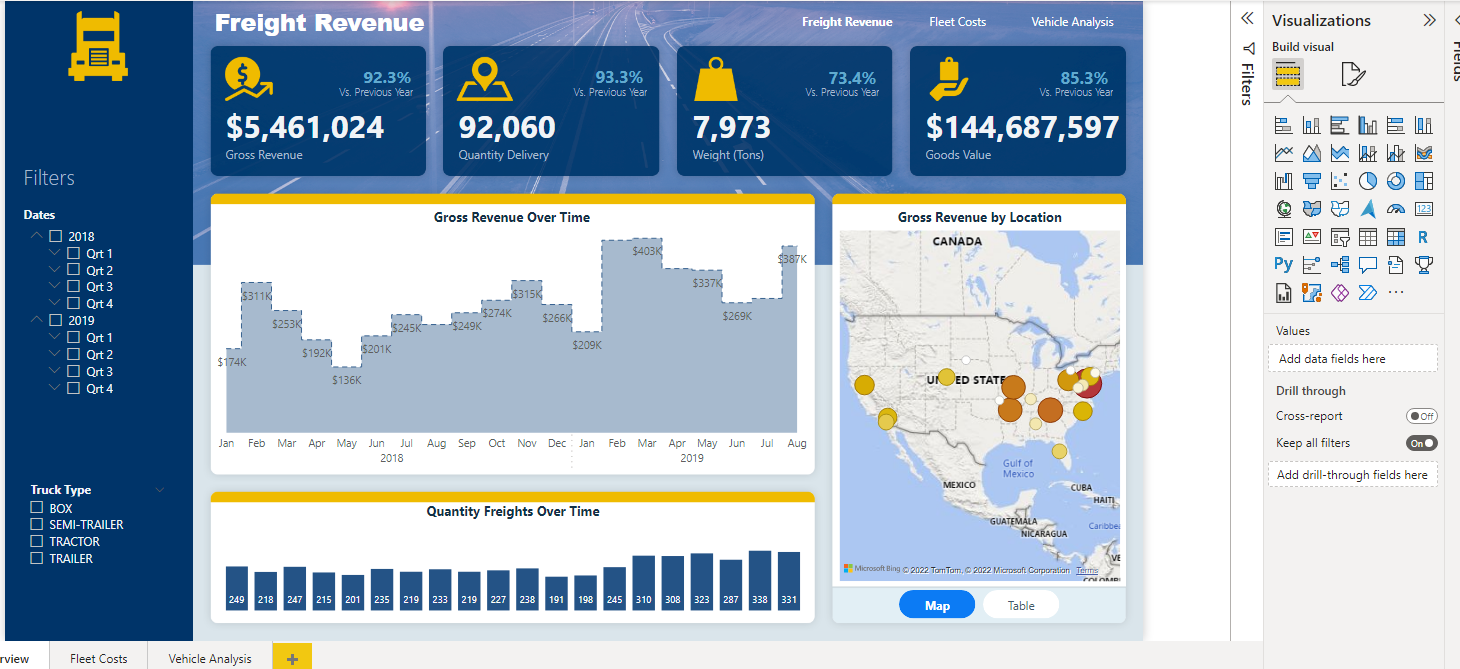
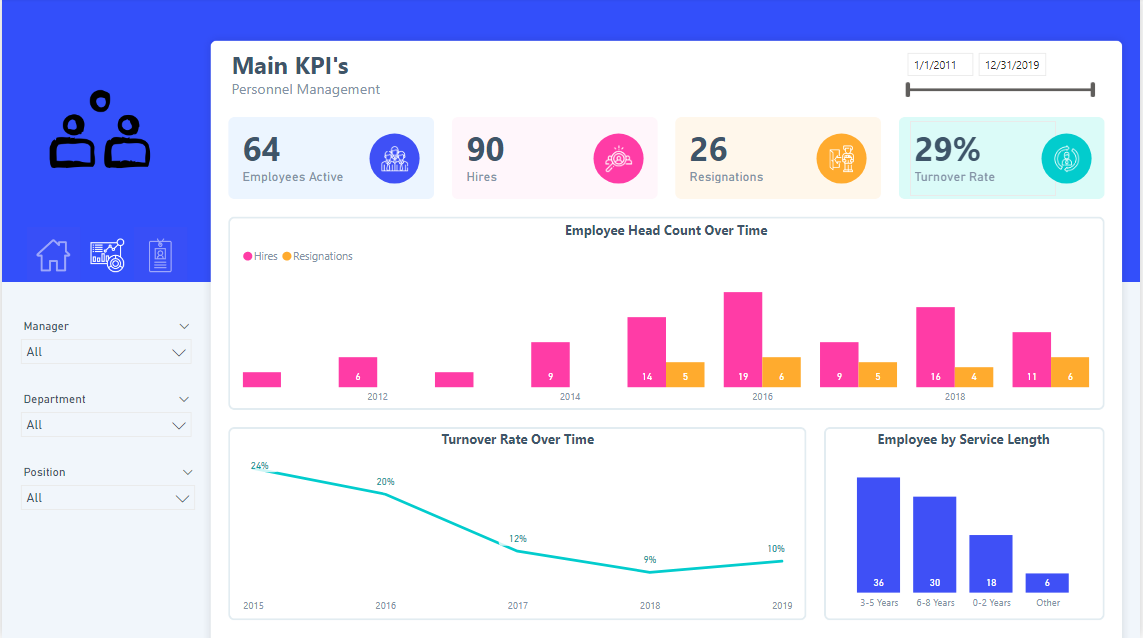
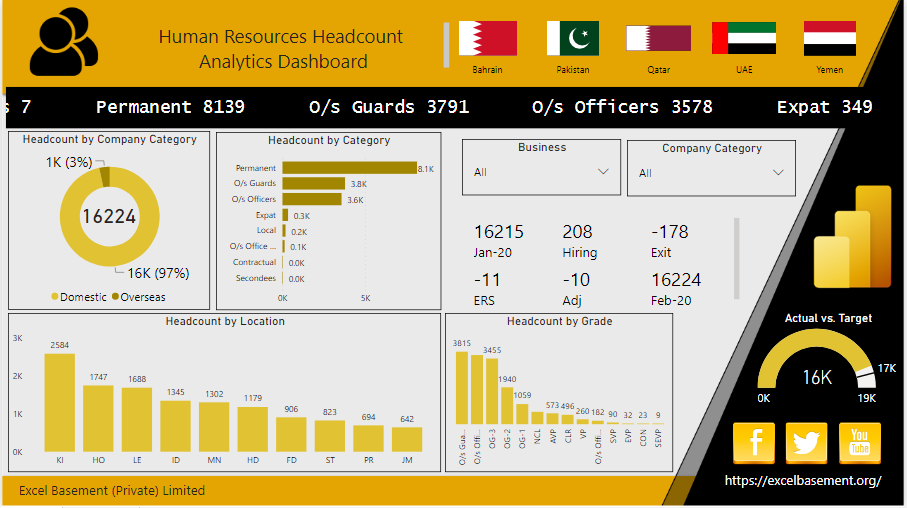
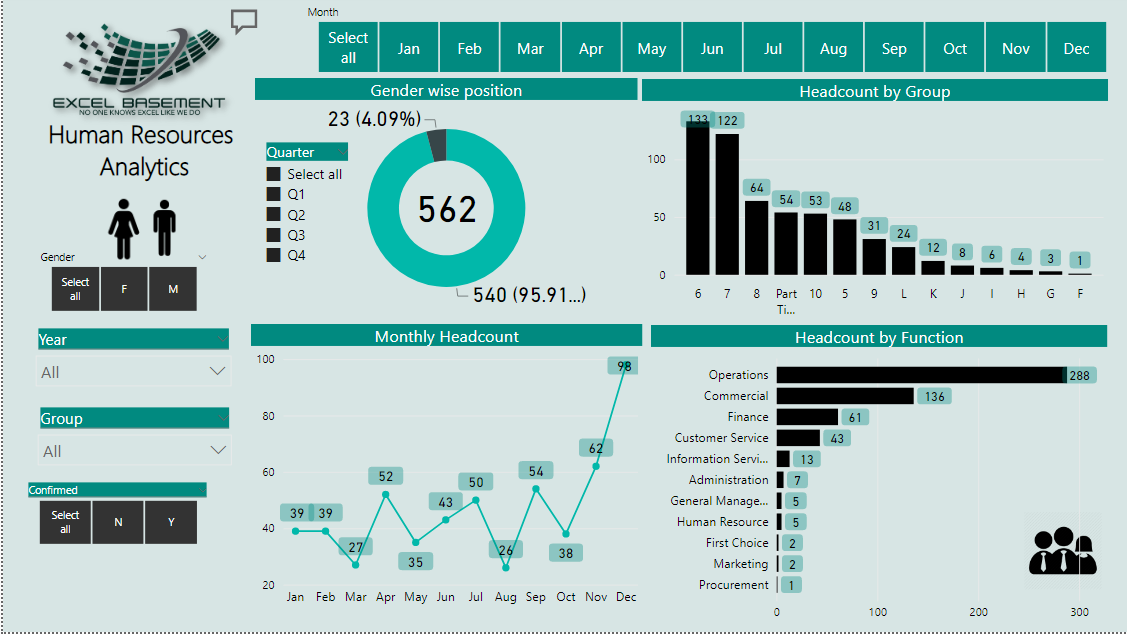
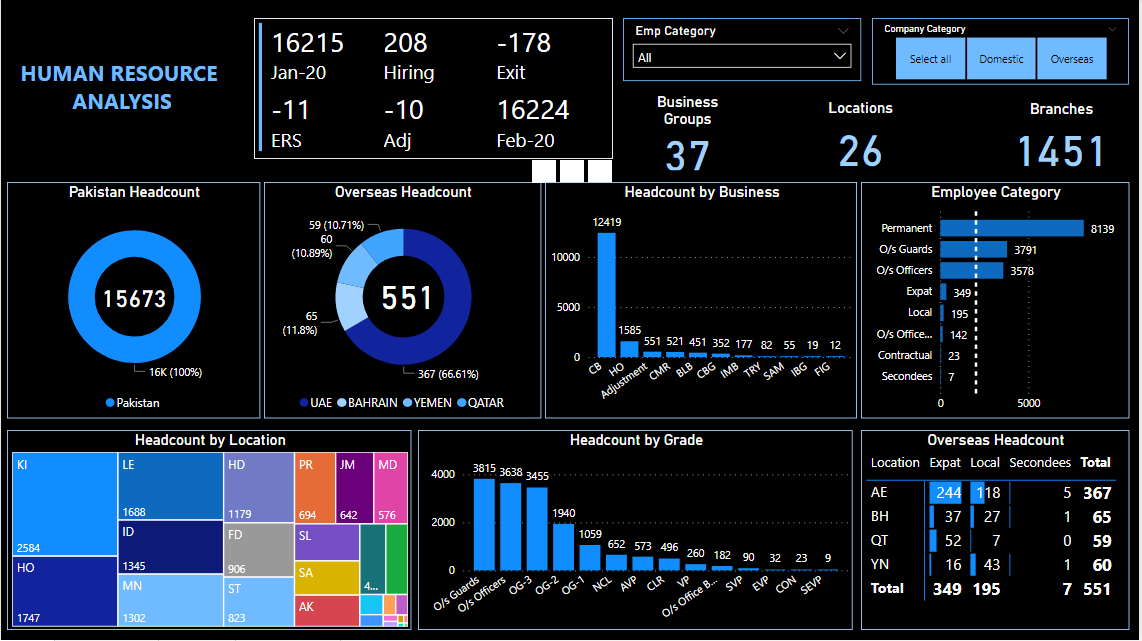
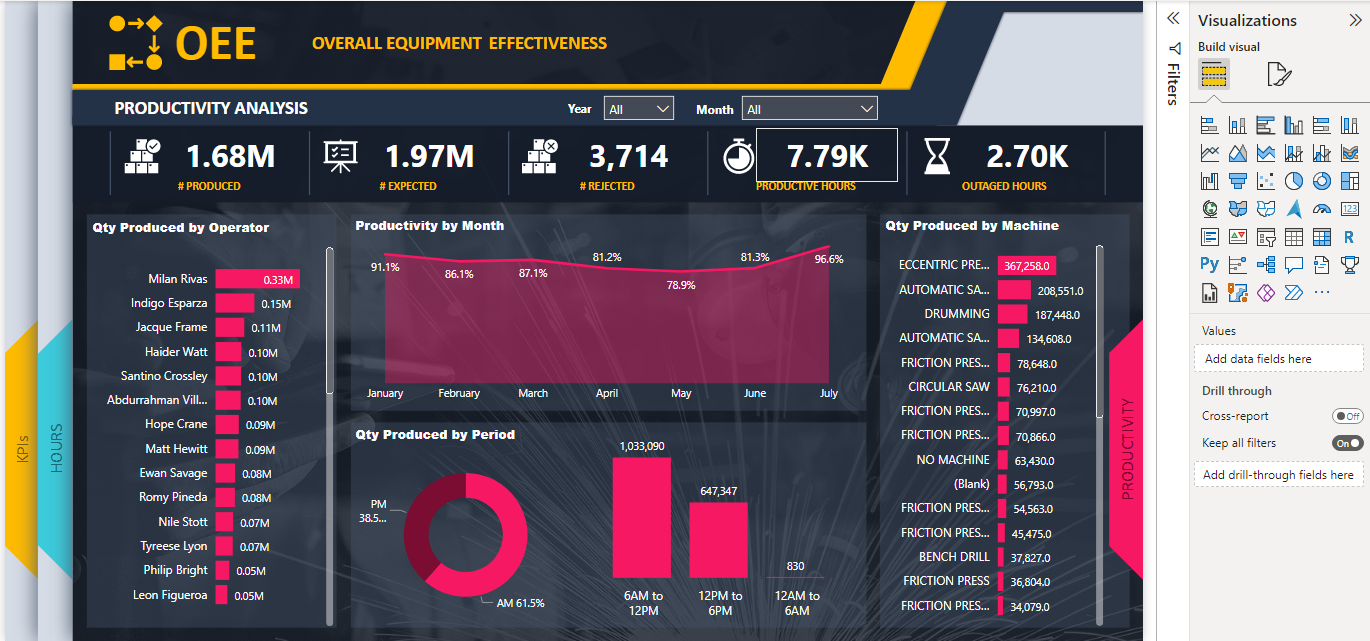
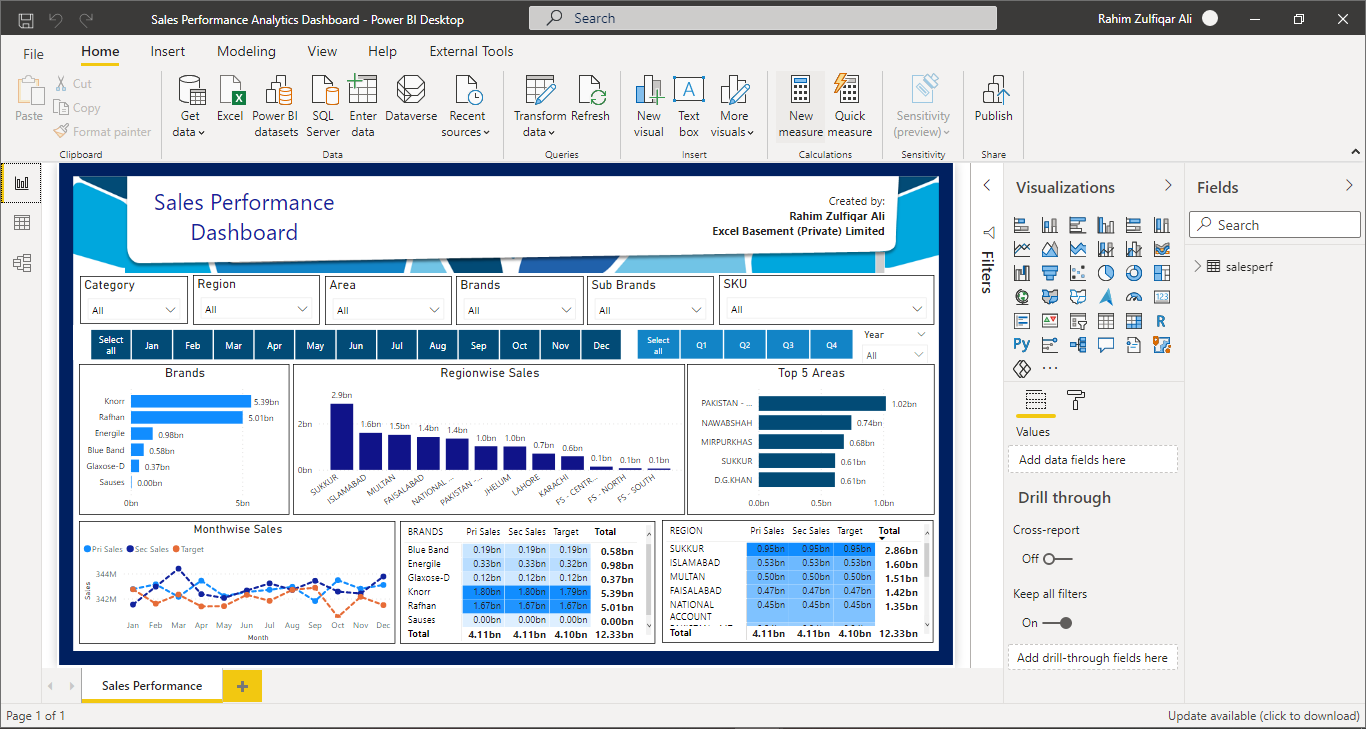
The Best 20 Microsoft POWER BI Templates (HR, Finance, Supply Chain, Sales) Desktop Version
The Best 20 Microsoft POWER BI Templates (HR, Finance, Supply Chain, Sales) Desktop Version
Founder & CEO - Excel Basement, Excel & POWER BI Trainer & Consultant, MBA (MIS), MCT, MSOM, Emerging Data ScientistFollow 279
