

Originally published: 05/02/2025 08:12
Last version published: 12/04/2025 13:31
Publication number: ELQ-94626-2
View all versions & Certificate
Last version published: 12/04/2025 13:31
Publication number: ELQ-94626-2
View all versions & Certificate

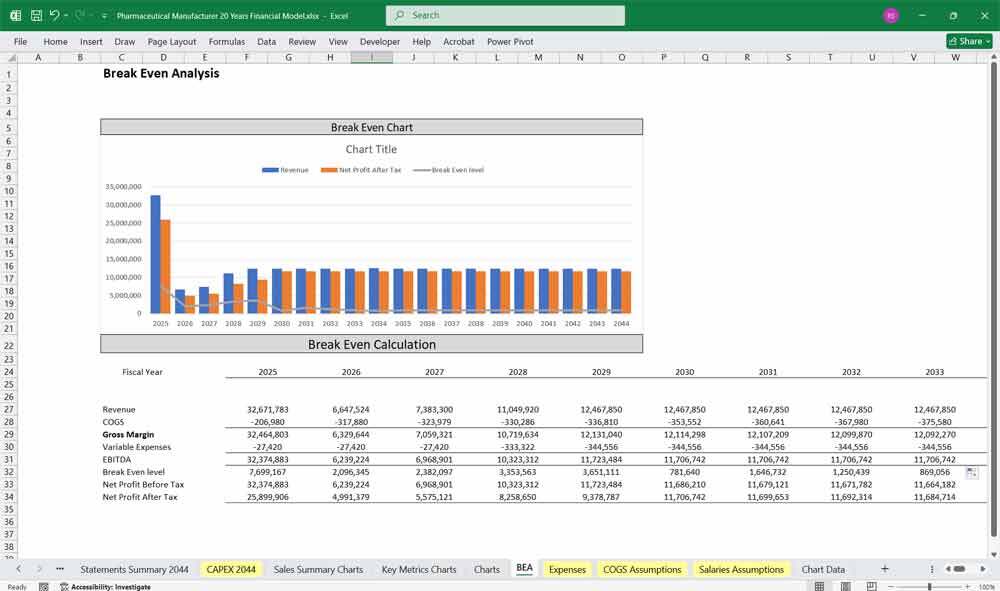
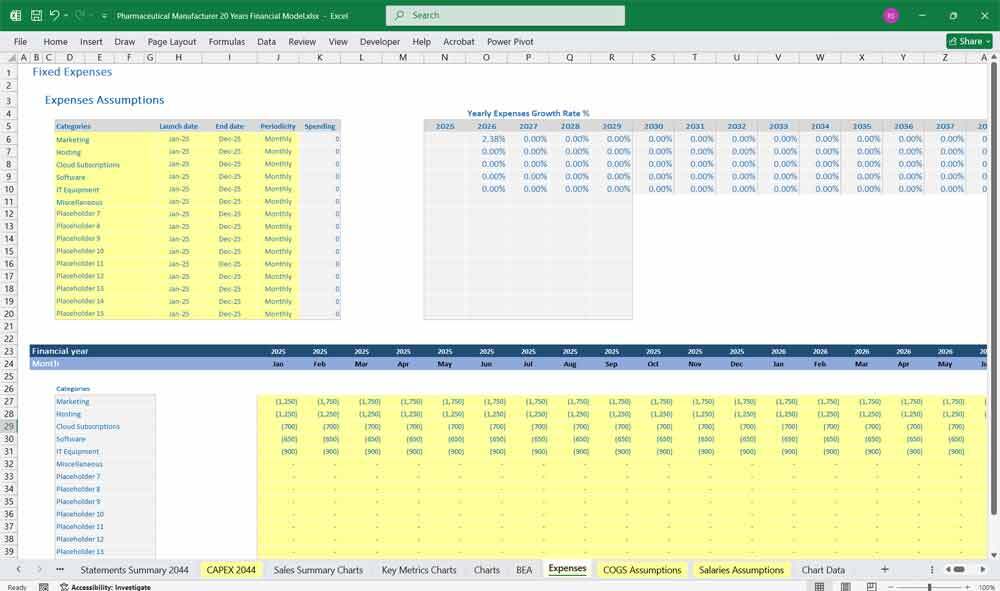
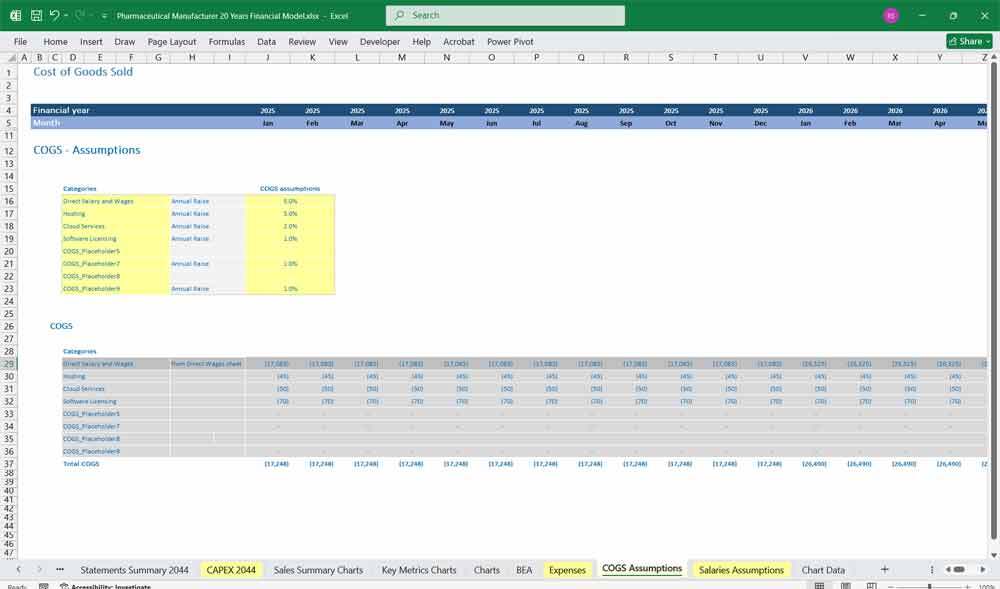
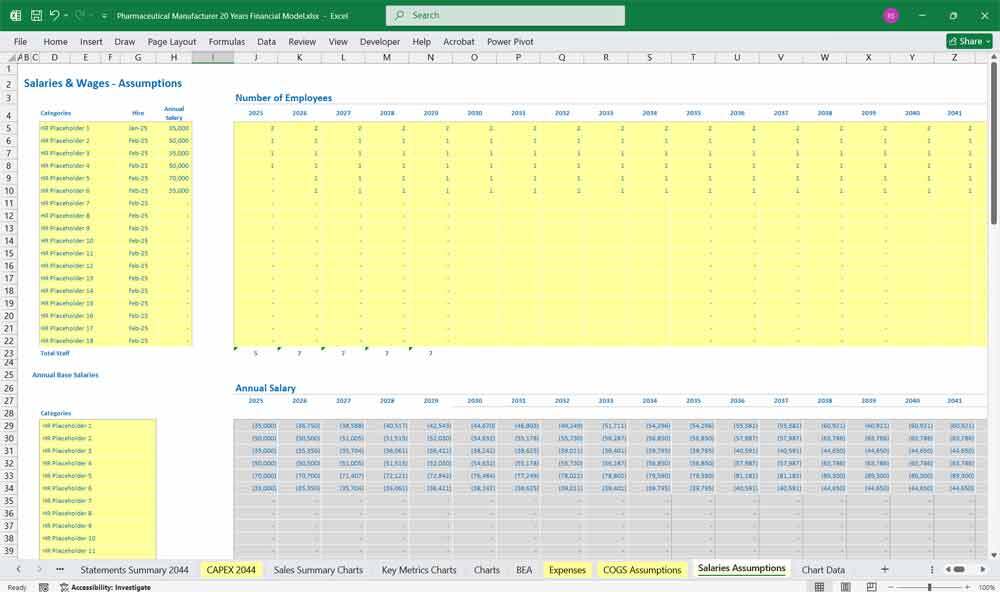
Pharmaceutical Manufacturer Finance Model 20 Year 3 Statement 105 Tab Excel Workbook
Very comprehensive, editable 20-Year 3-Statement, 105-tab MS Excel Workbook for viewing Pharmaceutical Manufacturer finances.
 by AllFinancialModels
AllFinancialModels offer a curated selection of high-quality yet financial model templates designed to support a wide range of business needs.Follow
pharmaceutical manufacturerpharmaceuticalpharmabiotechfinancial modelfinancespreadsheettemplatepharmaceutical manufacturingmanufacturing
Description
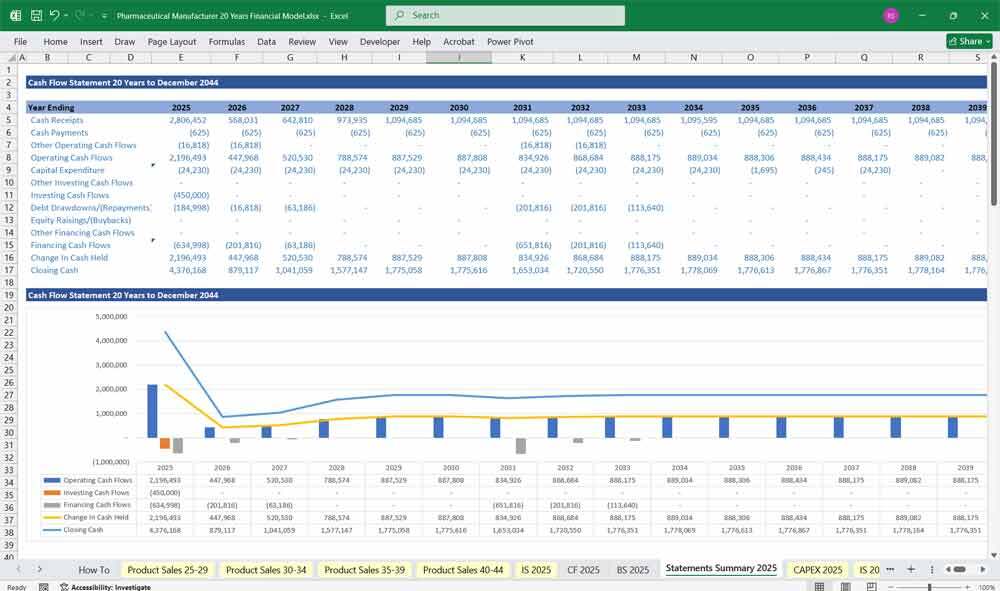
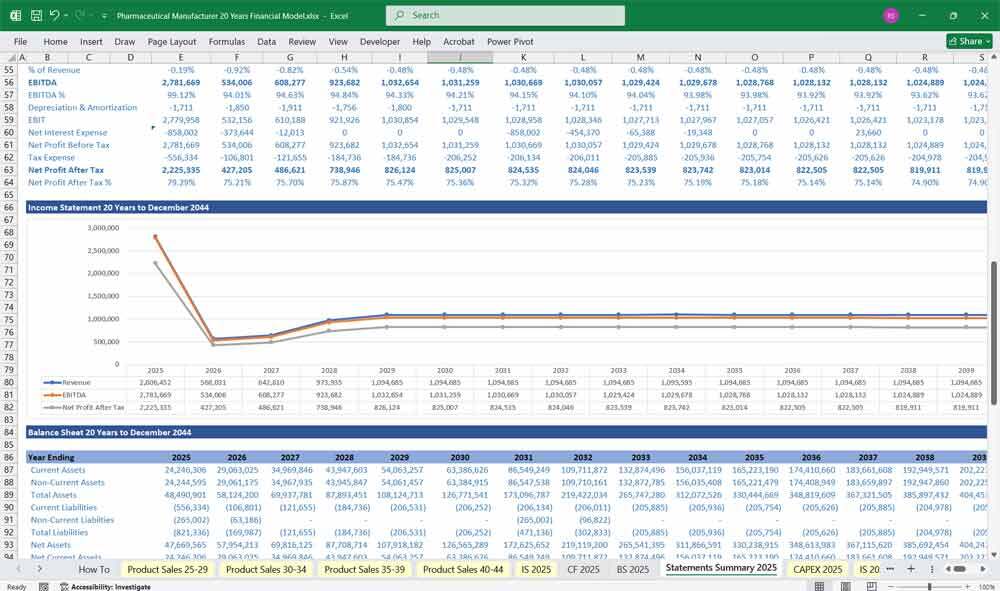
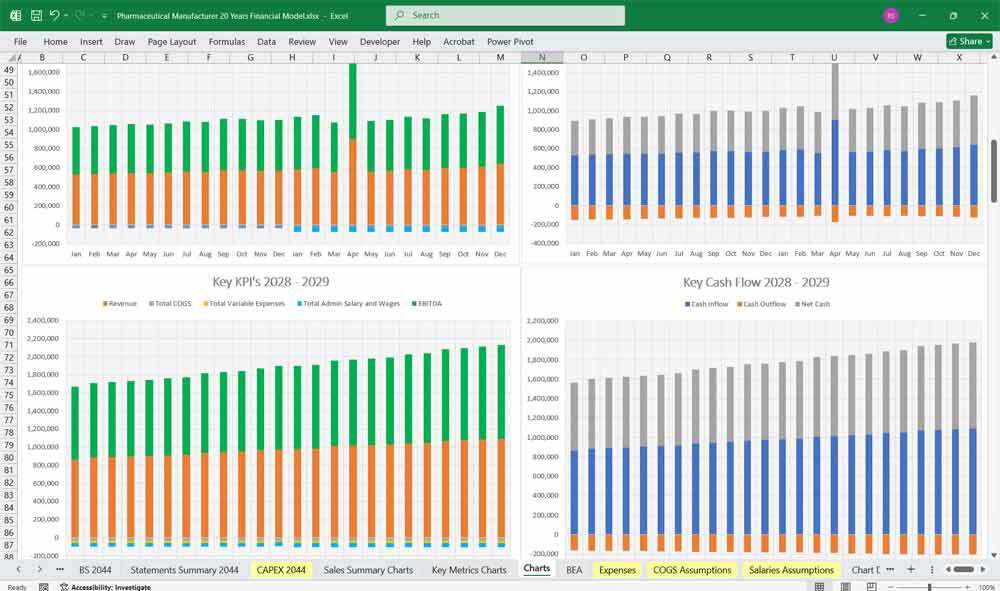
20-year 3-Statement Financial Model for a pharmaceutical manufacturer, 20x Income Statement, Cash Flow Statement, and Balance Sheets to project the company’s financial performance, cash flows, and financial position, unmatched financial modeling.
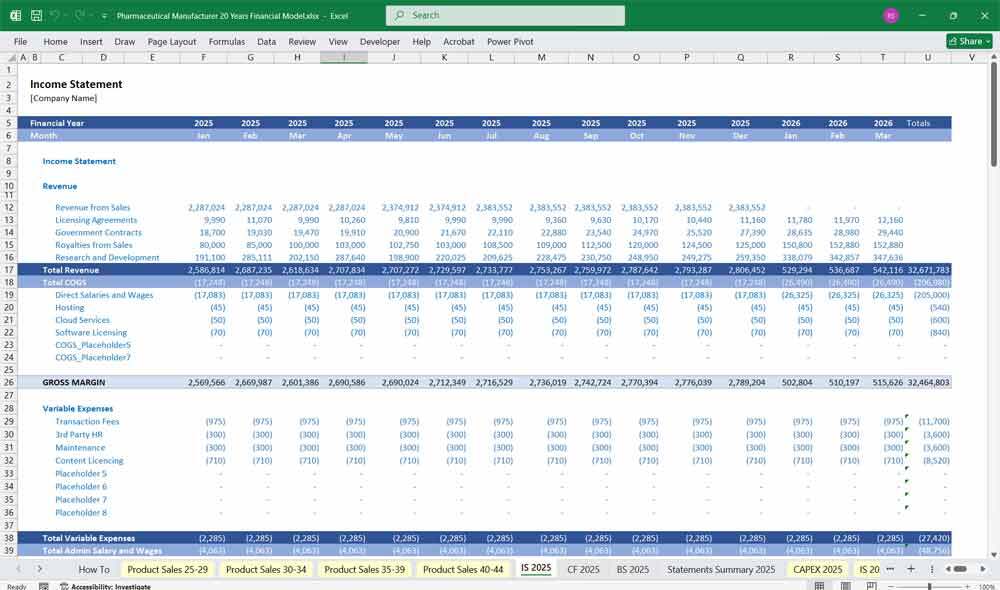
1. Income Statement
The Income Statement reflects the company’s revenues, costs, and profitability over a period. For a pharmaceutical manufacturer, key line items include:
Revenue
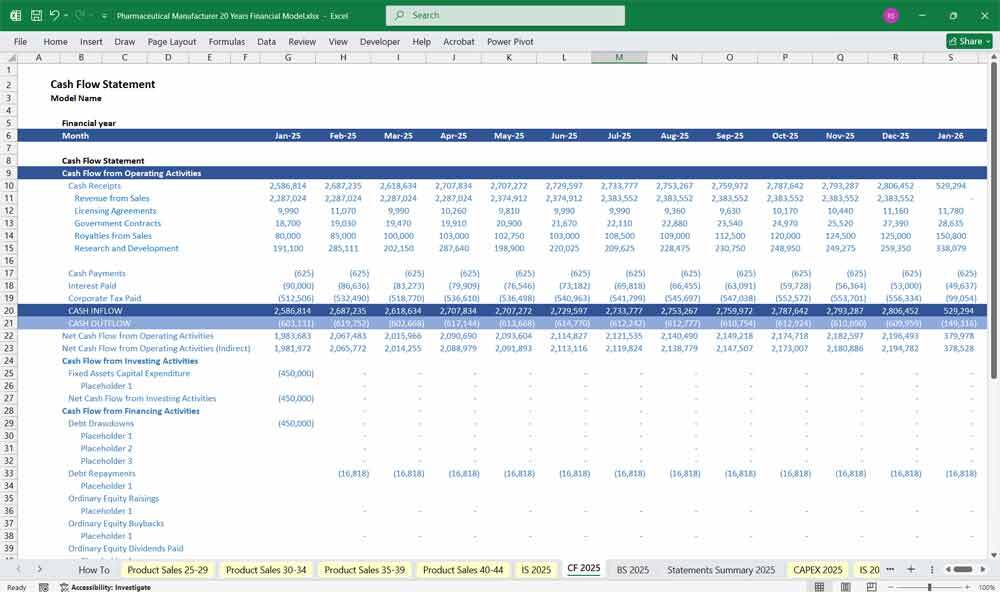
The Cash Flow Statement tracks the company’s cash inflows and outflows, categorized into operating, investing, and financing activities.
Operating Activities
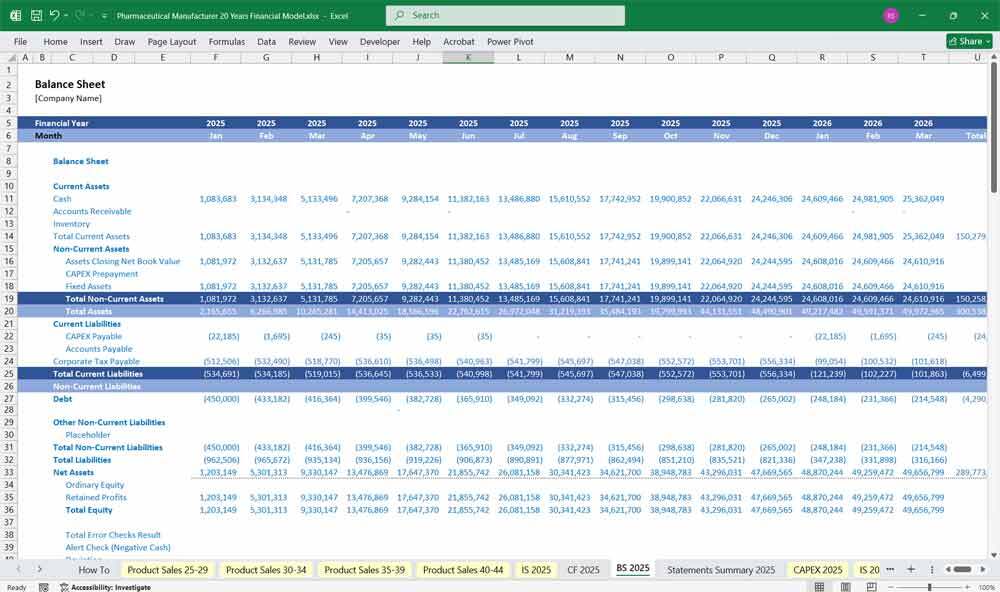
The Balance Sheet provides a snapshot of the company’s financial position at a specific point in time, showing assets, liabilities, and equity.
Assets
20-year 3-Statement Financial Model for a pharmaceutical manufacturer, 20x Income Statement, Cash Flow Statement, and Balance Sheets to project the company’s financial performance, cash flows, and financial position, unmatched financial modeling.
1. Income Statement
The Income Statement reflects the company’s revenues, costs, and profitability over a period. For a pharmaceutical manufacturer, key line items include:
Revenue
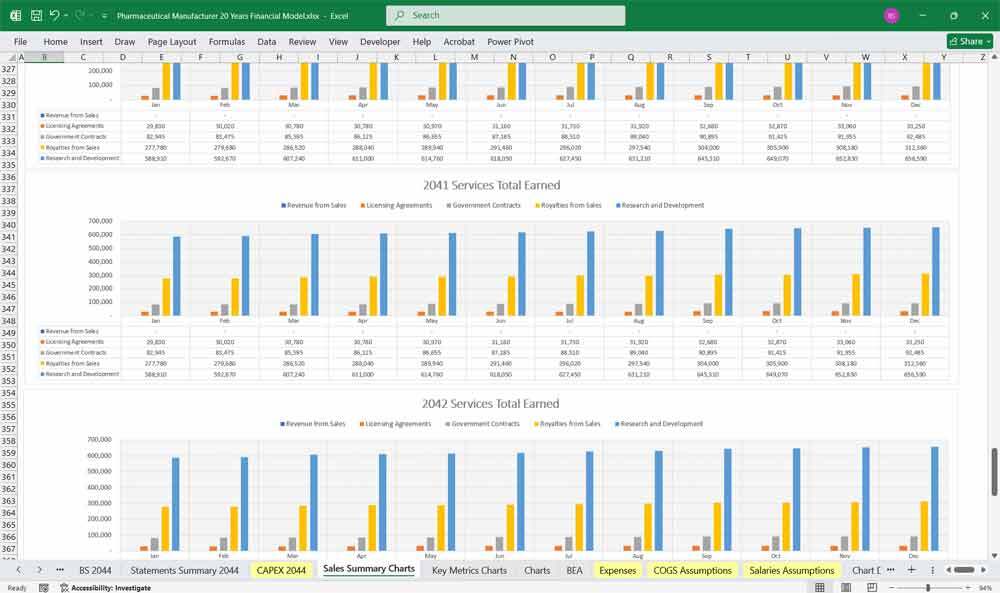
- Product Sales: Revenue from the sale of prescription drugs, over-the-counter medications, and other pharmaceutical products.
- Licensing Revenue: Income from licensing intellectual property (e.g., patents) to other companies.
- Research & Development (R&D) Collaborations: Revenue from partnerships or grants for drug development.
- Other Revenue: Miscellaneous income, such as royalties or milestone payments.
- Raw Materials: Costs of active pharmaceutical ingredients (APIs), excipients, and other raw materials.
- Manufacturing Costs: Labor, utilities, and overhead costs associated with drug production.
- Packaging and Distribution: Costs related to packaging and shipping finished products.
- Gross Profit = Revenue - COGS
- Research & Development (R&D): Costs for drug discovery, clinical trials, and regulatory approvals.
- Sales & Marketing: Expenses for promoting products, including advertising, salesforce salaries, and market research.
- General & Administrative (G&A): Overhead costs such as salaries, legal fees, and office expenses.
- Operating Income = Gross Profit - Operating Expenses
- Interest Income: Income from investments or cash reserves.
- Interest Expense: Costs of debt financing.
- Gains/Losses on Asset Sales: Profits or losses from selling assets (e.g., manufacturing equipment).
- Pre-Tax Income = Operating Income + Other Income/Expenses
- Income Tax Expense: Taxes based on the applicable tax rate.
- Net Income = Pre-Tax Income - Taxes
The Cash Flow Statement tracks the company’s cash inflows and outflows, categorized into operating, investing, and financing activities.
Operating Activities
- Net Income: Starting point, adjusted for non-cash items.
- Depreciation & Amortization: Non-cash expenses added back to net income.
- Changes in Working Capital:
- Accounts Receivable: Cash impact of changes in customer payments.
- Inventory: Cash impact of changes in raw materials and finished goods inventory.
- Accounts Payable: Cash impact of changes in payments to suppliers.
- Accounts Receivable: Cash impact of changes in customer payments.
- Other Adjustments: Non-cash items like stock-based compensation.
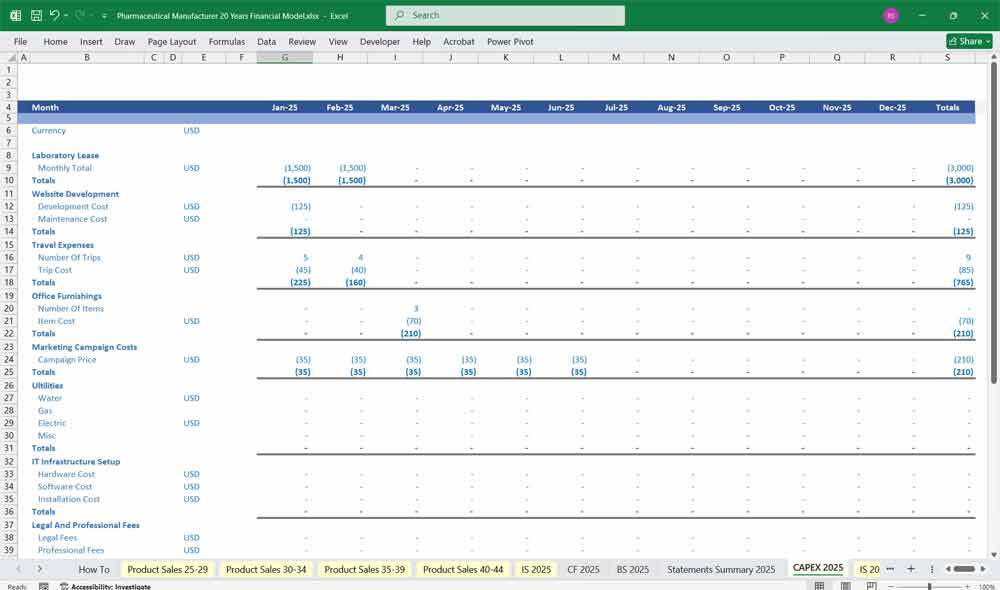
- Capital Expenditures (CapEx): Cash spent on manufacturing facilities, equipment, and R&D infrastructure.
- Acquisitions: Cash used to acquire other companies or intellectual property.
- Investments: Cash used for or generated from financial investments.
- Debt Issuance/Repayment: Cash from borrowing or repaying loans.
- Equity Issuance/Repurchase: Cash from issuing shares or buying back stock.
- Dividends: Cash paid to shareholders.
- Net Change in Cash = Cash from Operating Activities + Cash from Investing Activities + Cash from Financing Activities
The Balance Sheet provides a snapshot of the company’s financial position at a specific point in time, showing assets, liabilities, and equity.
Assets
- Current Assets:
- Cash & Cash Equivalents: Liquid assets available for operations.
- Accounts Receivable: Amounts owed by customers for product sales.
- Inventory: Raw materials, work-in-progress, and finished goods.
- Prepaid Expenses: Payments made in advance (e.g., insurance, rent).
- Cash & Cash Equivalents: Liquid assets available for operations.
- Non-Current Assets:
- Property, Plant & Equipment (PP&E): Manufacturing facilities, labs, and equipment, net of depreciation.
- Intangible Assets: Patents, trademarks, and licenses.
- Goodwill: Excess purchase price from acquisitions.
- Property, Plant & Equipment (PP&E): Manufacturing facilities, labs, and equipment, net of depreciation.
- Current Liabilities:
- Accounts Payable: Amounts owed to suppliers.
- Accrued Expenses: Unpaid operating expenses (e.g., wages, utilities).
- Short-Term Debt: Debt due within one year.
- Accounts Payable: Amounts owed to suppliers.
- Non-Current Liabilities:
- Long-Term Debt: Debt due beyond one year.
- Deferred Revenue: Payments received in advance for future product deliveries.
- Long-Term Debt: Debt due beyond one year.
- Common Stock: Par value of issued shares.
- Additional Paid-In Capital (APIC): Excess of share price over par value.
- Retained Earnings: Cumulative net income minus dividends.
- Treasury Stock: Value of repurchased shares.
- Assets = Liabilities + Equity
- R&D Expenses: High R&D costs are a significant driver of operating expenses, and their capitalization vs. expensing impacts the financials.
- Regulatory Risks: Delays in drug approvals can impact revenue projections and cash flows.
- Inventory Management: Pharmaceutical manufacturers must carefully manage inventory to avoid obsolescence due to expiration dates.
- Patents and Exclusivity: Revenue projections depend on patent lifecycles and the timing of generic competition.
- Working Capital: Long cash conversion cycles due to extended payment terms with distributors and insurers.
- Net Income from the Income Statement flows into the Cash Flow Statement and the Equity section of the Balance Sheet.
- CapEx from the Cash Flow Statement impacts PP&E on the Balance Sheet.
- Debt and Equity Issuance from the Cash Flow Statement affect the Liabilities and Equity sections of the Balance Sheet.
- Changes in Working Capital on the Cash Flow Statement are reflected in Current Assets and Liabilities on the Balance Sheet.
This Best Practice includes
1 Excel Financial Model
Further information
Provides thorough oversight, tracking, and reporting of a Pharmaceutical Manufacturer's finances, including updates on budget utilisation and projections.
