Financial Correlations Model
Originally published: 13/10/2020 07:06
Publication number: ELQ-12749-1
View all versions & Certificate
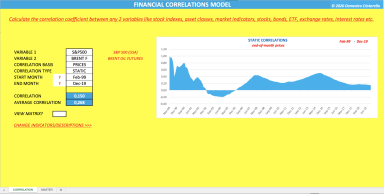
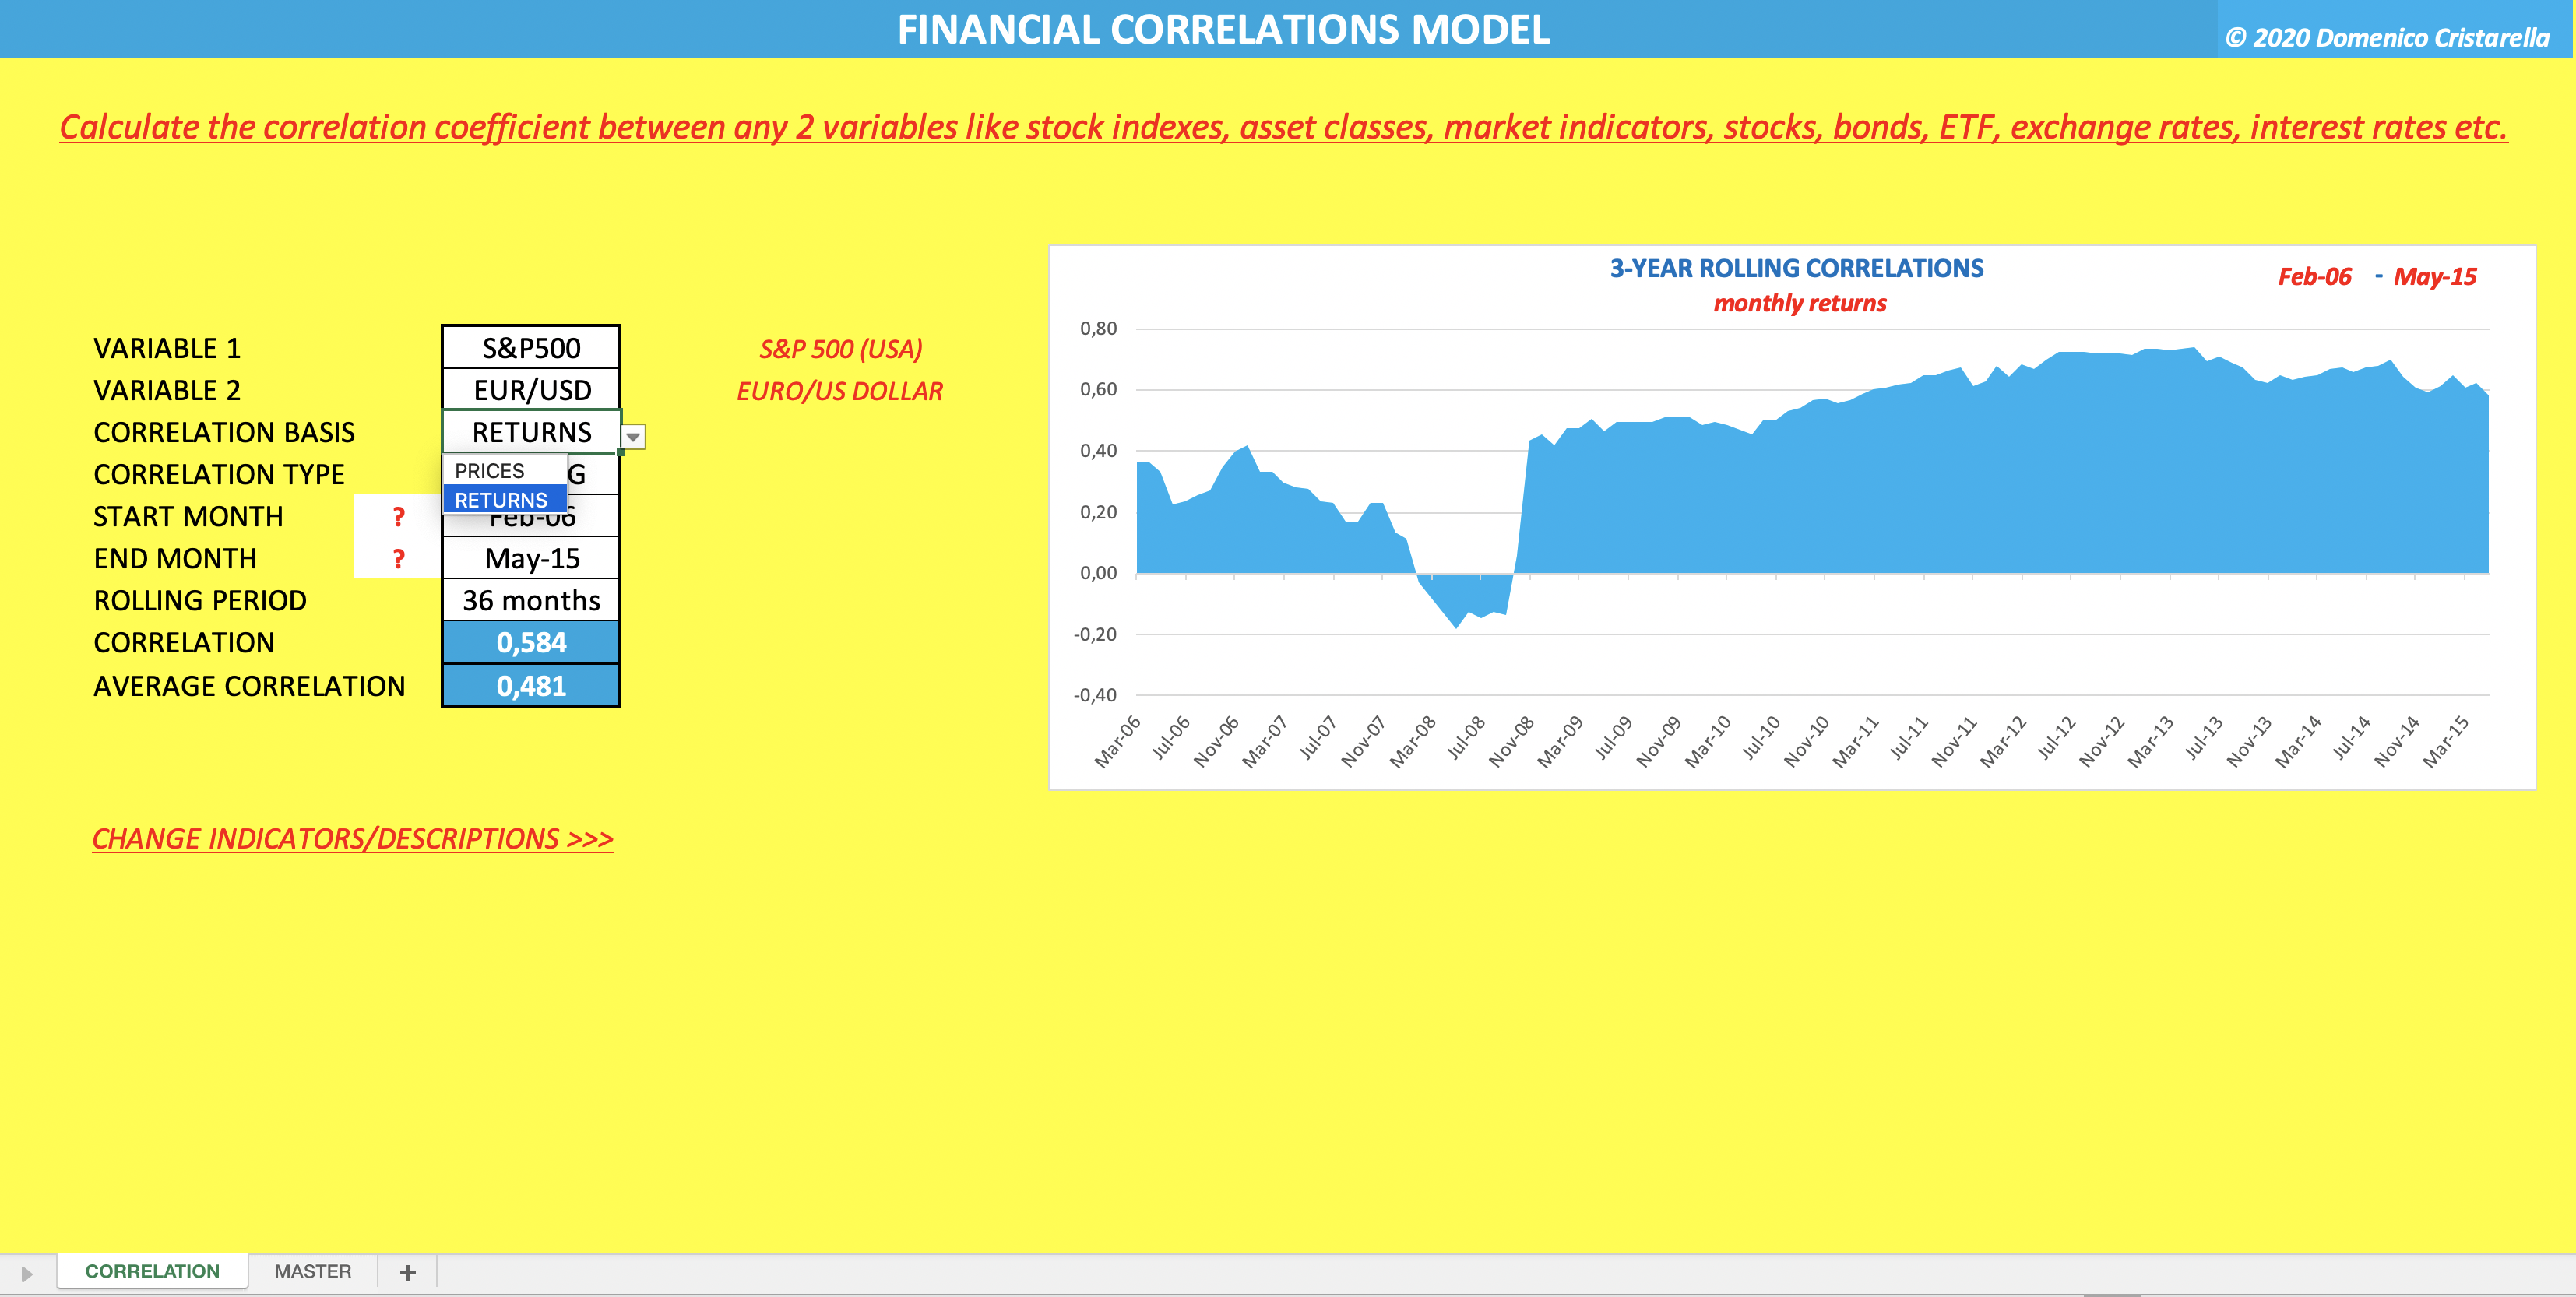
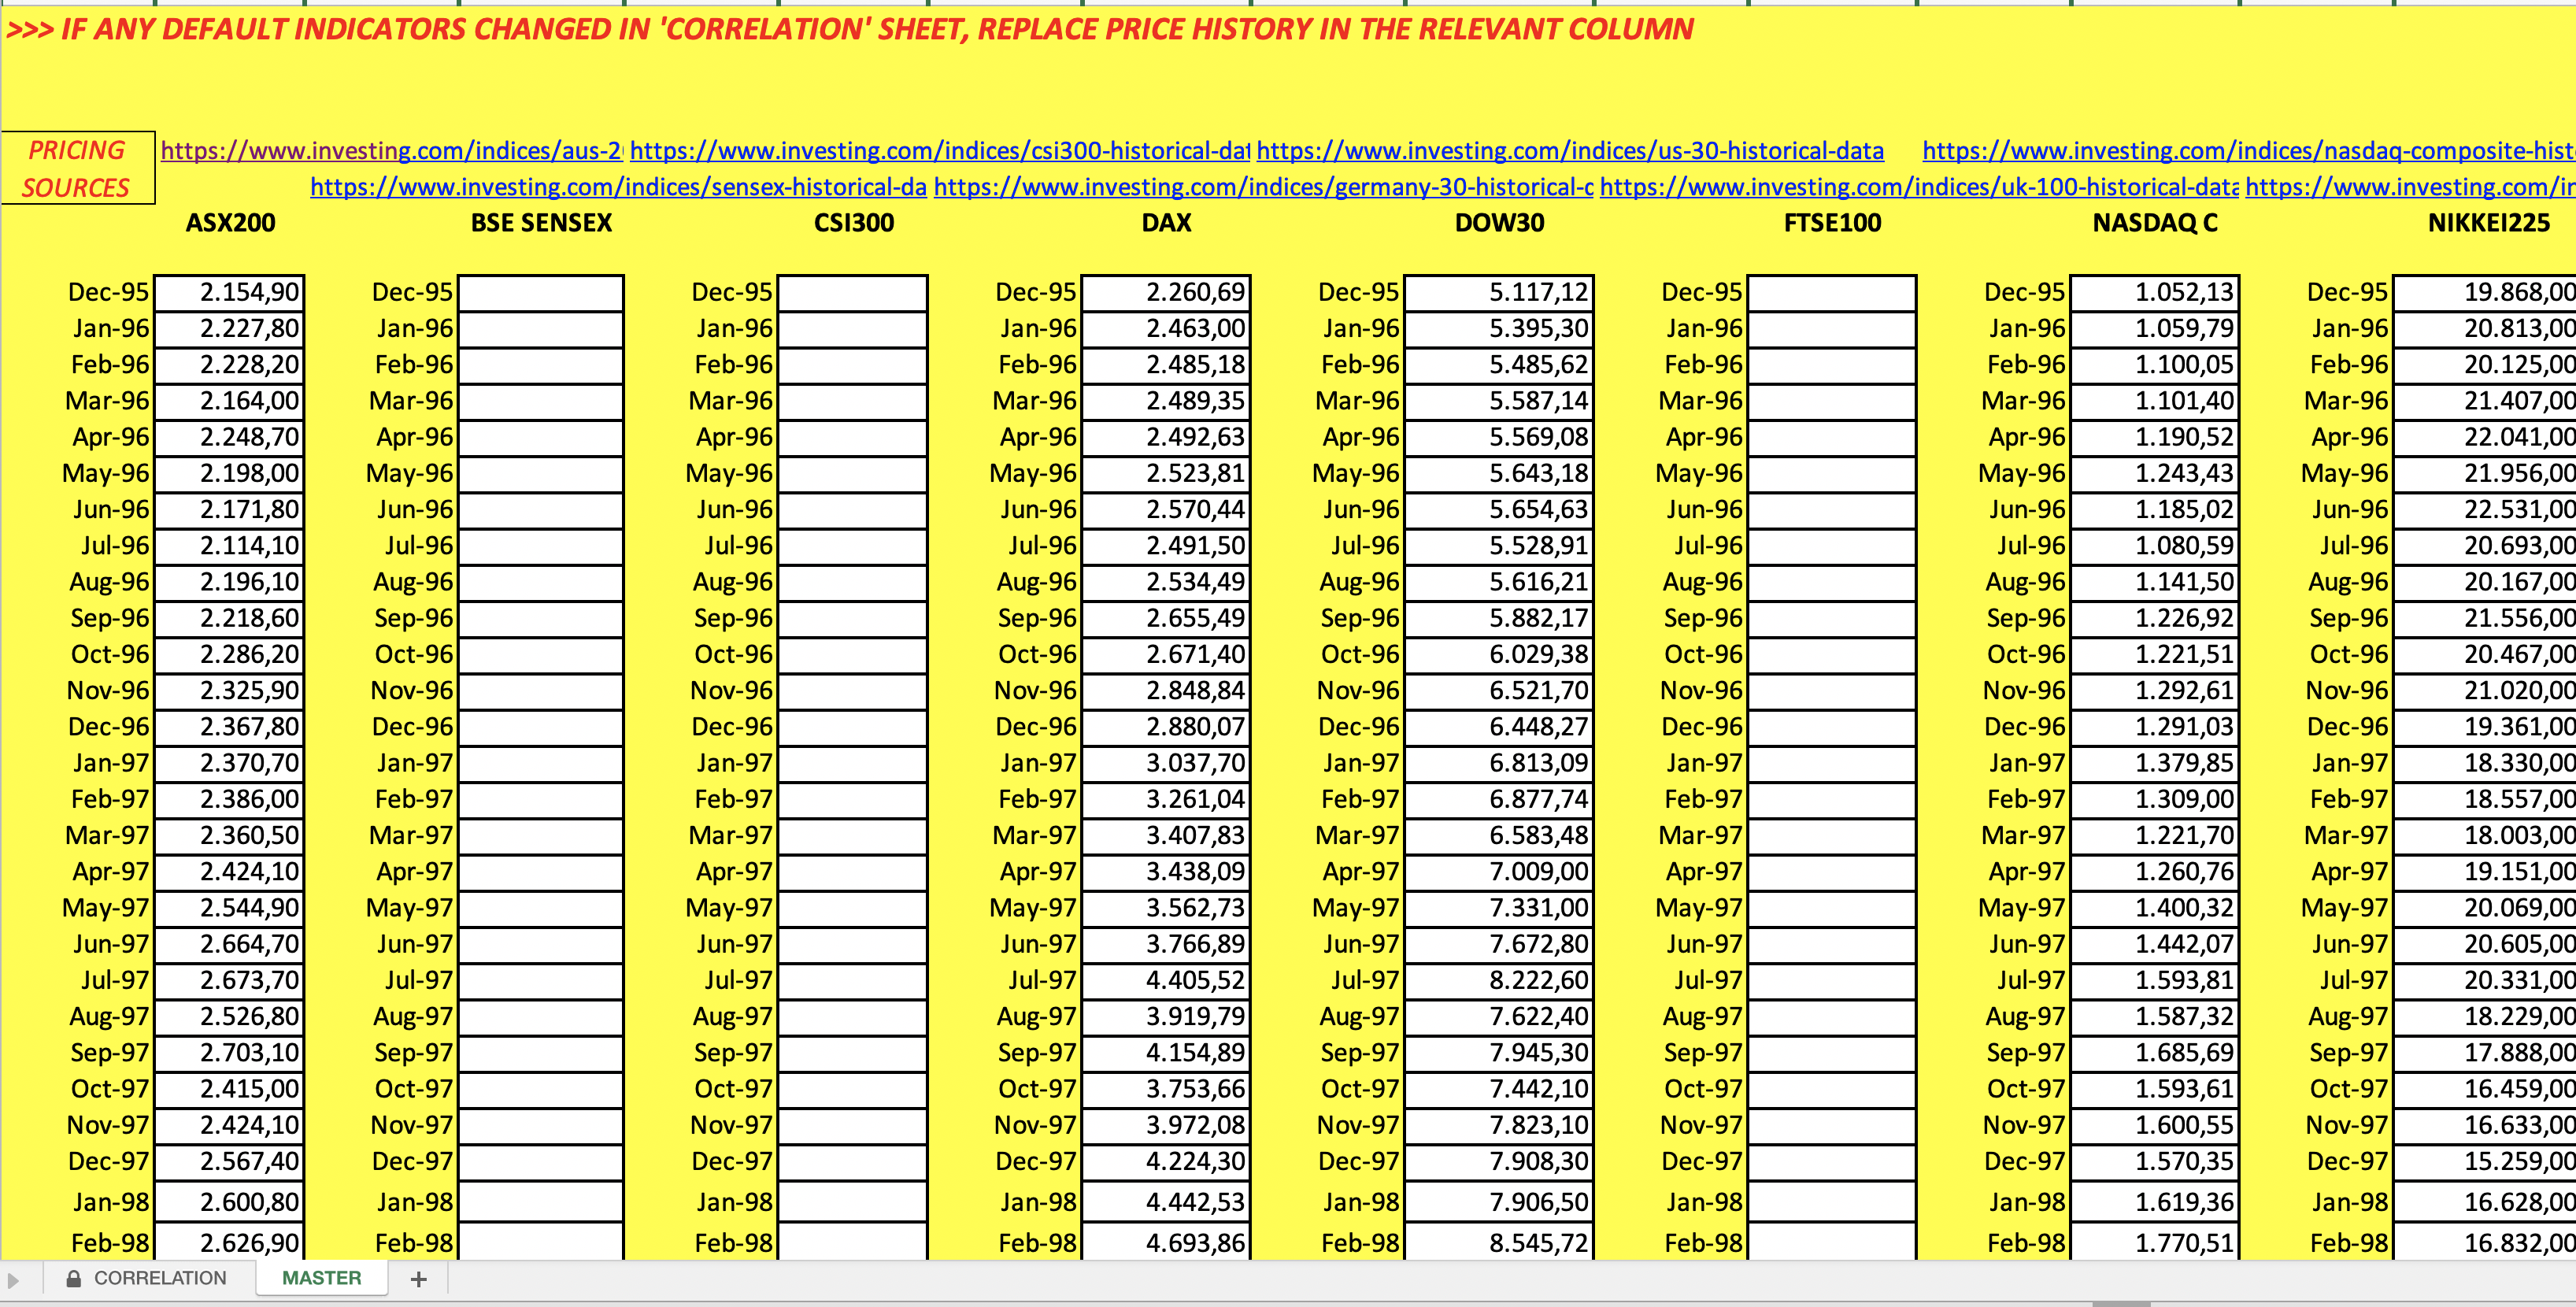
certified

Financial Correlations Model

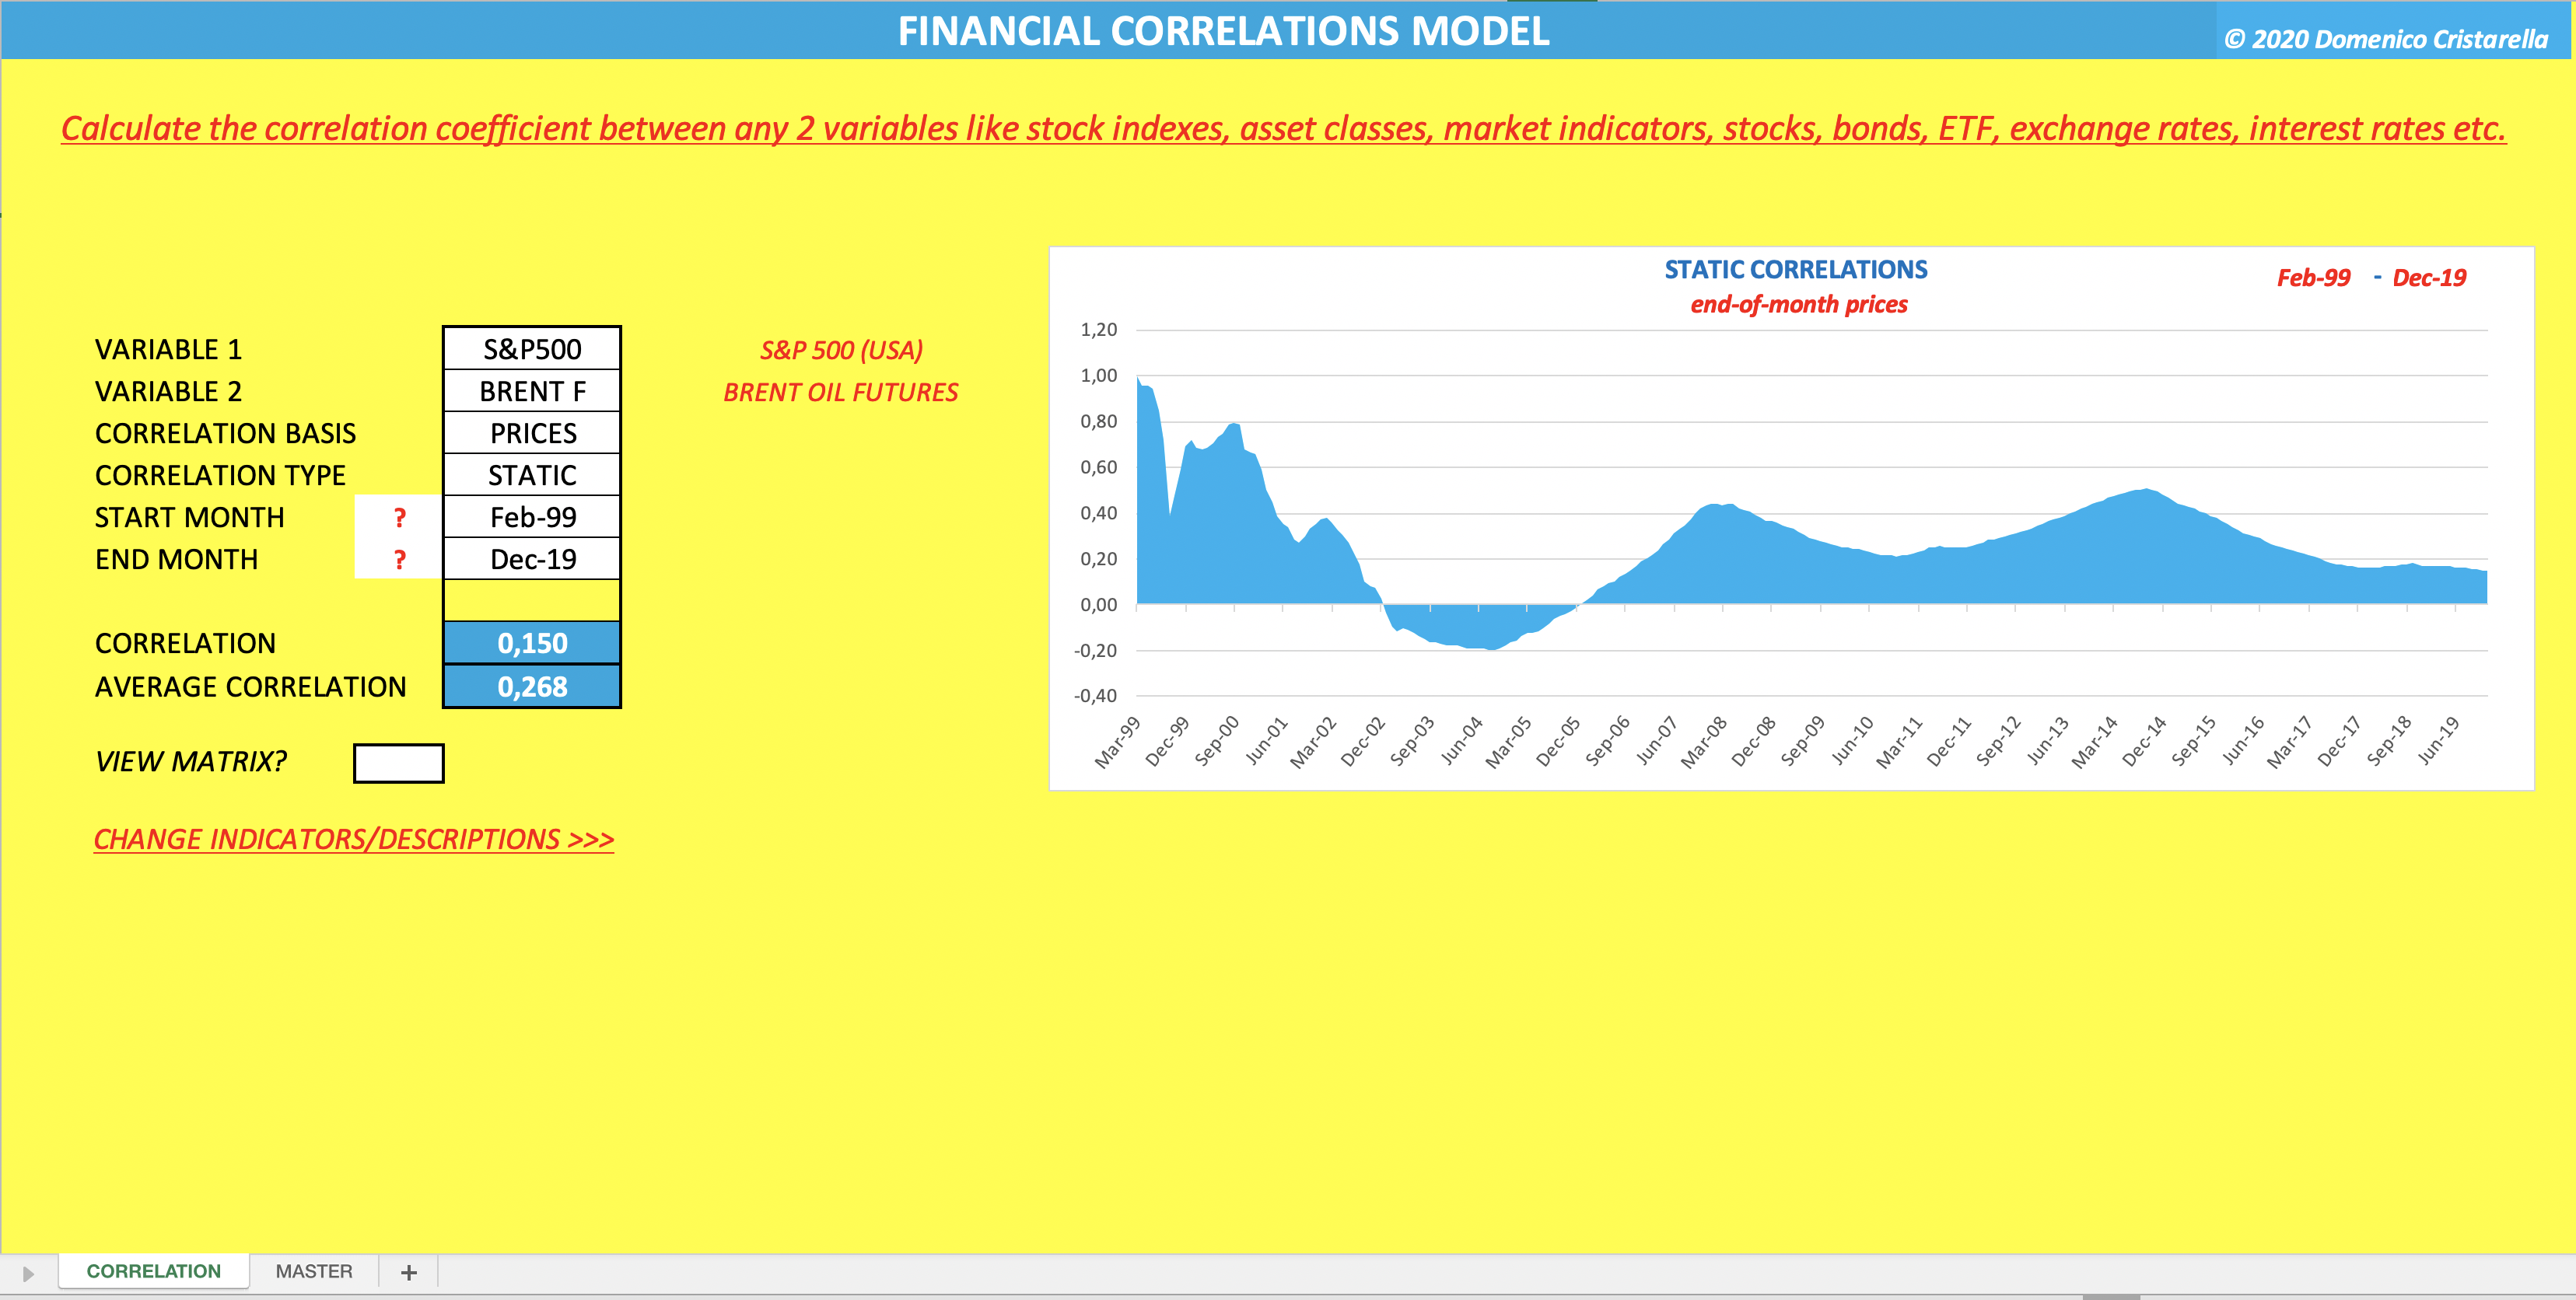
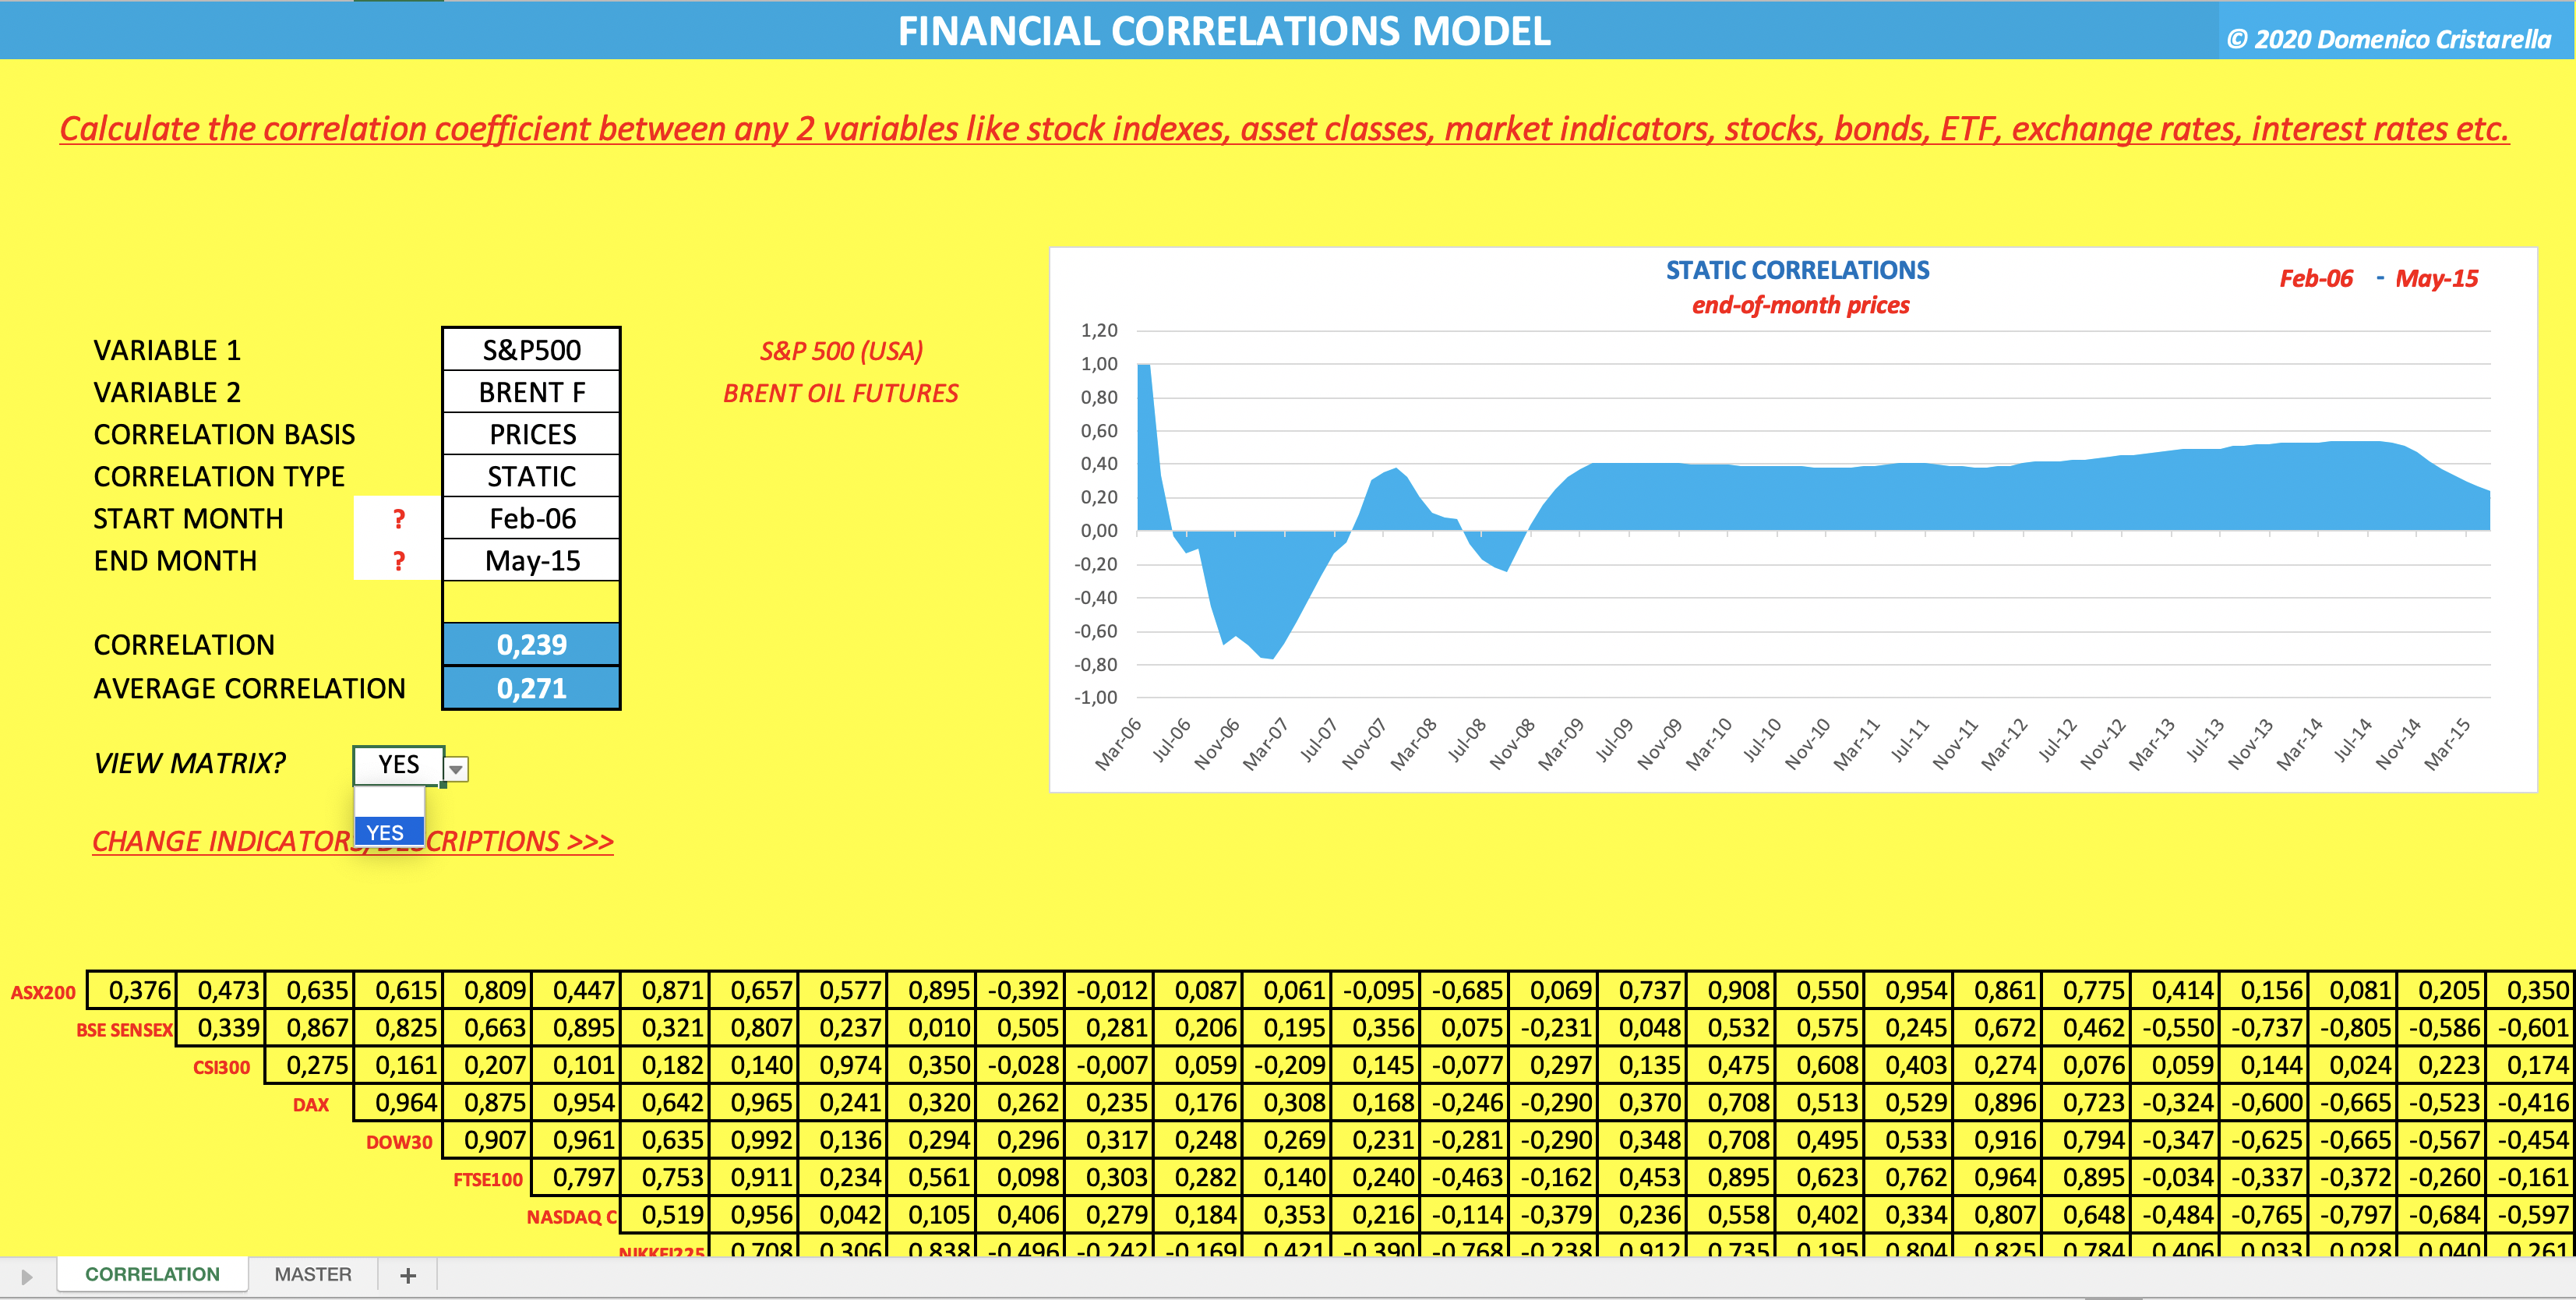
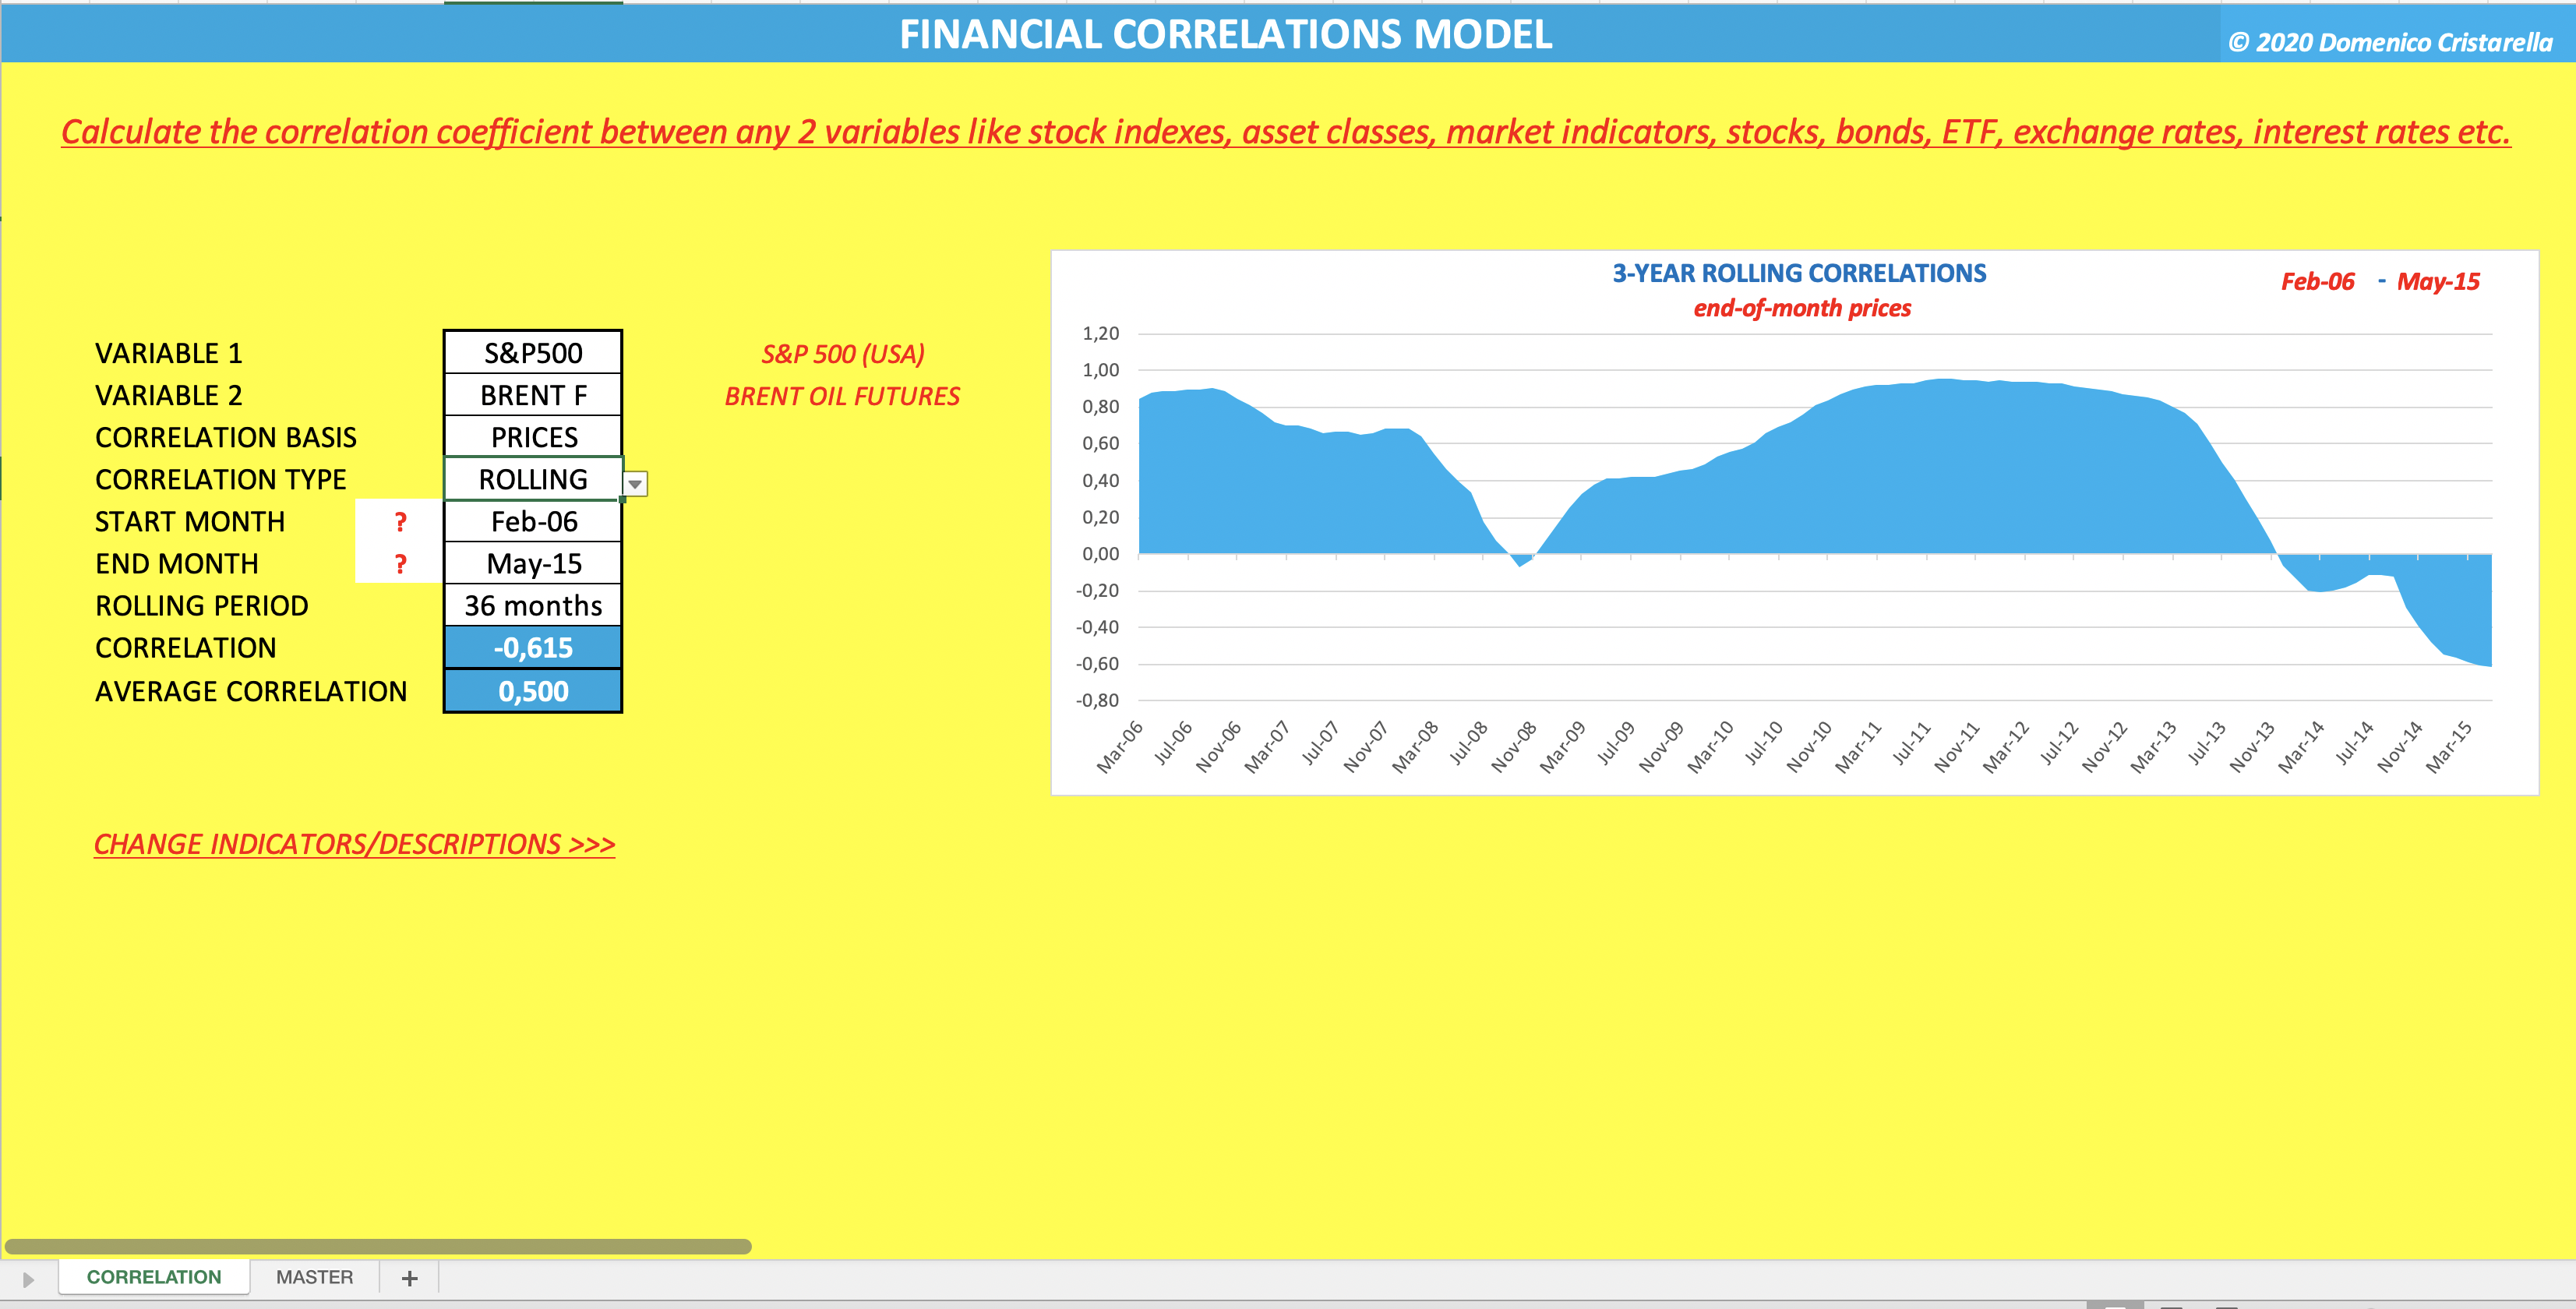
Calculate the static or rolling correlation coefficient between any two variables, based on price or return.

Description
Calculate the correlation coefficient between any two variables, whether they are stock indexes, asset classes, market indicators, individual securities, commodities, currencies, interest rates or anything else that can be tracked numerically.
The model calculates static or rolling correlations (12, 24, 36, 48, 60 months) for the given time period, based either on end-of-month values or monthly returns, going back to Dec. 1995. Including chart to visualize changes over time. 29 indicators included. You can replace any of them with the most appropriate ones for your analysis, by uploading historical values in the “Master” sheet.

Correlation statistically measures the degree of relationship between two variables in terms of a correlation coefficient that lies anywhere between +1.0 and -1.0. When it comes to diversified portfolios, correlation represents the degree of relationship between price (returns) movements of different assets included in the portfolio. A correlation of +1.0 means prices (returns) move totally in tandem (perfect positive correlation); a correlation of -1.0 means that prices (returns) move in completely opposite directions (perfect negative correlation). A correlation of 0 means the movement of one asset has no effect on the movement of the other asset. A well diversified portfolio should include uncorrelated or inversely correlated assets.

Depending on computer capacity the file may take between 20 and 30 seconds to download.

This Best Practice includes
1 Excel Workbook

Acquire business license for $9.00

Add to cart

Add to bookmarks

Discuss


5.0 / 5 (5 votes)

please wait...