

Commercial Mortgage (CMBS) & Asset Backed Securities (ABS) Combined 20 Year Financial Model
Originally published: 27/01/2025 09:42
Publication number: ELQ-54750-1
View all versions & Certificate
certified

Commercial Mortgage (CMBS) & Asset Backed Securities (ABS) Combined 20 Year Financial Model

Comprehensive editable, 20-year 3-statement MS Excel spreadsheets for tracking Commercial Mortgage (CMBS) & Asset-Backed Securities (ABS).

Description
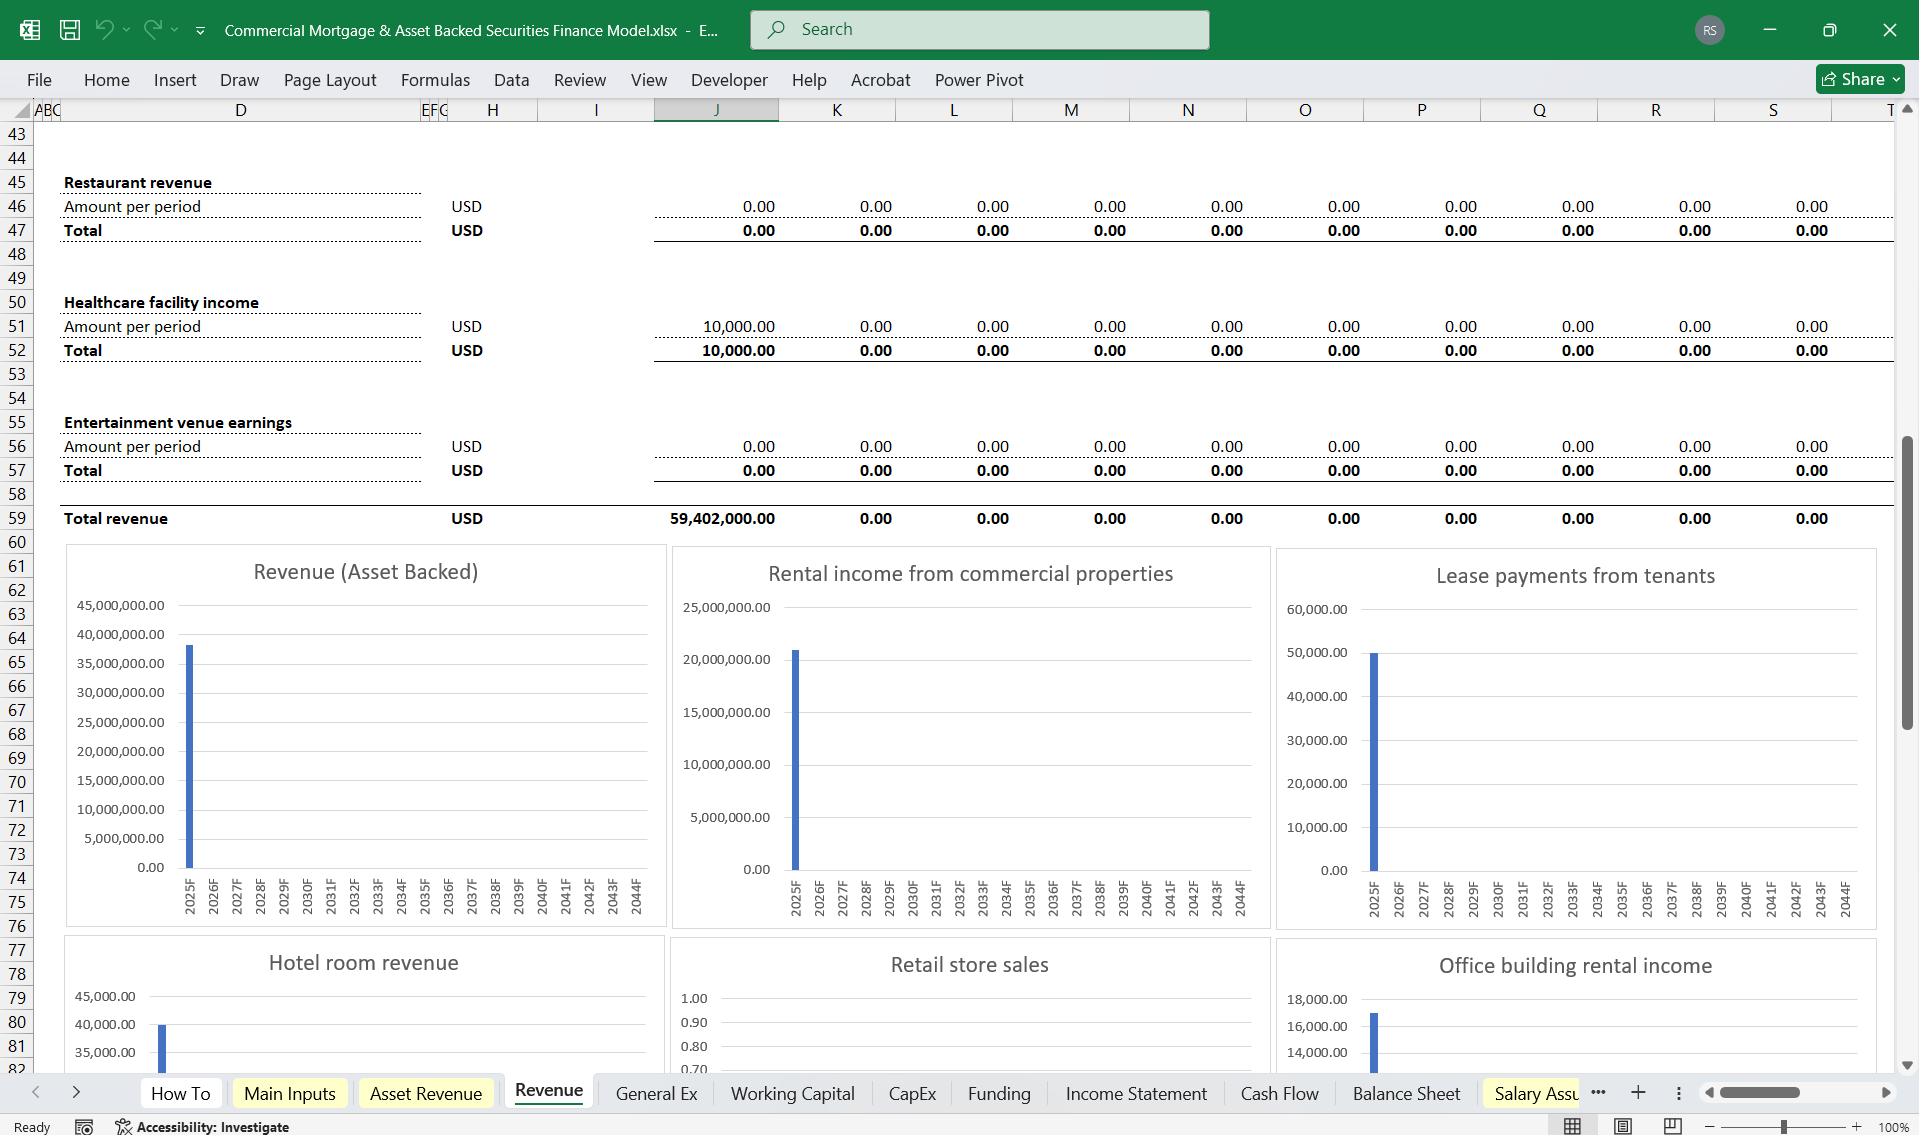
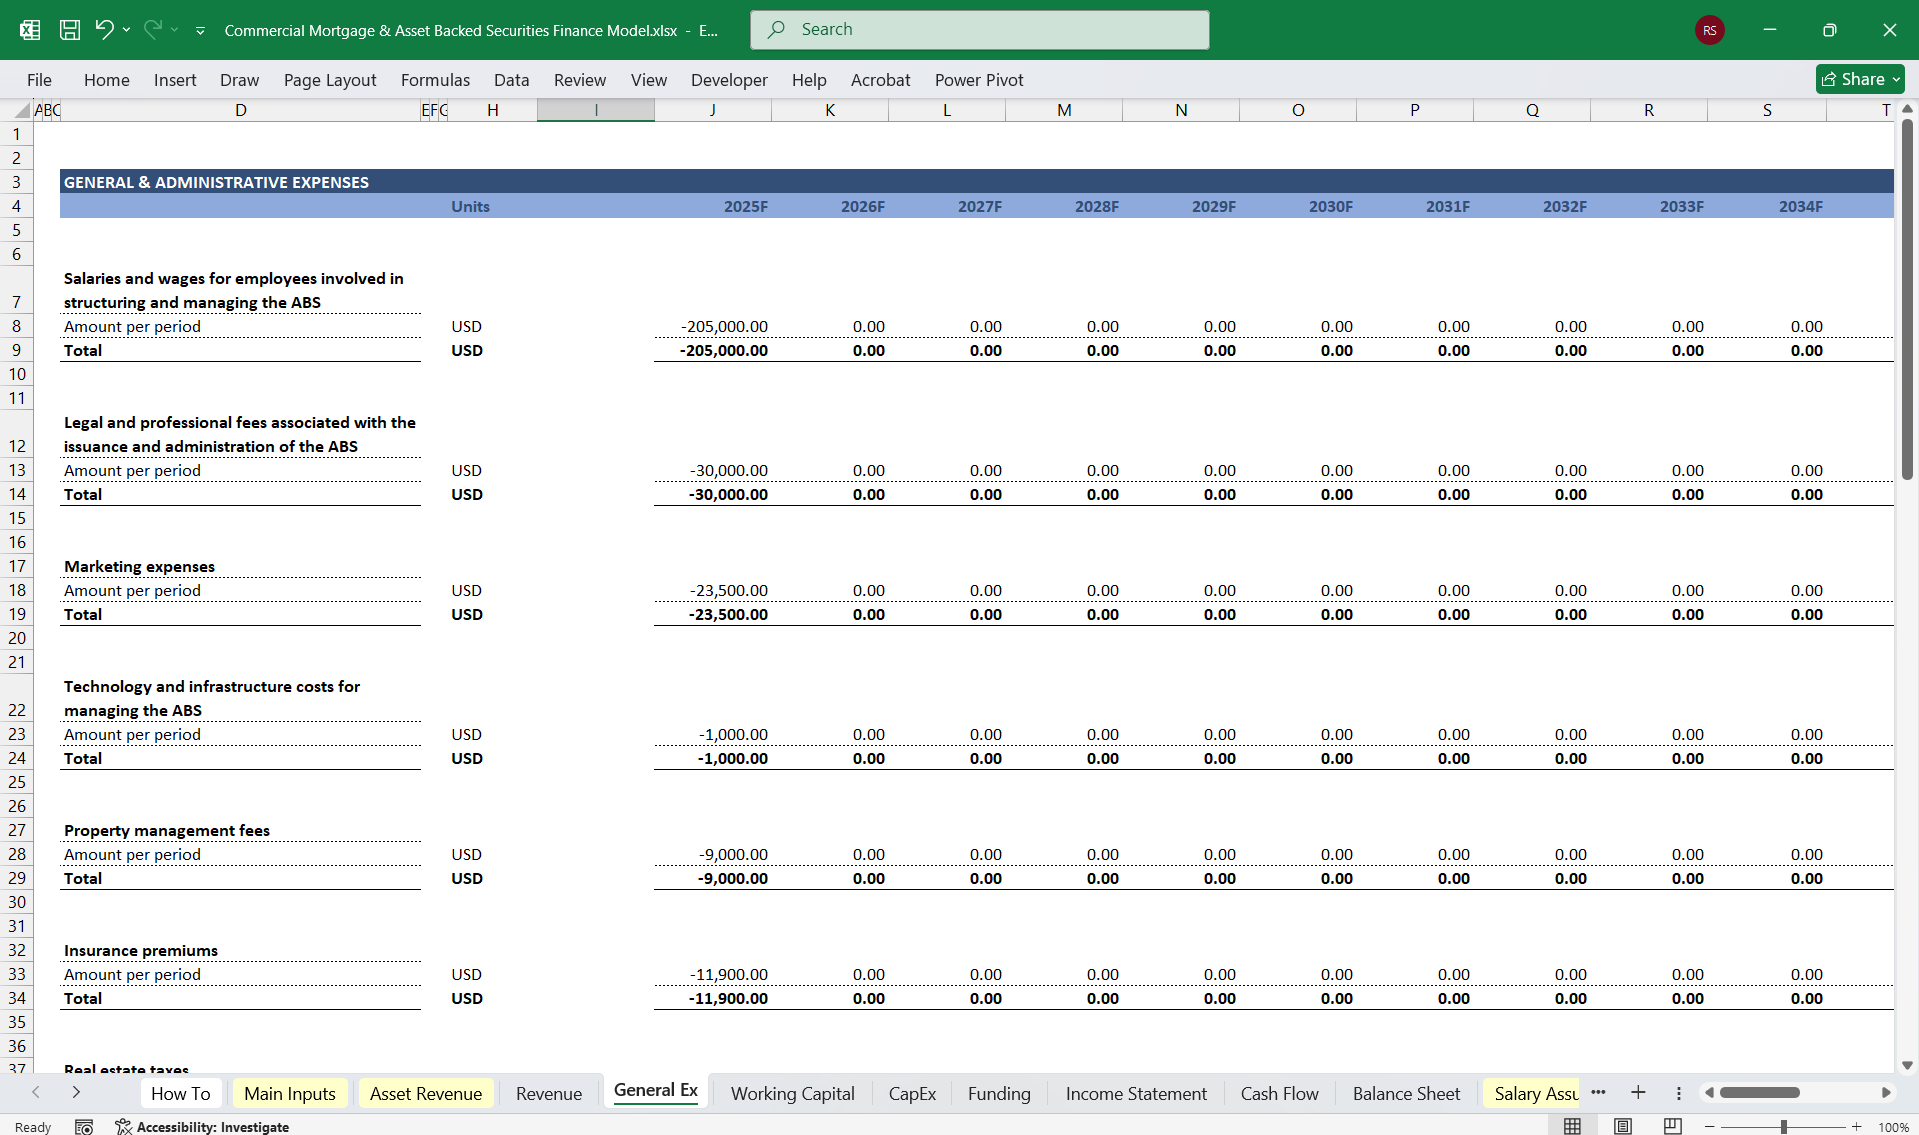
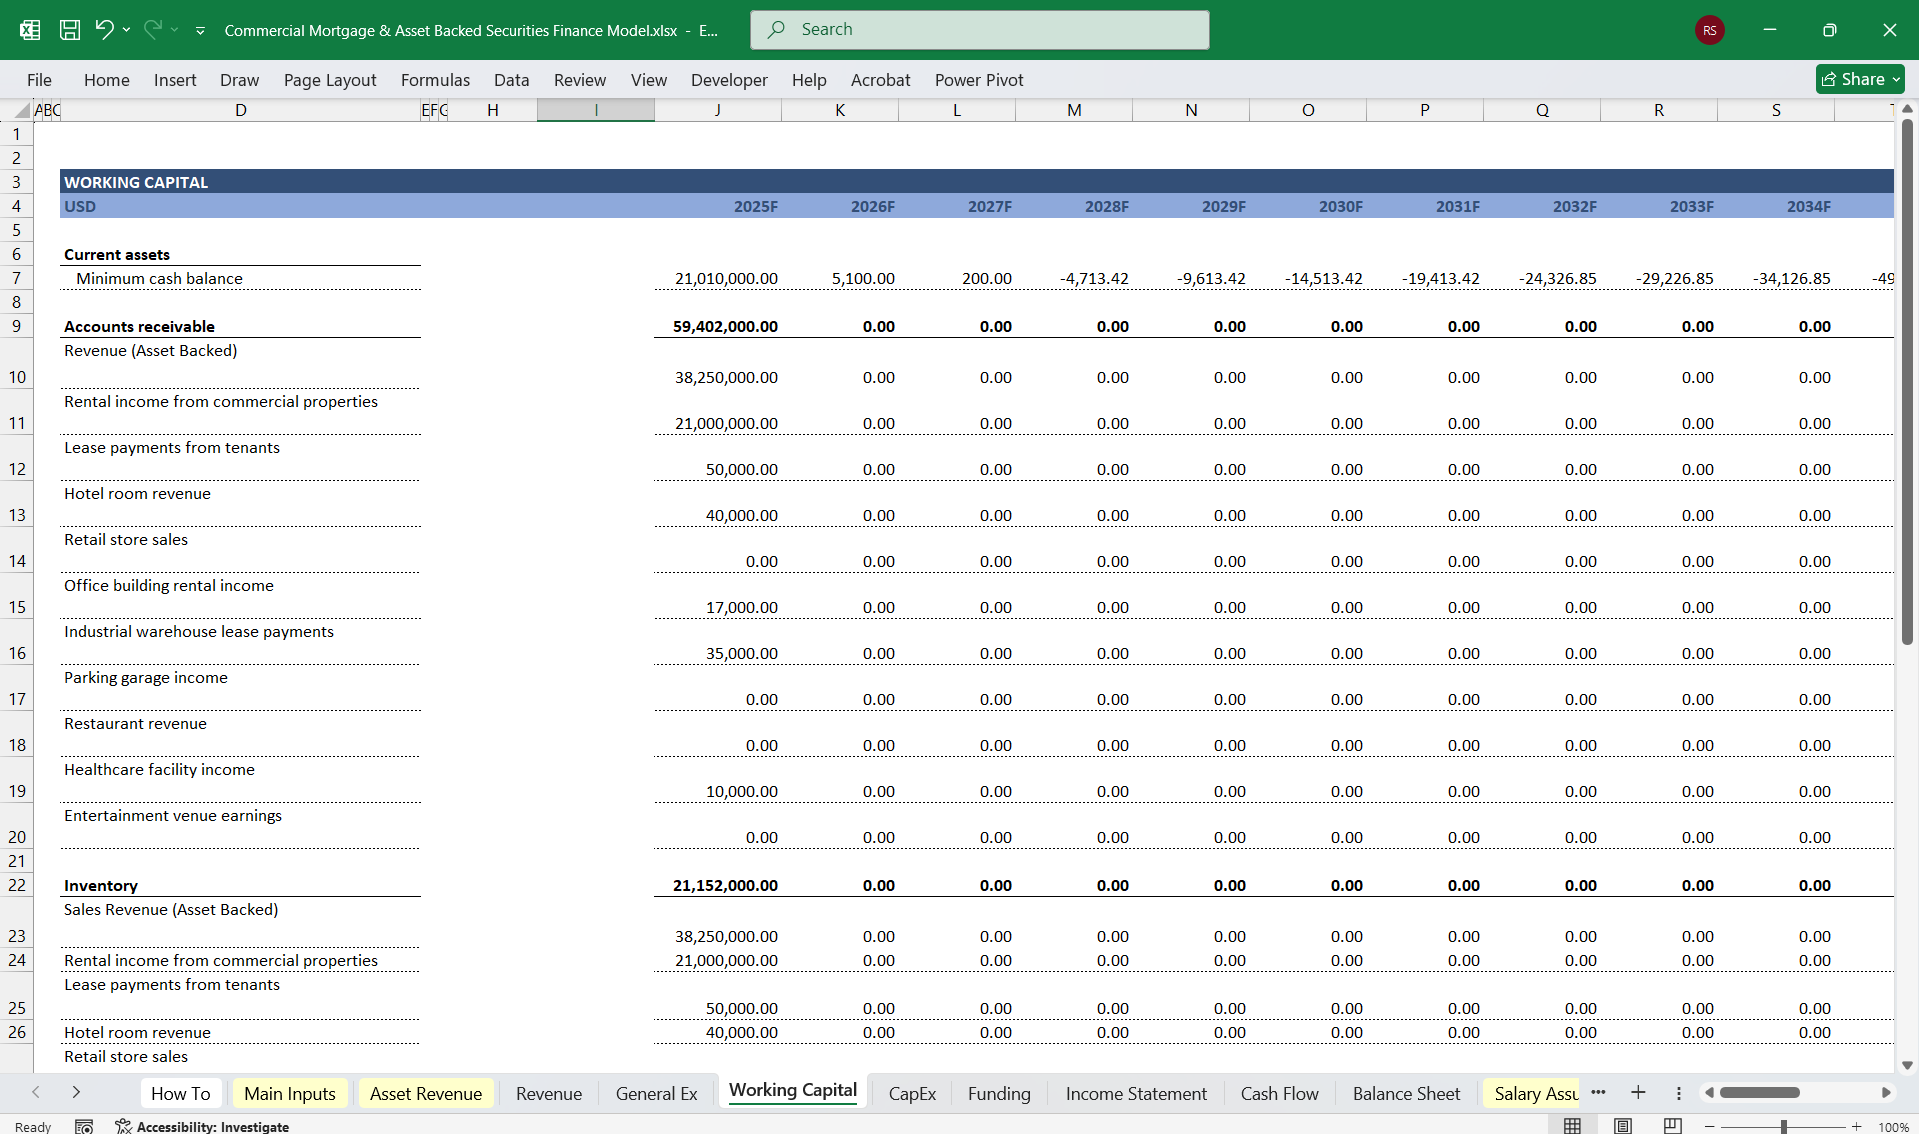
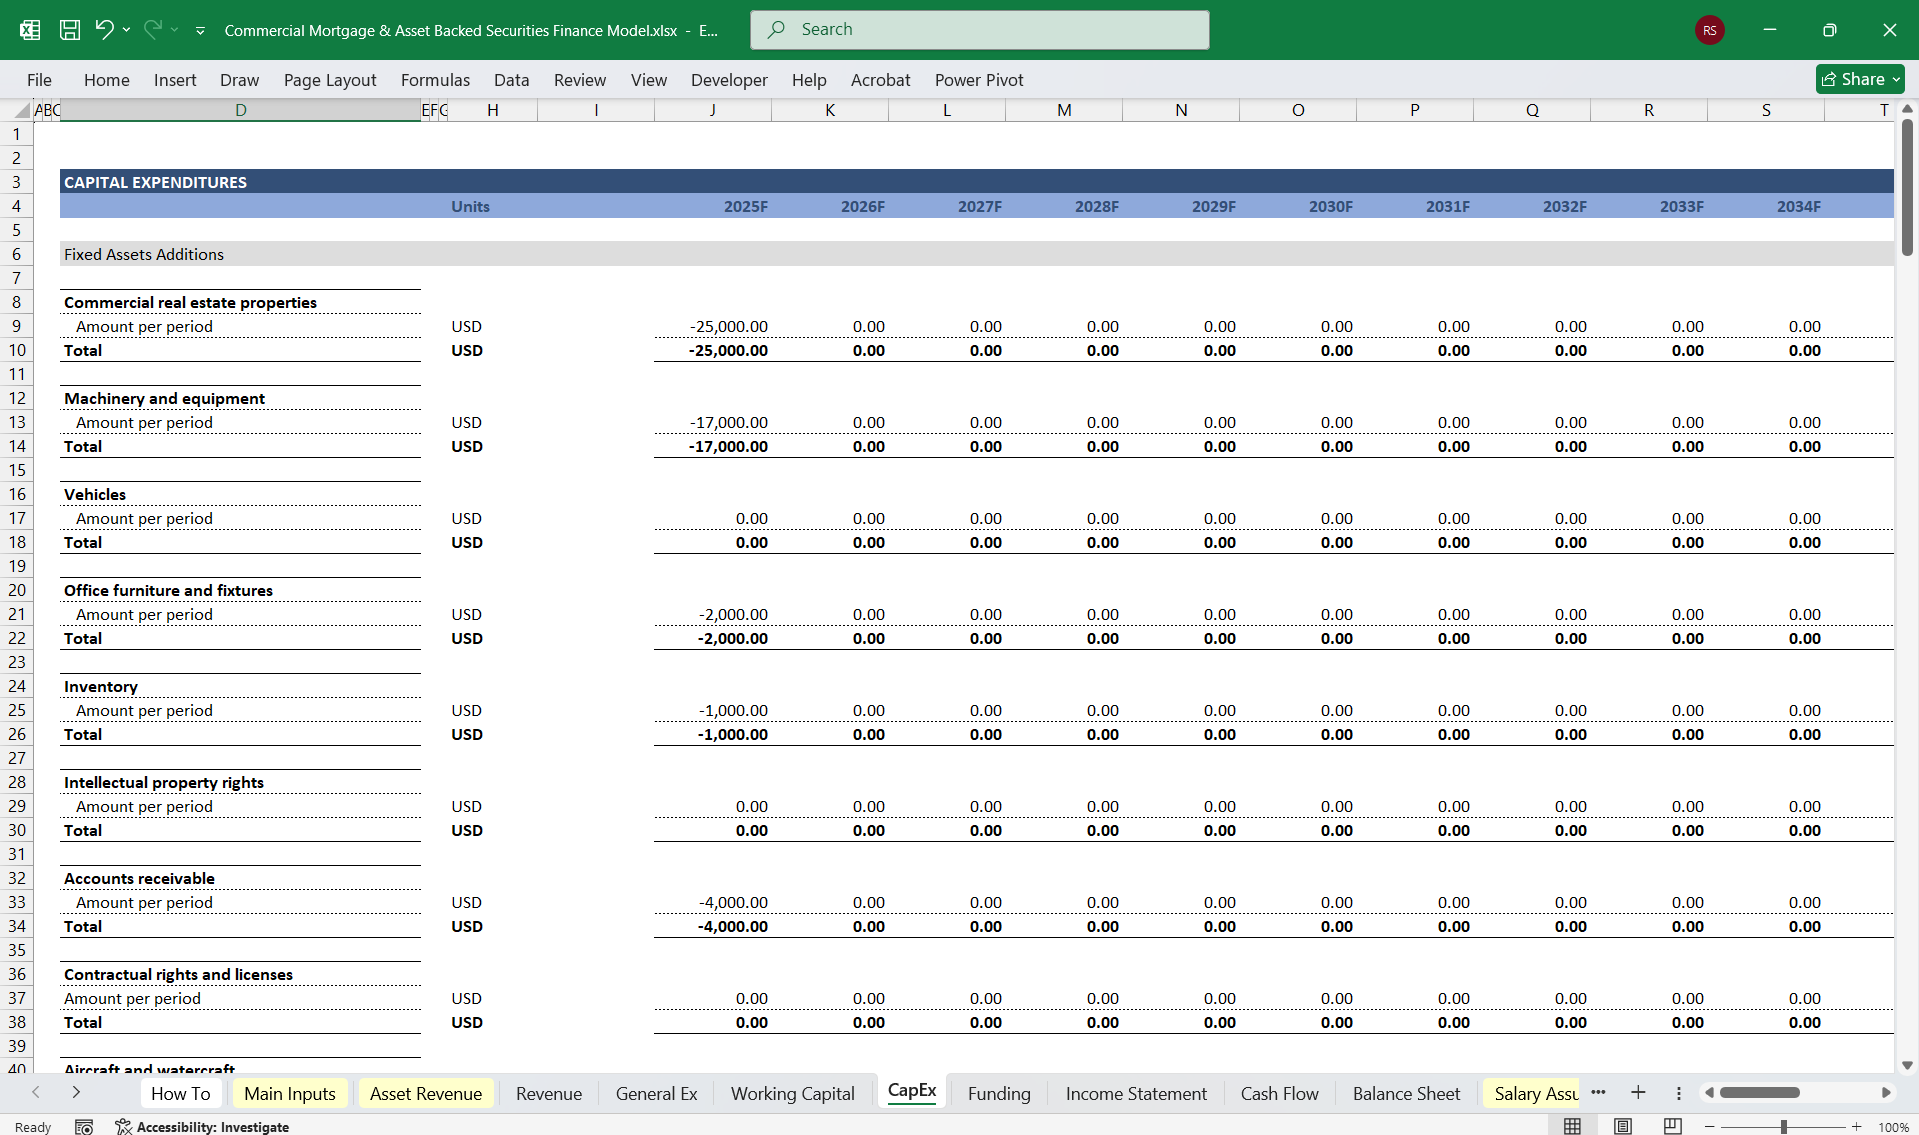
A 20-Year 3-Statement Commercial Mortgage & Asset-Backed Securities (CMBS) Finance Model incorporates interconnected financial statements to evaluate the cash flows, profitability, and investor performance of a commercial mortgage-backed security. Below is a detailed breakdown of the components and sections:
Model Overview
  1. Purpose: To analyze a 20-year CMBS investment scenario, projecting cash flows, assessing risks, determining profitability, and gauging returns to investors.
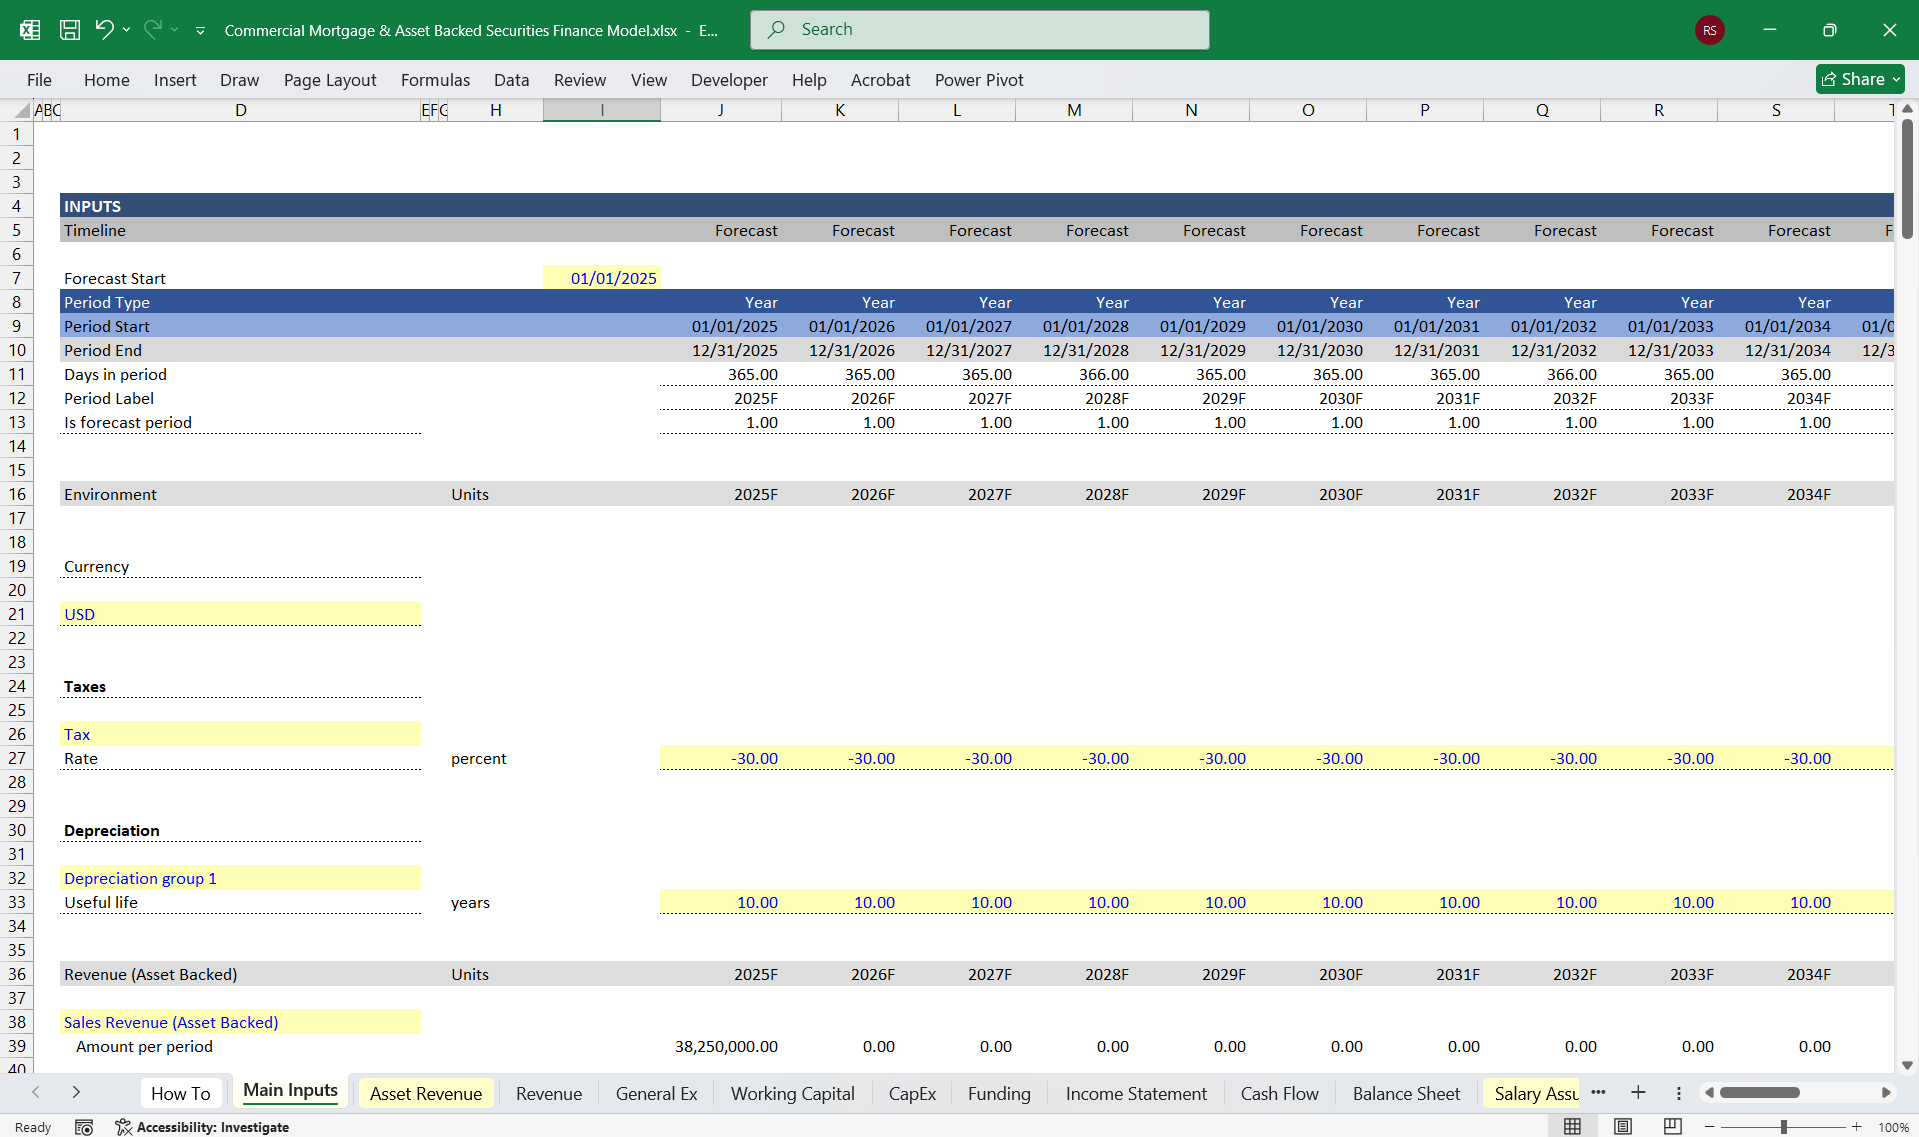
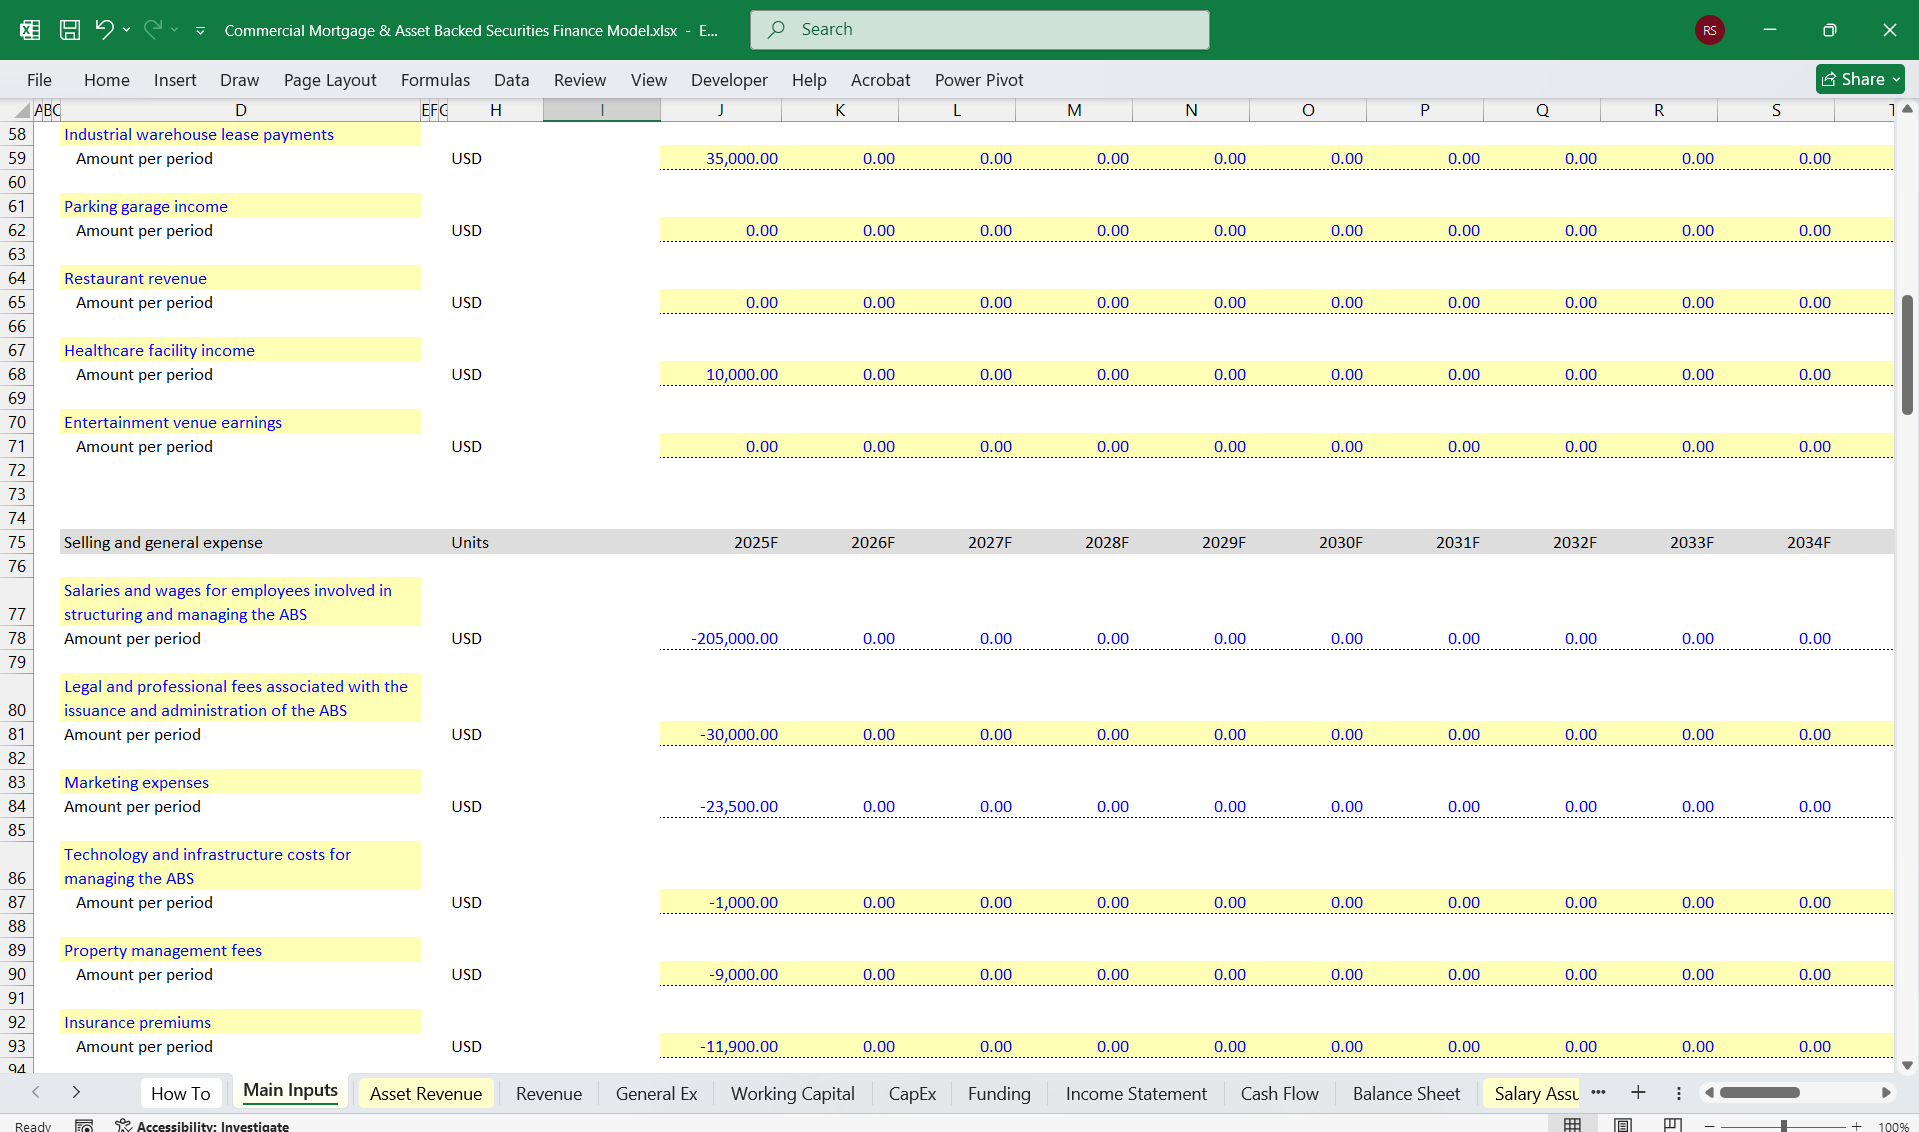
  2. Inputs: Loan structure, property cash flows, market assumptions (interest rates, property values), expenses, and securitization tranche specifications.
  3. Outputs: Projected income statement, balance sheet, cash flow statement, and investor performance metrics.
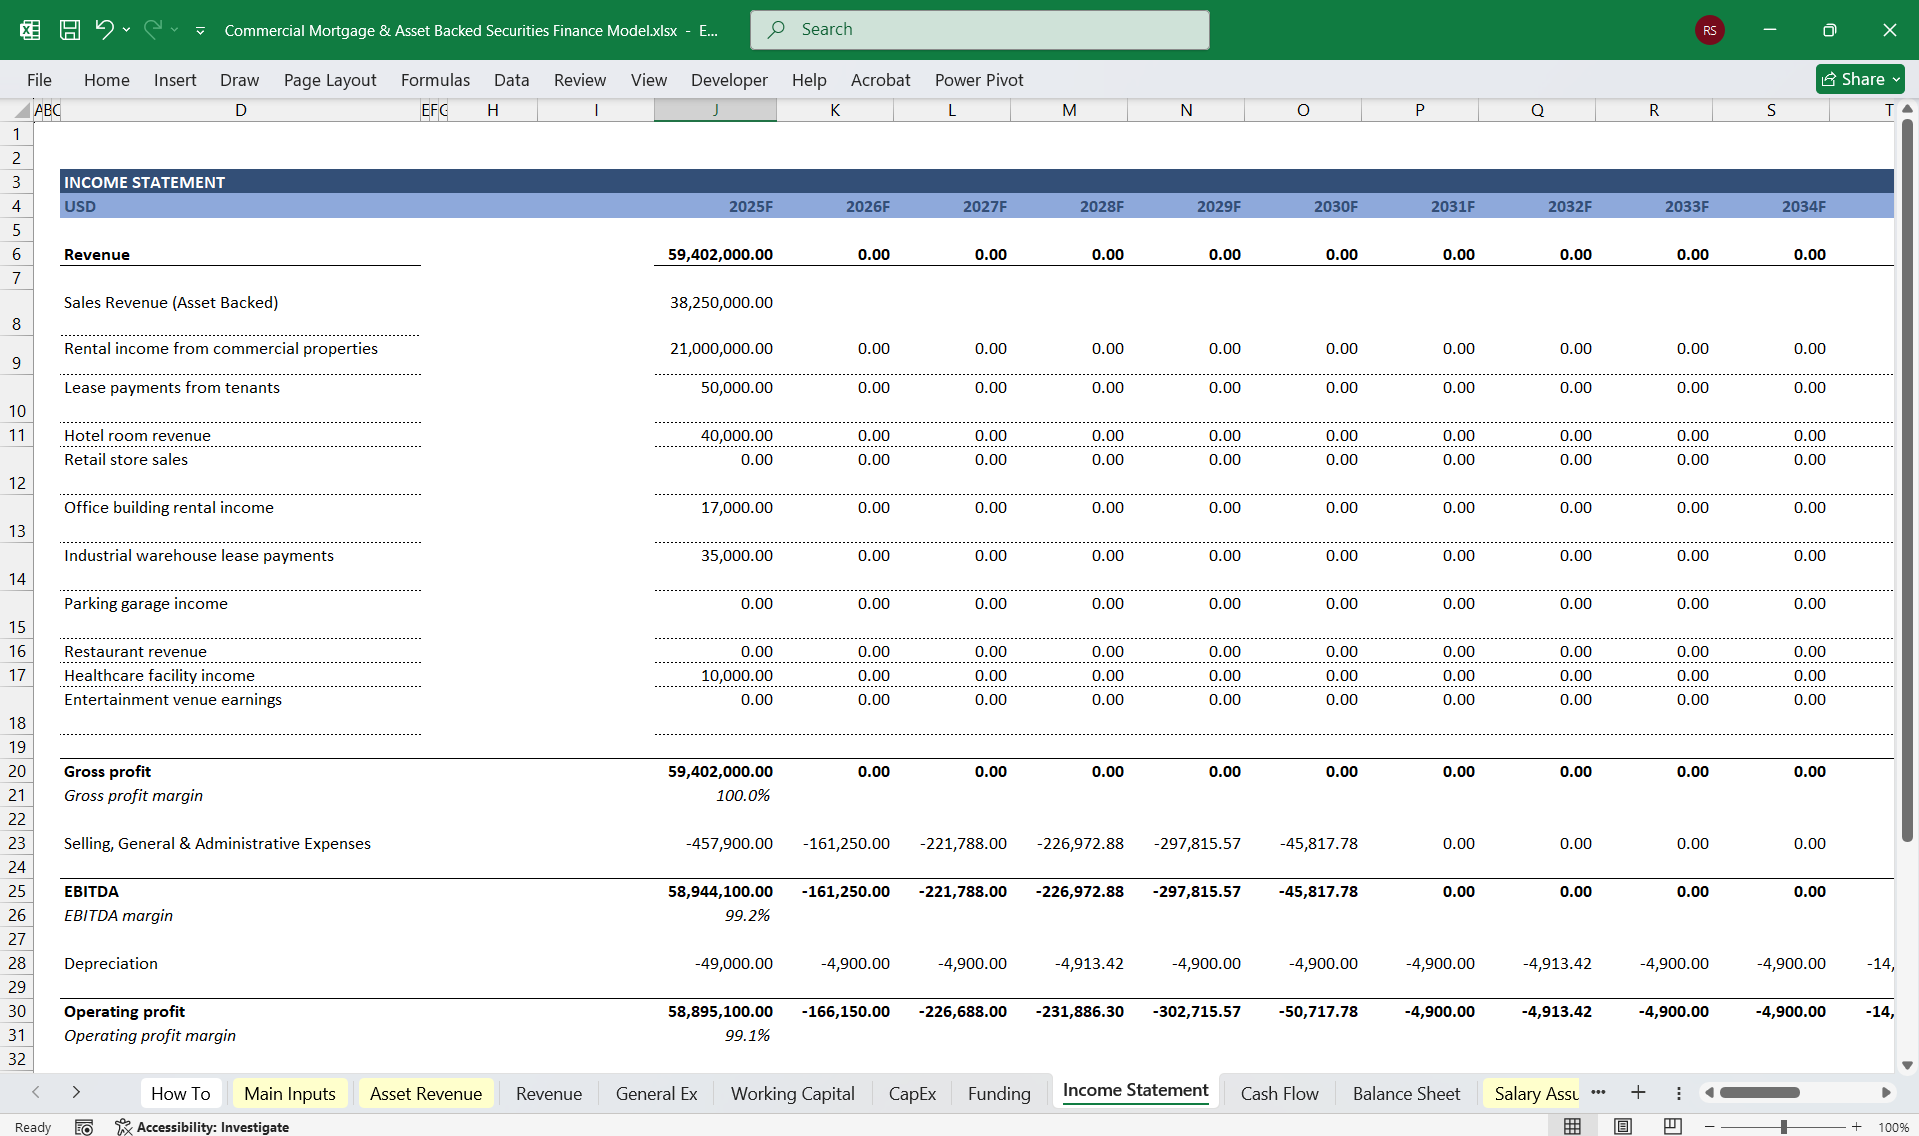
1. Income StatementThe income statement tracks revenues, costs, and profitability over the 20-year period. Key sections:
  1. Revenue Components:
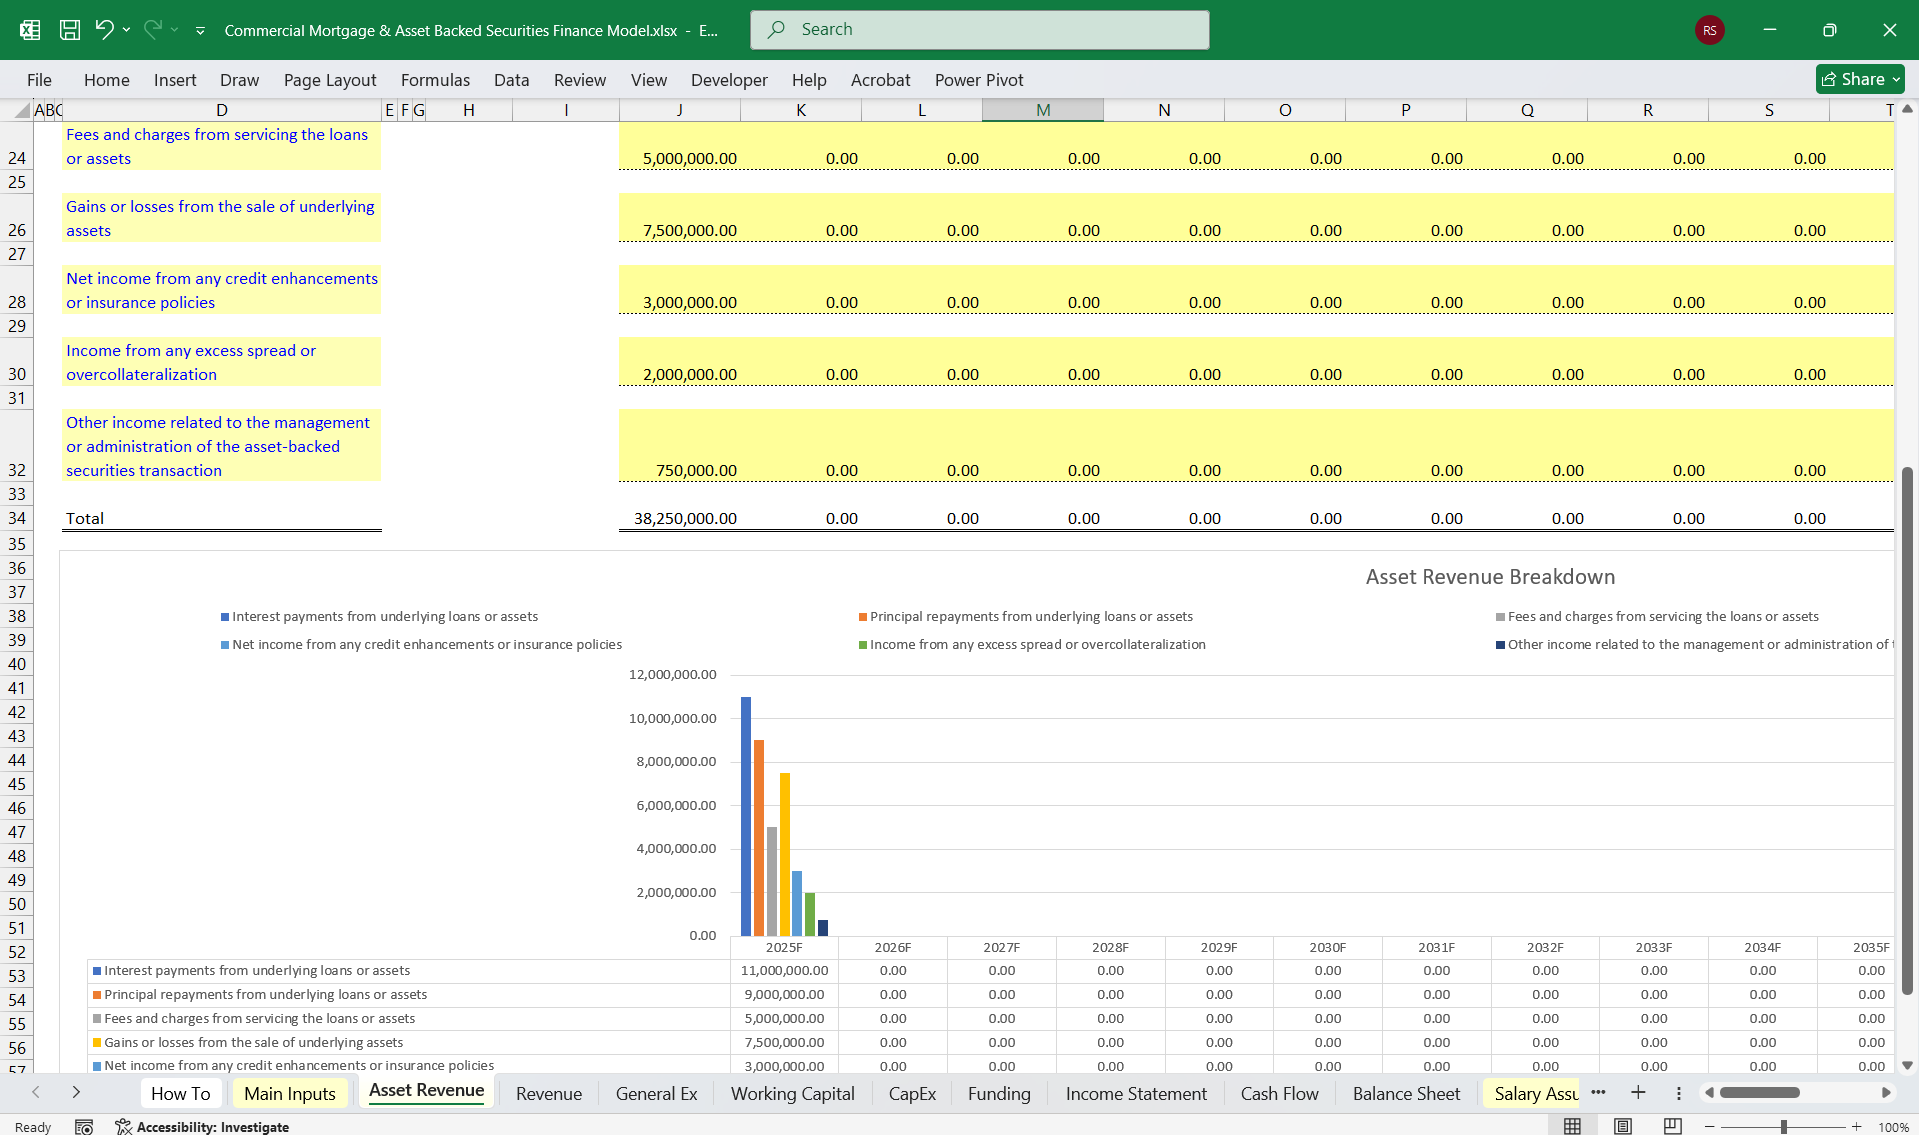
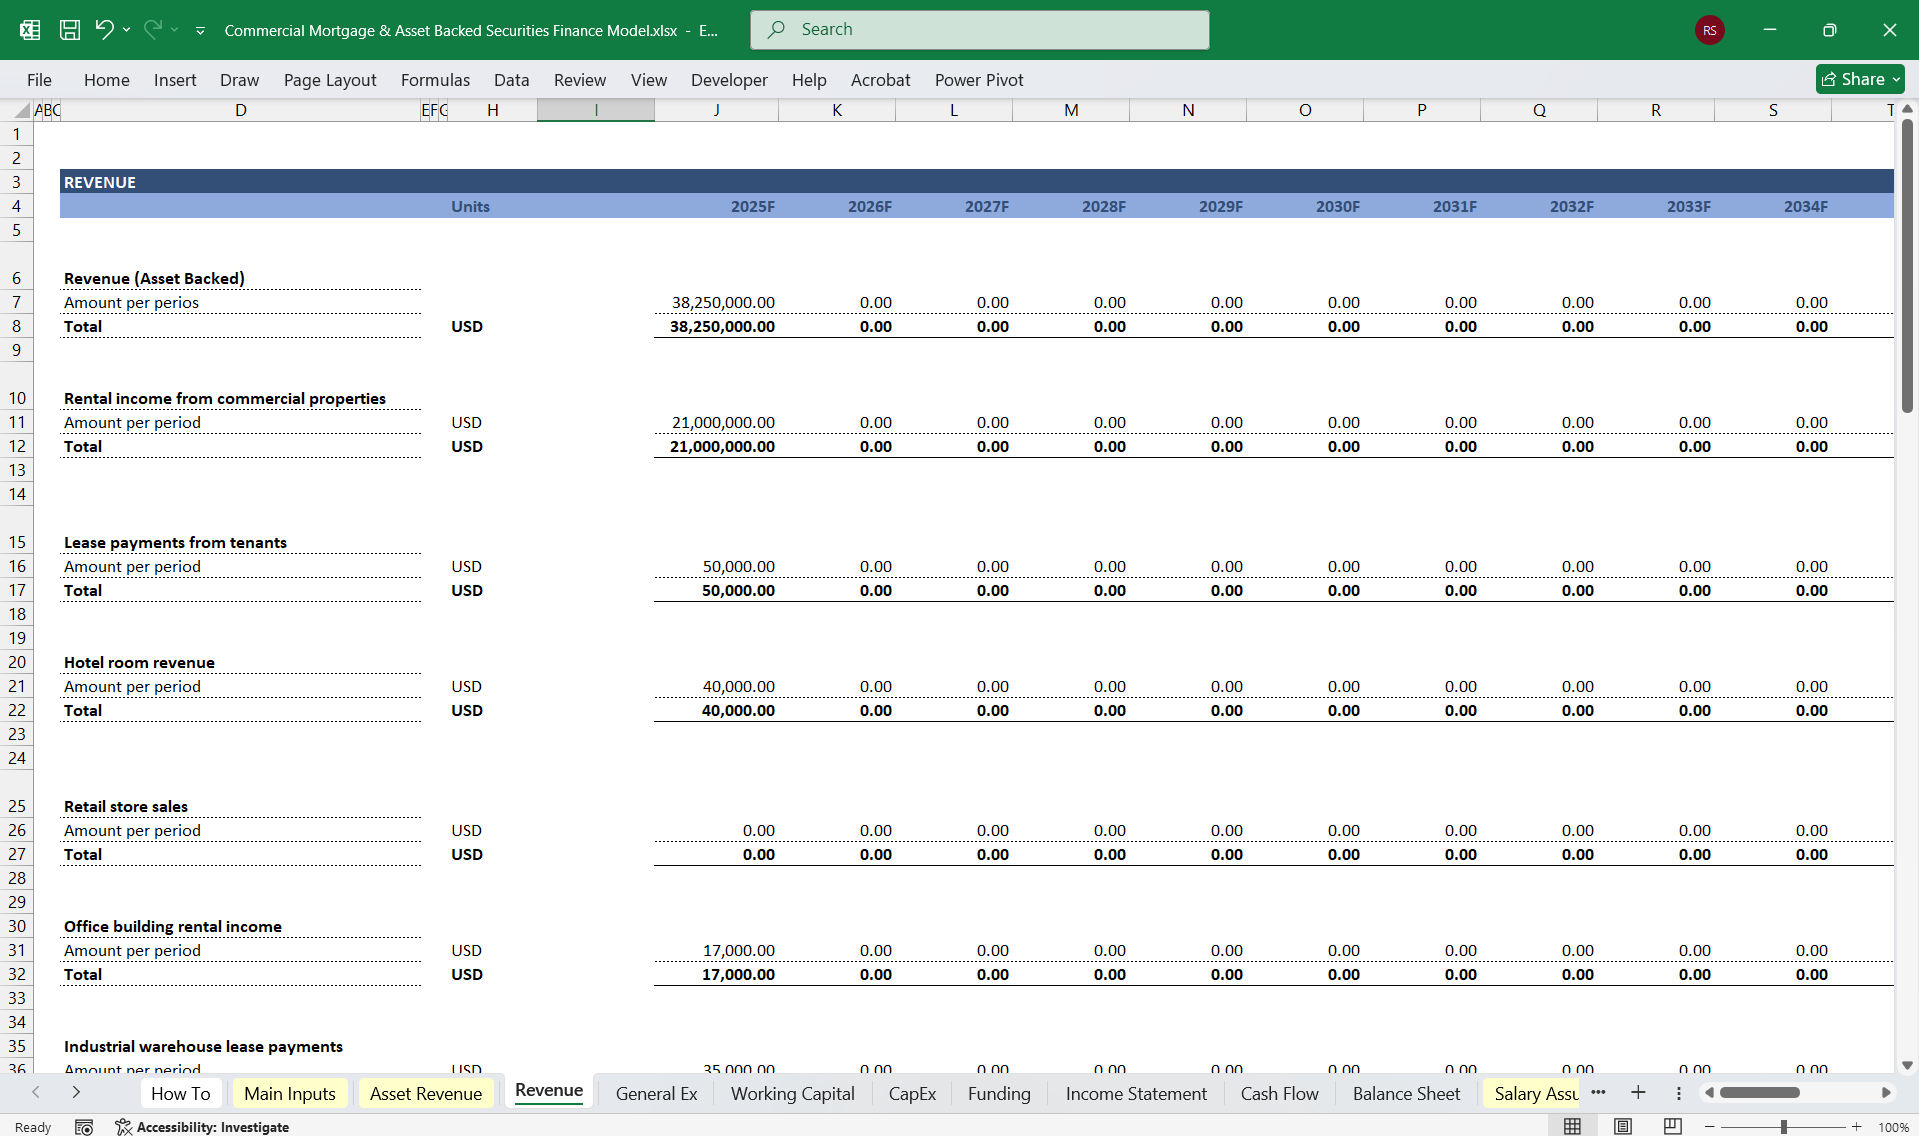
    • Loan Interest Income: Interest payments generated by the commercial mortgages in the pool.
    • Origination Fee Income: Fees earned from originating mortgages.
    • Late Payment/Prepayment Penalties: Assumed based on borrower behaviour and loan covenants.
  2. Expenses:
    • Loan Servicing Costs: Payment to service mortgage obligations.
    • Amortization of Fees and Costs: Spread origination fees and issuance costs over the expected life of the CMBS.
    • Credit Loss Provisions: Set aside for expected loan defaults.
    • Trust Management Fees: Administrative costs for CMBS trust operations.
  3. Other Income/Expense:
    • Hedging Gains/Losses: If interest rate swaps or caps are used.
    • Fair Value Adjustments: Revaluation of mortgage pool or securitized assets.
  4. Profitability Metrics:
    • Operating Income (EBIT).
    • Net Income Before Tax and After Tax.
2. Cash Flow StatementTracks inflows and outflows to provide insight into liquidity. This model is direct and categorized into three sections:
  1. Operating Cash Flows:
    • Cash Inflows: Interest payments, principal repayments, fee income, and penalties.
    • Cash Outflows: Operating expenses, servicing costs, credit loss reserves.
    • Net Cash Flow: Essential for ensuring cash flow sufficiency to pay bondholders.
  2. Investing Cash Flows:
    • Mortgage Origination Costs: Disbursements for mortgage loans.
    • Proceeds from Prepayments or Property Sales: Recoveries or gains from early loan repayment or foreclosures.
  3. Financing Cash Flows:
    • Securitization Proceeds: Issuance of CMBS tranches.
    • Investor Payouts: Interest and principal payments to CMBS holders.
    • Debt Service Costs: Repayment of trust debt.
  4. Ending Cash Balances:
    • Ensures cash reserve accounts and excess spread reserves are replenished for future coverage.
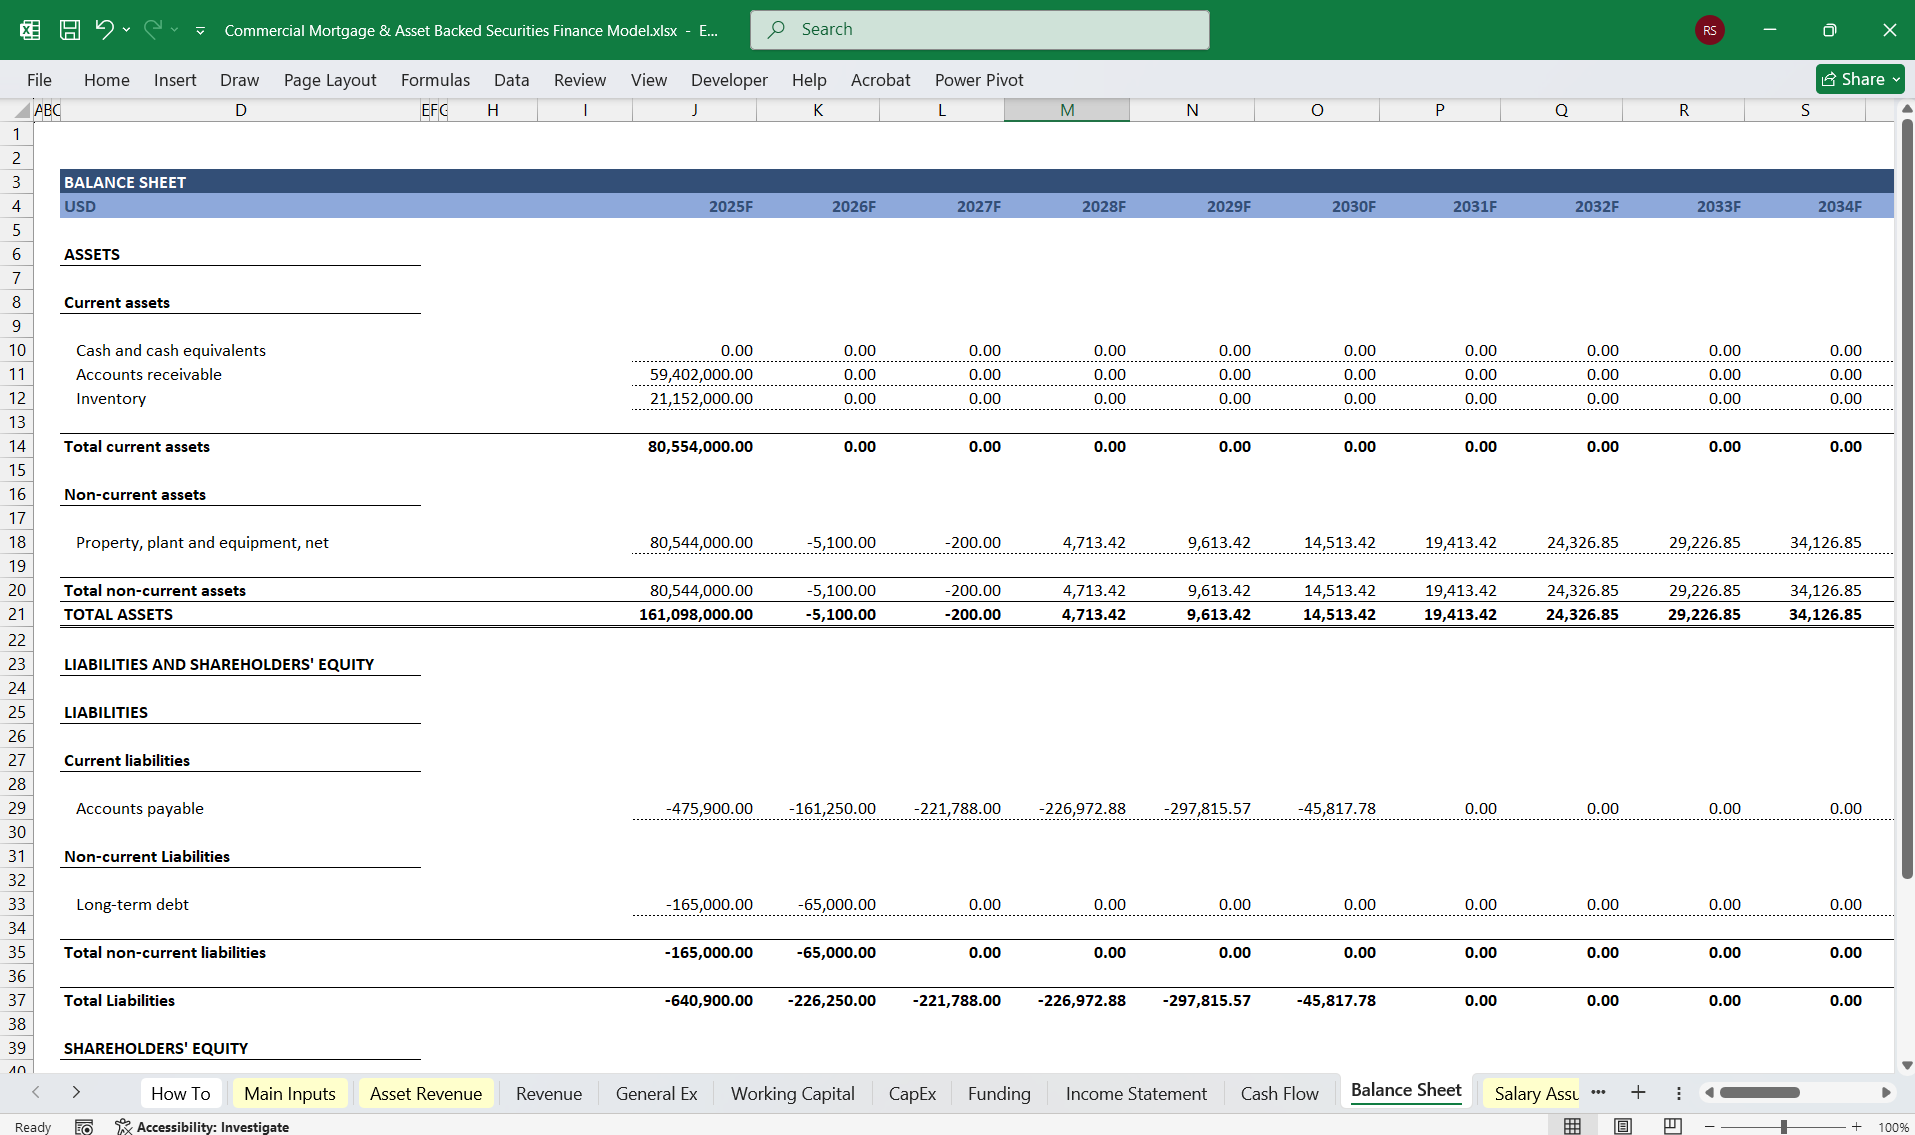
3. Balance SheetRepresents the financial position of the CMBS trust over 20 years.
  1. Assets:
    • Mortgage Loan Pool: Value of outstanding principal of loans, adjusted for defaults, repayments, and prepayments.
    • Cash Reserves: Trust reserves for contingencies, interest coverage, and credit enhancement.
    • Other Assets: Accrued interest receivable, property collateral value (for defaulted loans).
  2. Liabilities:
    • Securitized Debt: CMBS tranches, with breakdown by seniority and payment priority (A, B, mezzanine, etc.).
    • Accrued Expenses: Outstanding trust costs or management fees.
    • Credit Loss Reserves: Accounted separately under liabilities.
  3. Equity:
    • Excess Spread/Residual: Accumulated trust income after paying liabilities.
    • Unrealized Gains/Losses: Value changes in mortgage pool or hedging instruments.
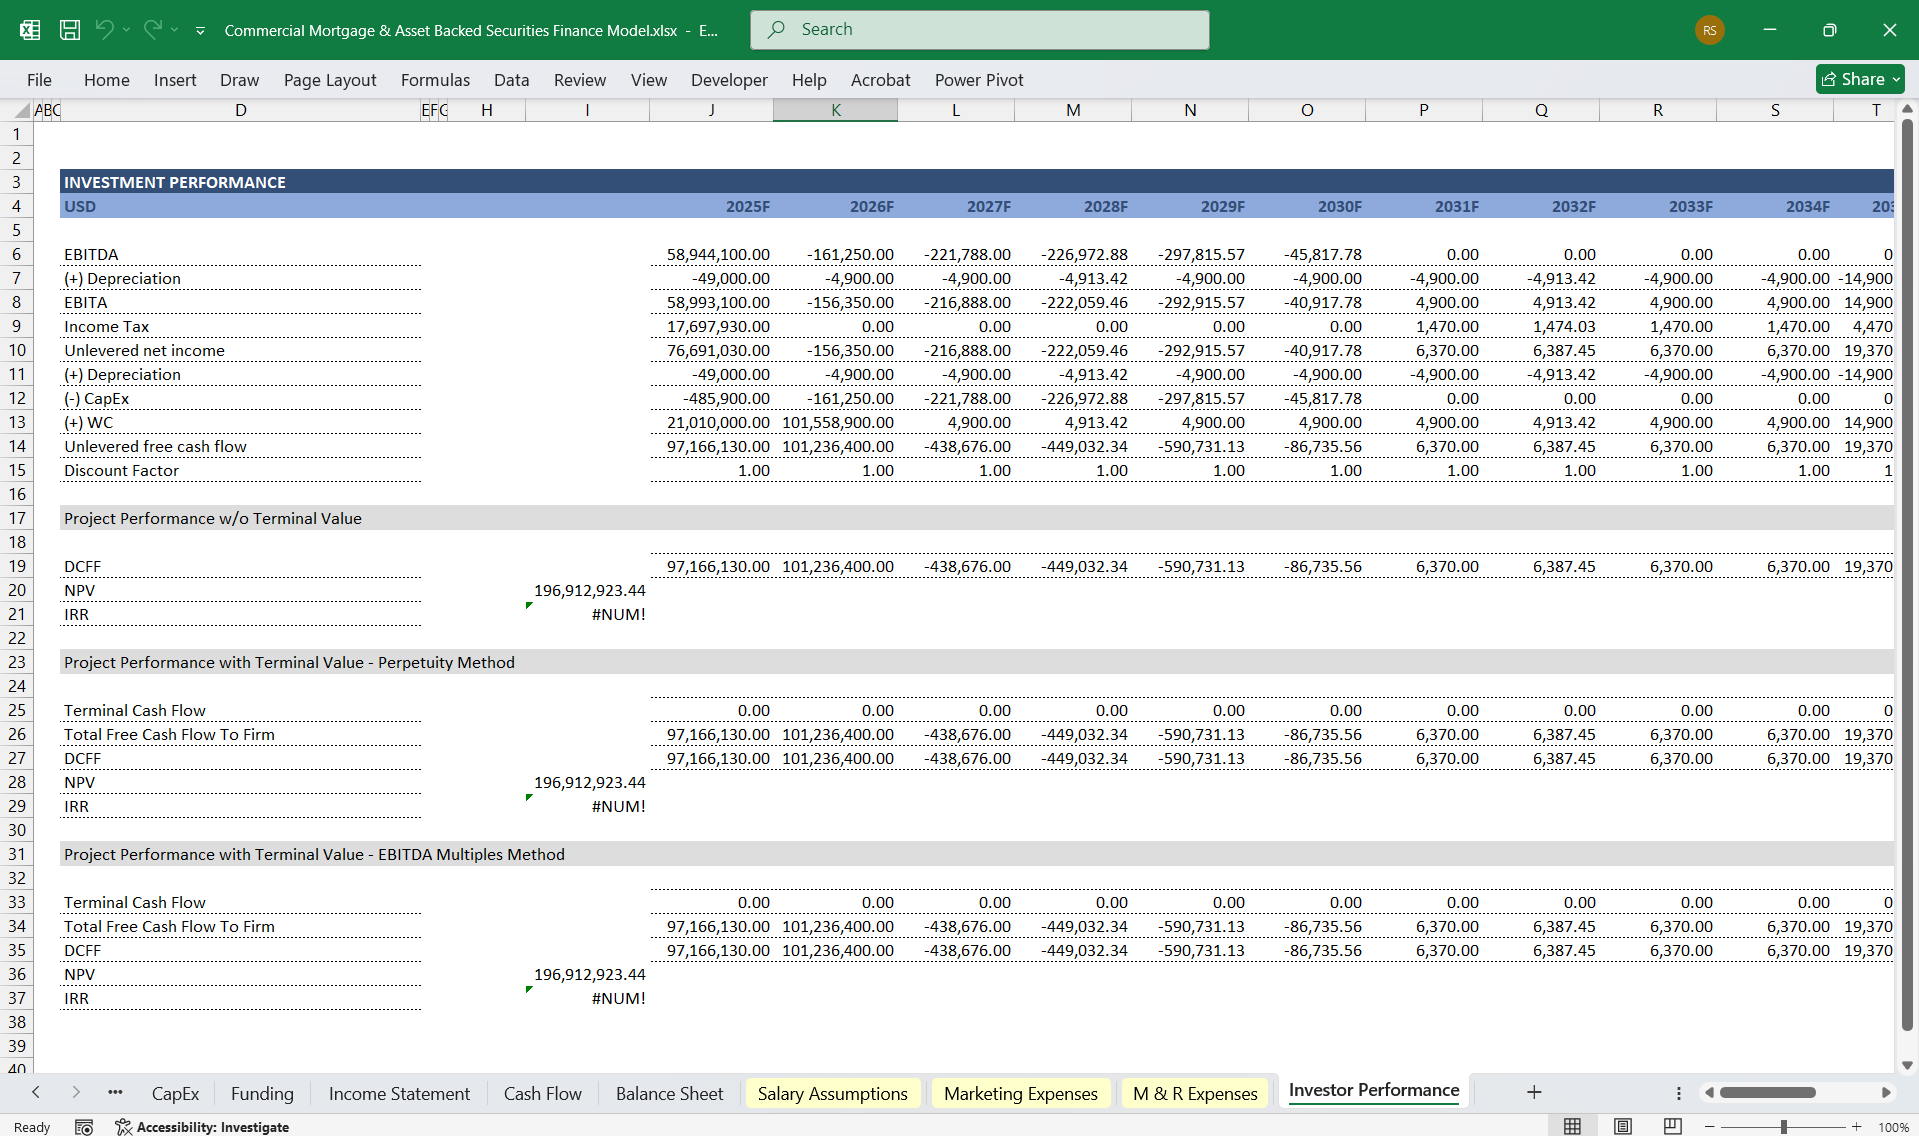
4. Investor PerformanceFocuses on return metrics for CMBS investors.
  1. Key Metrics:
    • Internal Rate of Return (IRR): Determines profitability for different CMBS tranches.
    • Net Present Value (NPV): Discounted cash flow analysis for tranche cash flows.
    • Weighted Average Life (WAL): Duration analysis for cash flows to tranches.
    • Loss Coverage Ratio: Measures extent of subordination protection for senior tranches.
    • Yield to Maturity (YTM): Reflects returns based on holding to maturity.
  2. Stress Testing:
    • Default Scenarios: Assess impact on investor payouts.
    • Prepayment Scenarios: Measure yield variability with faster or slower prepayments.
    • Interest Rate Sensitivity: Gauge how rising/falling rates influence tranche performance.
  3. Equity Holders Analysis:
    • Residual Cash Flow Distributions: Surplus after debt servicing.
    • Profit Distribution Timing: Dictates payout sequencing.
Model Integration
  • Interdependencies: Cash flow projections directly influence the income statement and balance sheet through interest income, reserves, and tranche payments.
  • Scenario Analysis: Embedded functionality to test various market assumptions like property value depreciation, default rates, and interest rate spikes.
  • Investor Reporting: Schedules for interest/principal payouts and performance updates tailored to tranche types.

This Best Practice includes
1 Excel Financial Model

Acquire business license for $110.00

Add to cart

Add to bookmarks

Discuss

Further information

Provides thorough oversight, tracking, and reportingcombined Commercial Mortgage (CMBS) & Asset-Backed Securities (ABS) finances, including updates on budget utilisation and projections.


0.0 / 5 (0 votes)

please wait...