
Originally published: 13/01/2025 16:53
Publication number: ELQ-74084-1
View all versions & Certificate
Publication number: ELQ-74084-1
View all versions & Certificate

Cosmetics Manufacturer Finance Model Excel Template
A comprehensive editable, 5 Year 3 statement MS Excel spreadsheet for tracking a Cosmetics Manufacture's finances
 by AllFinancialModels
AllFinancialModels offer a curated selection of high-quality yet financial model templates designed to support a wide range of business needs.Follow
cosmeticsmanufacturingmanufacturermakeupcosmetics & beautyexcelfinancefinancial modelspreadsheethair & beauty
Description
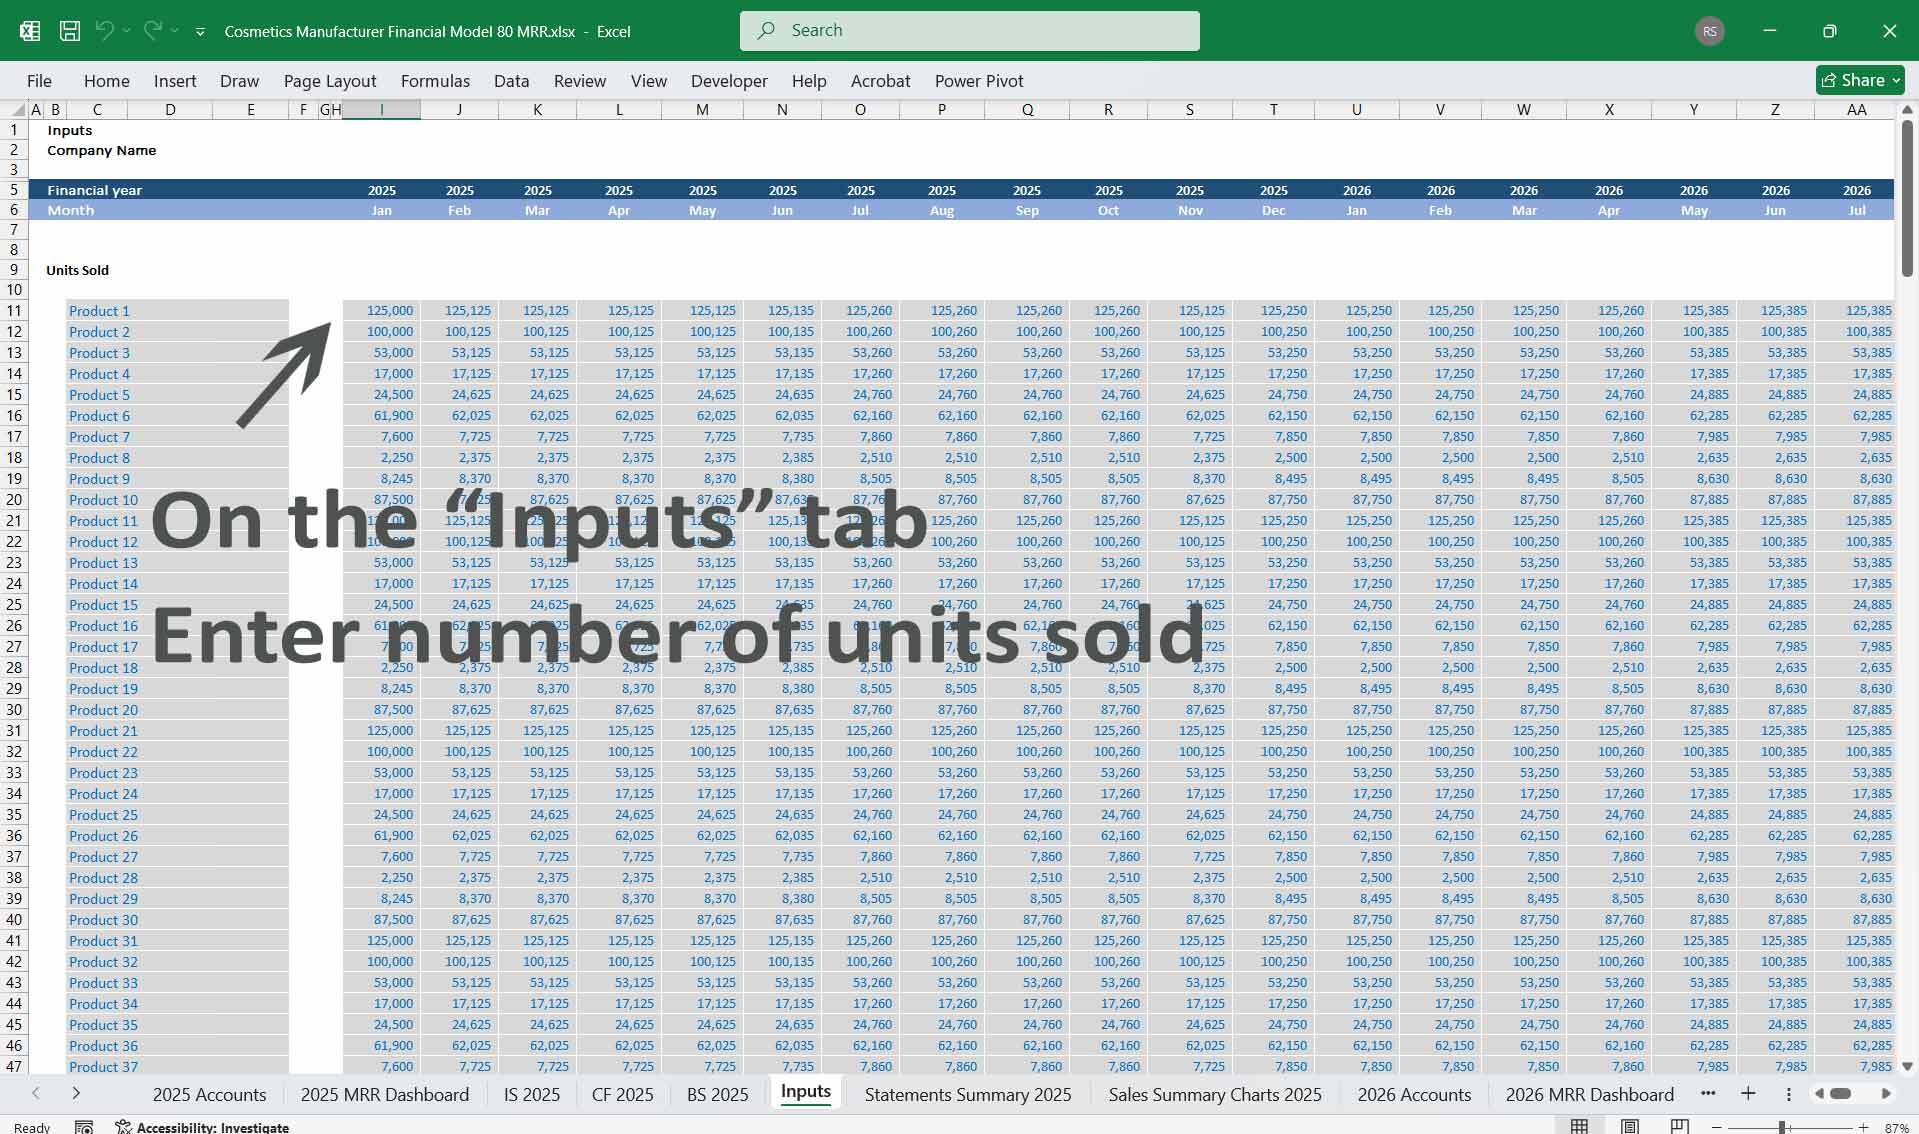
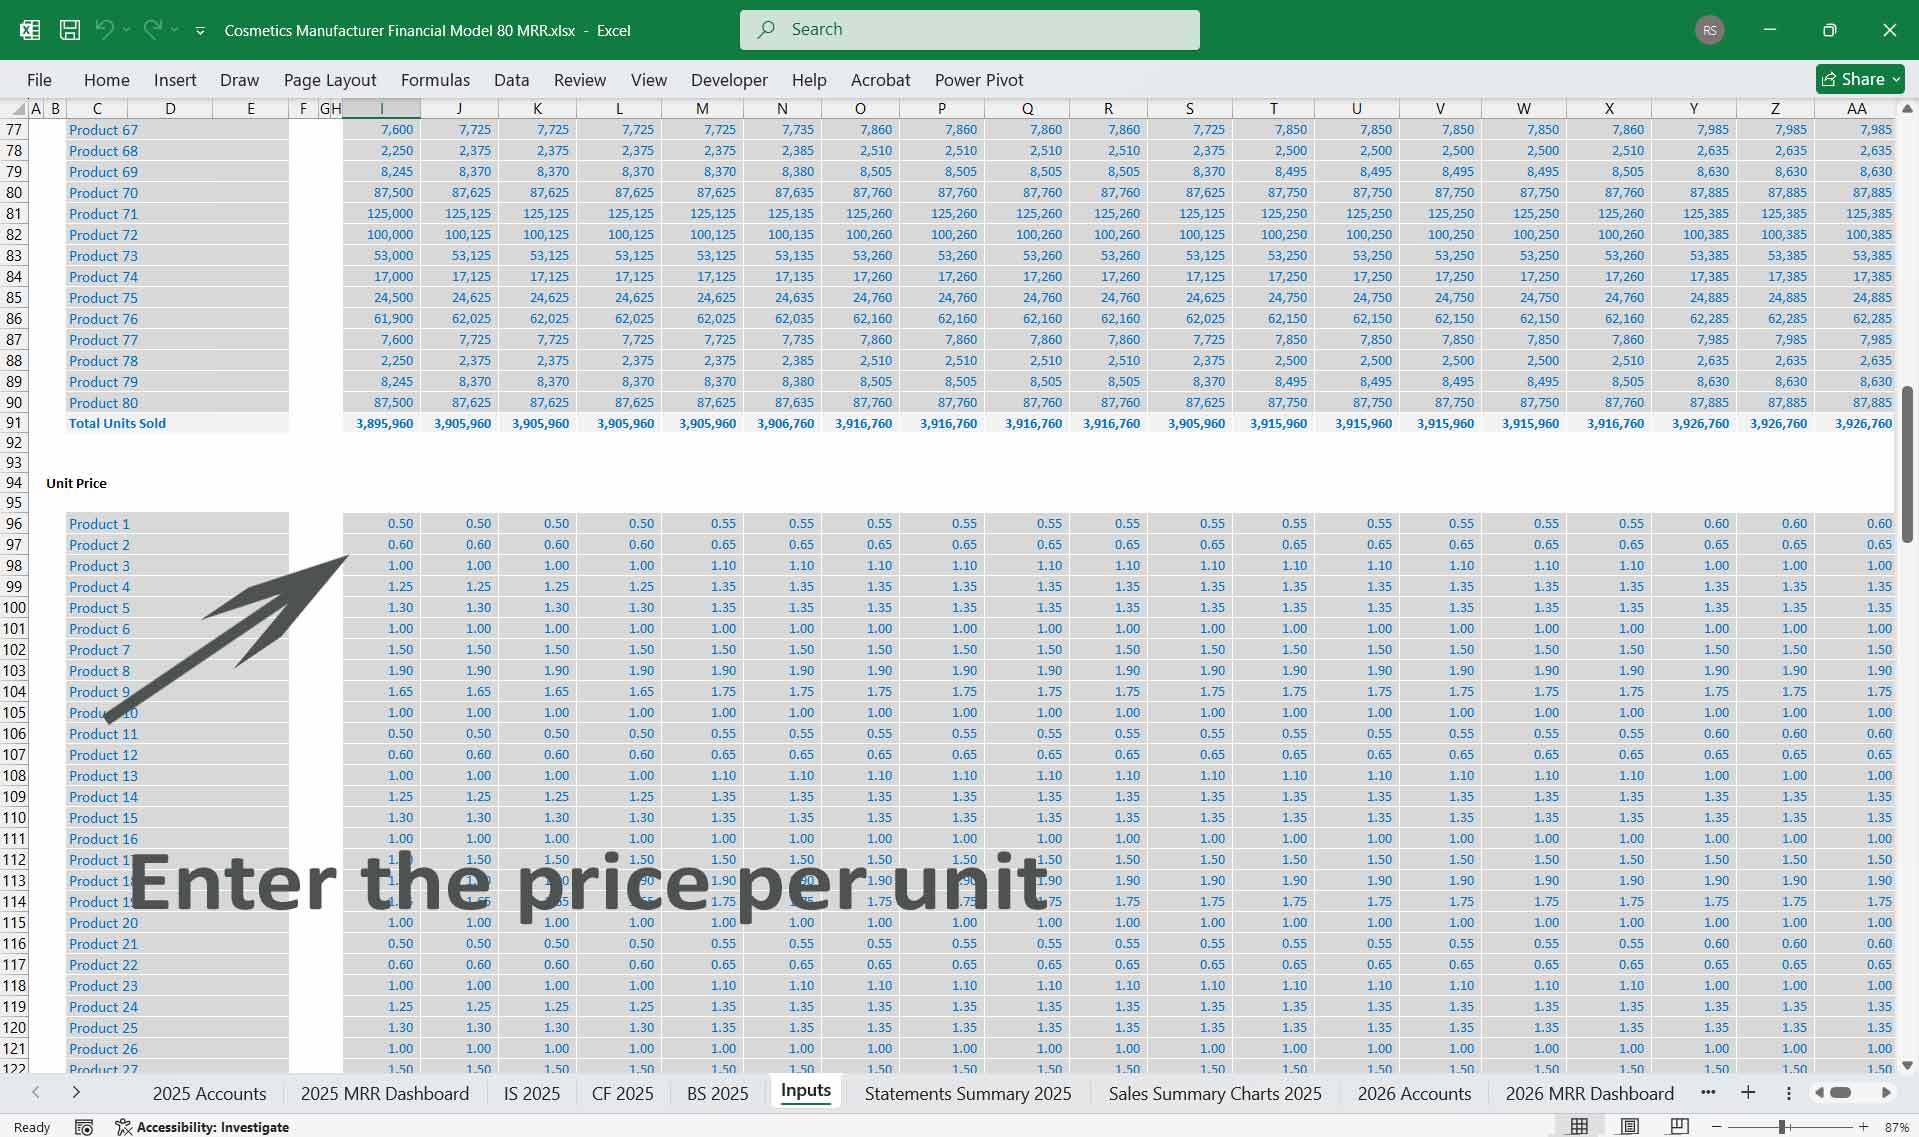
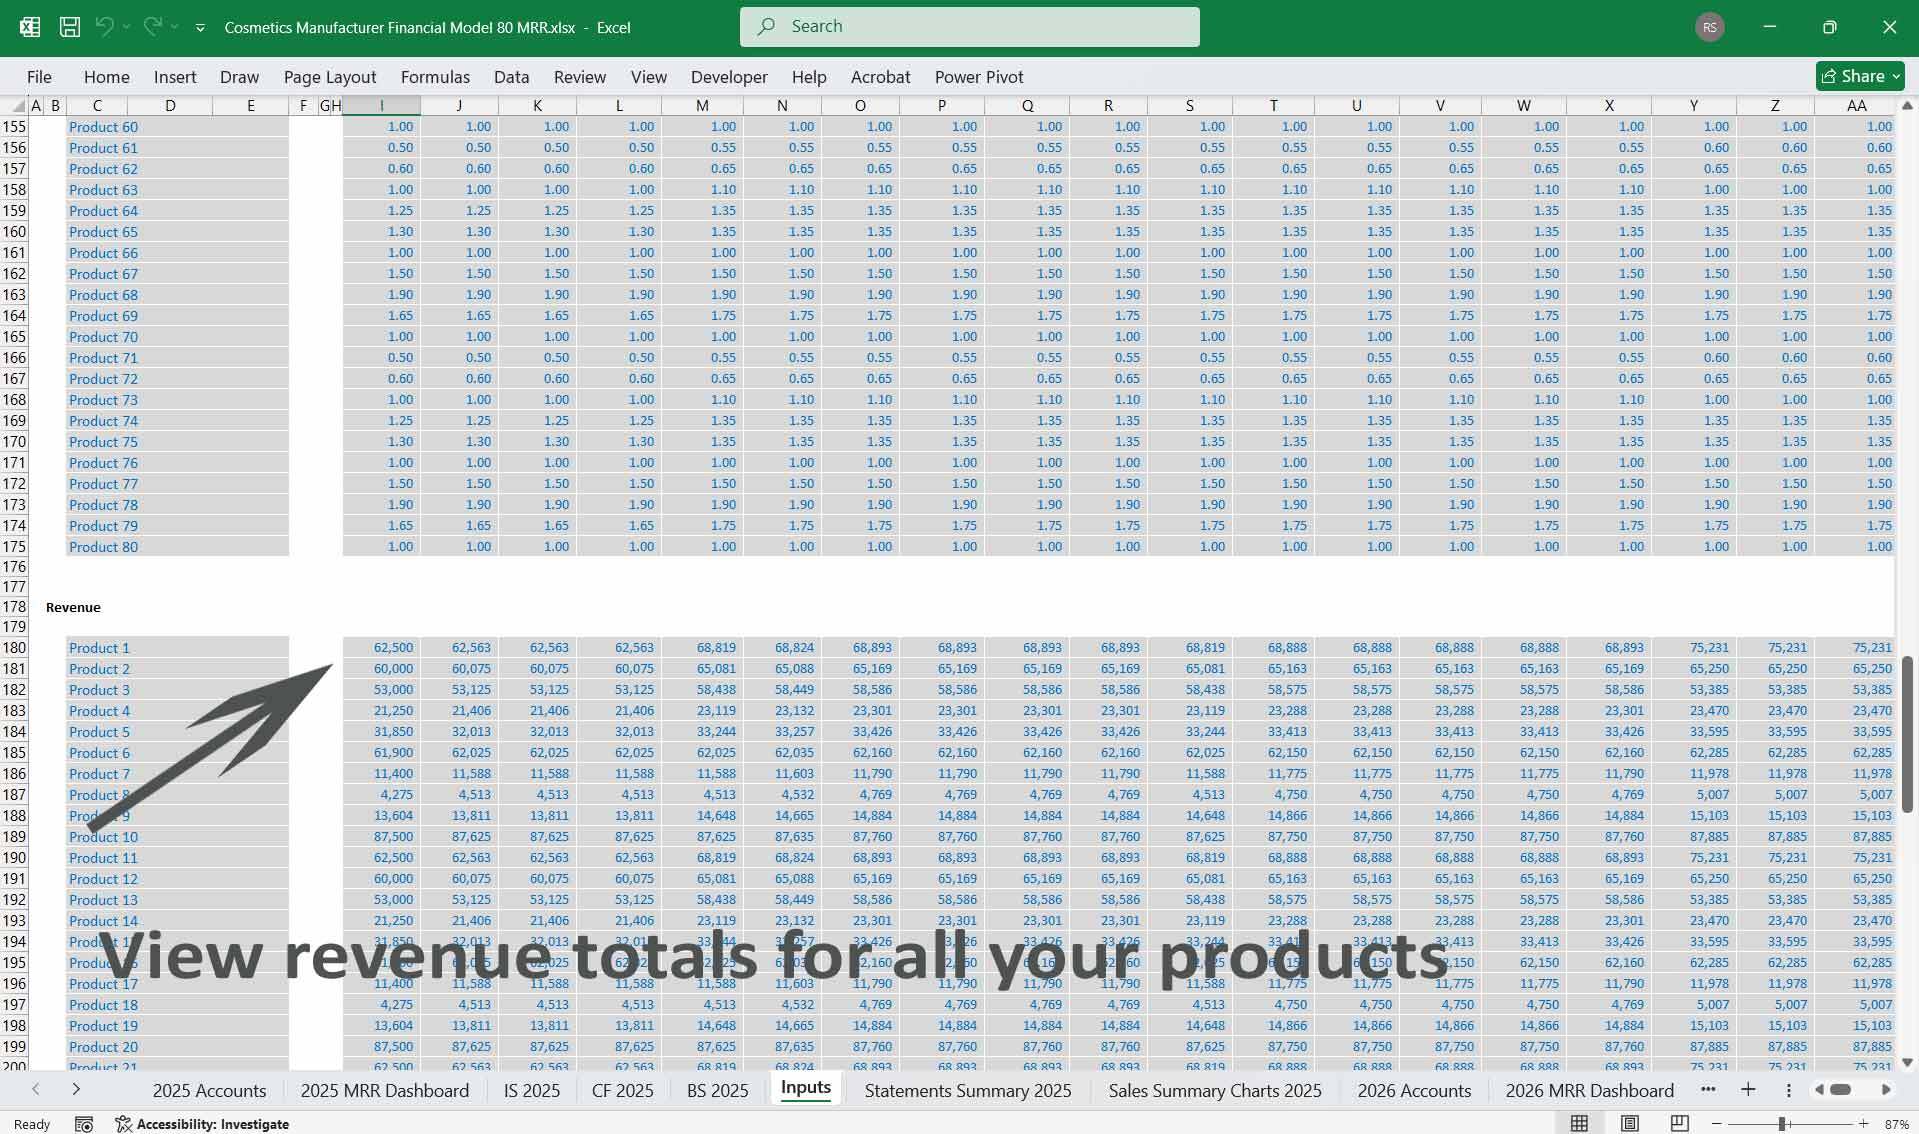
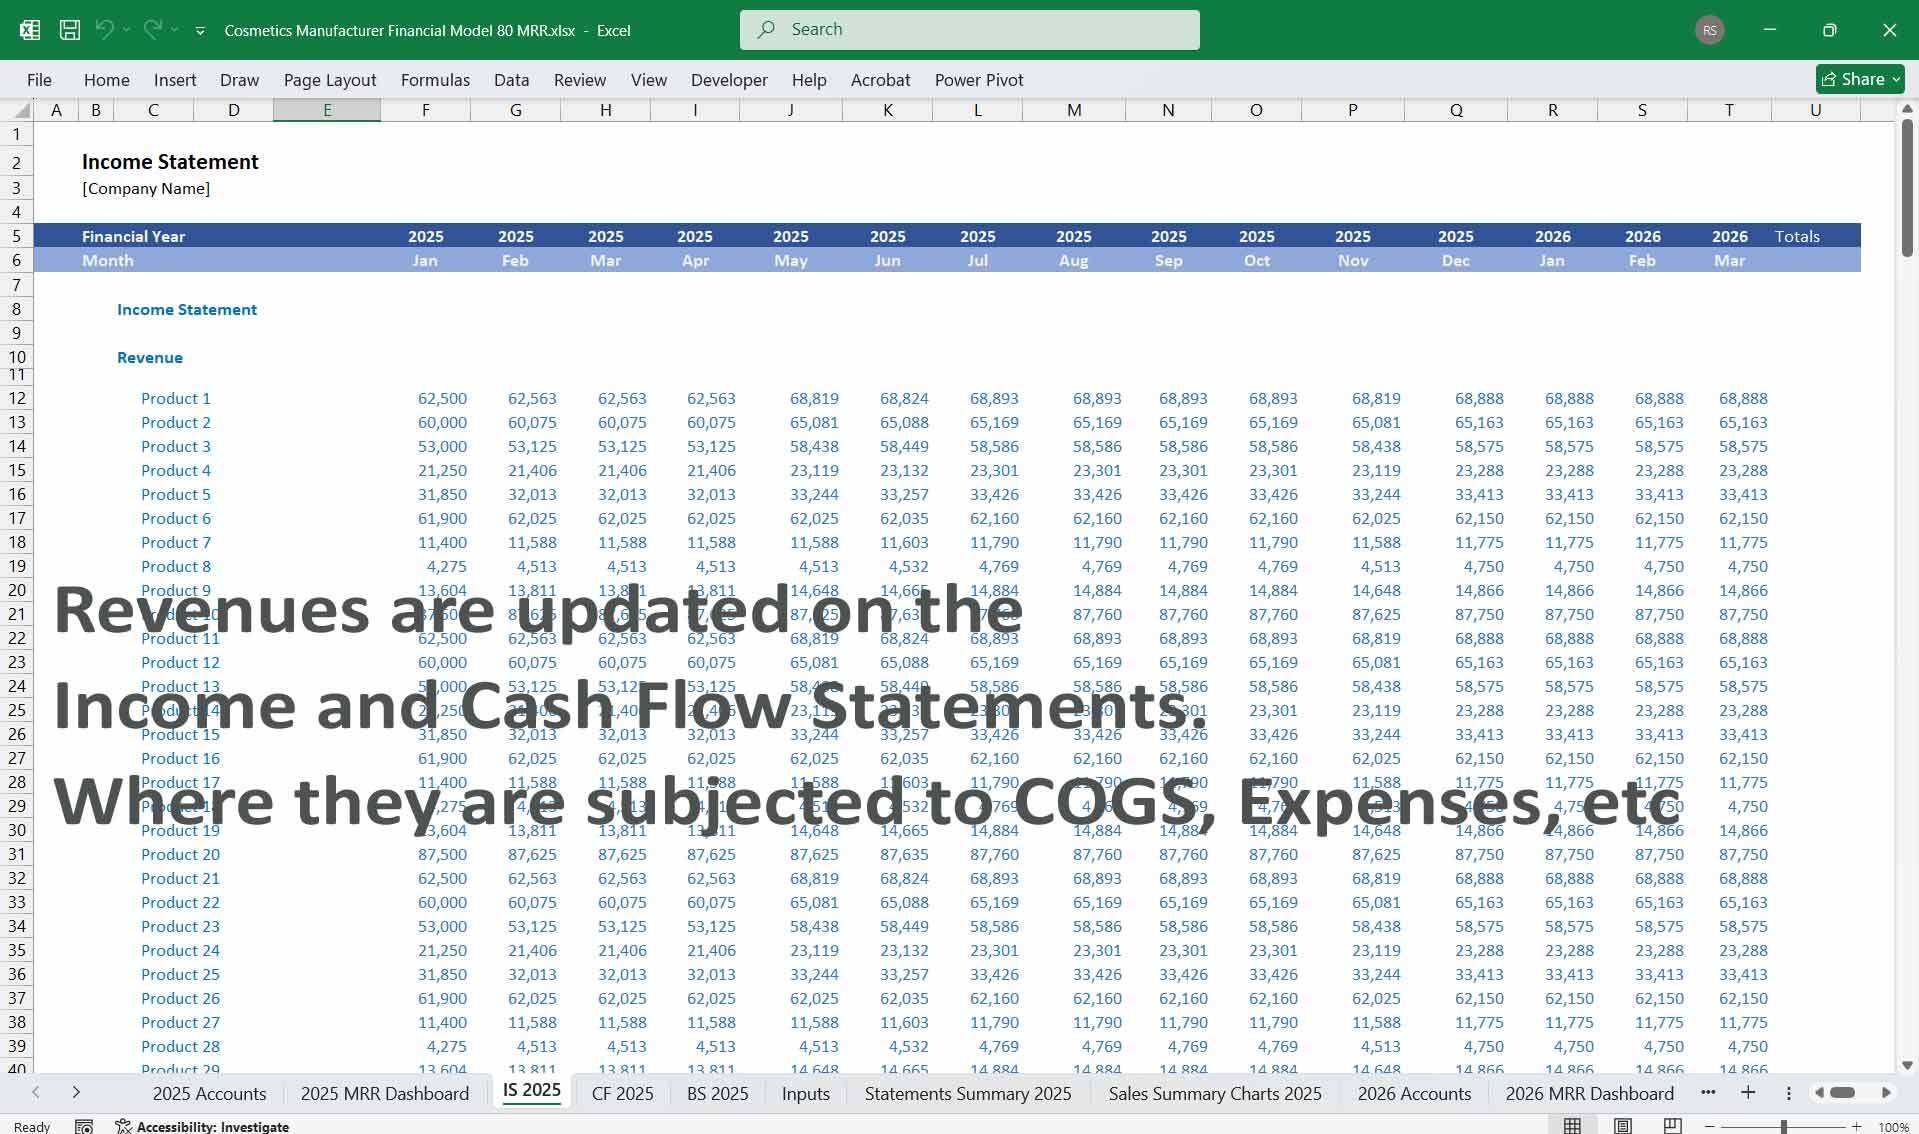
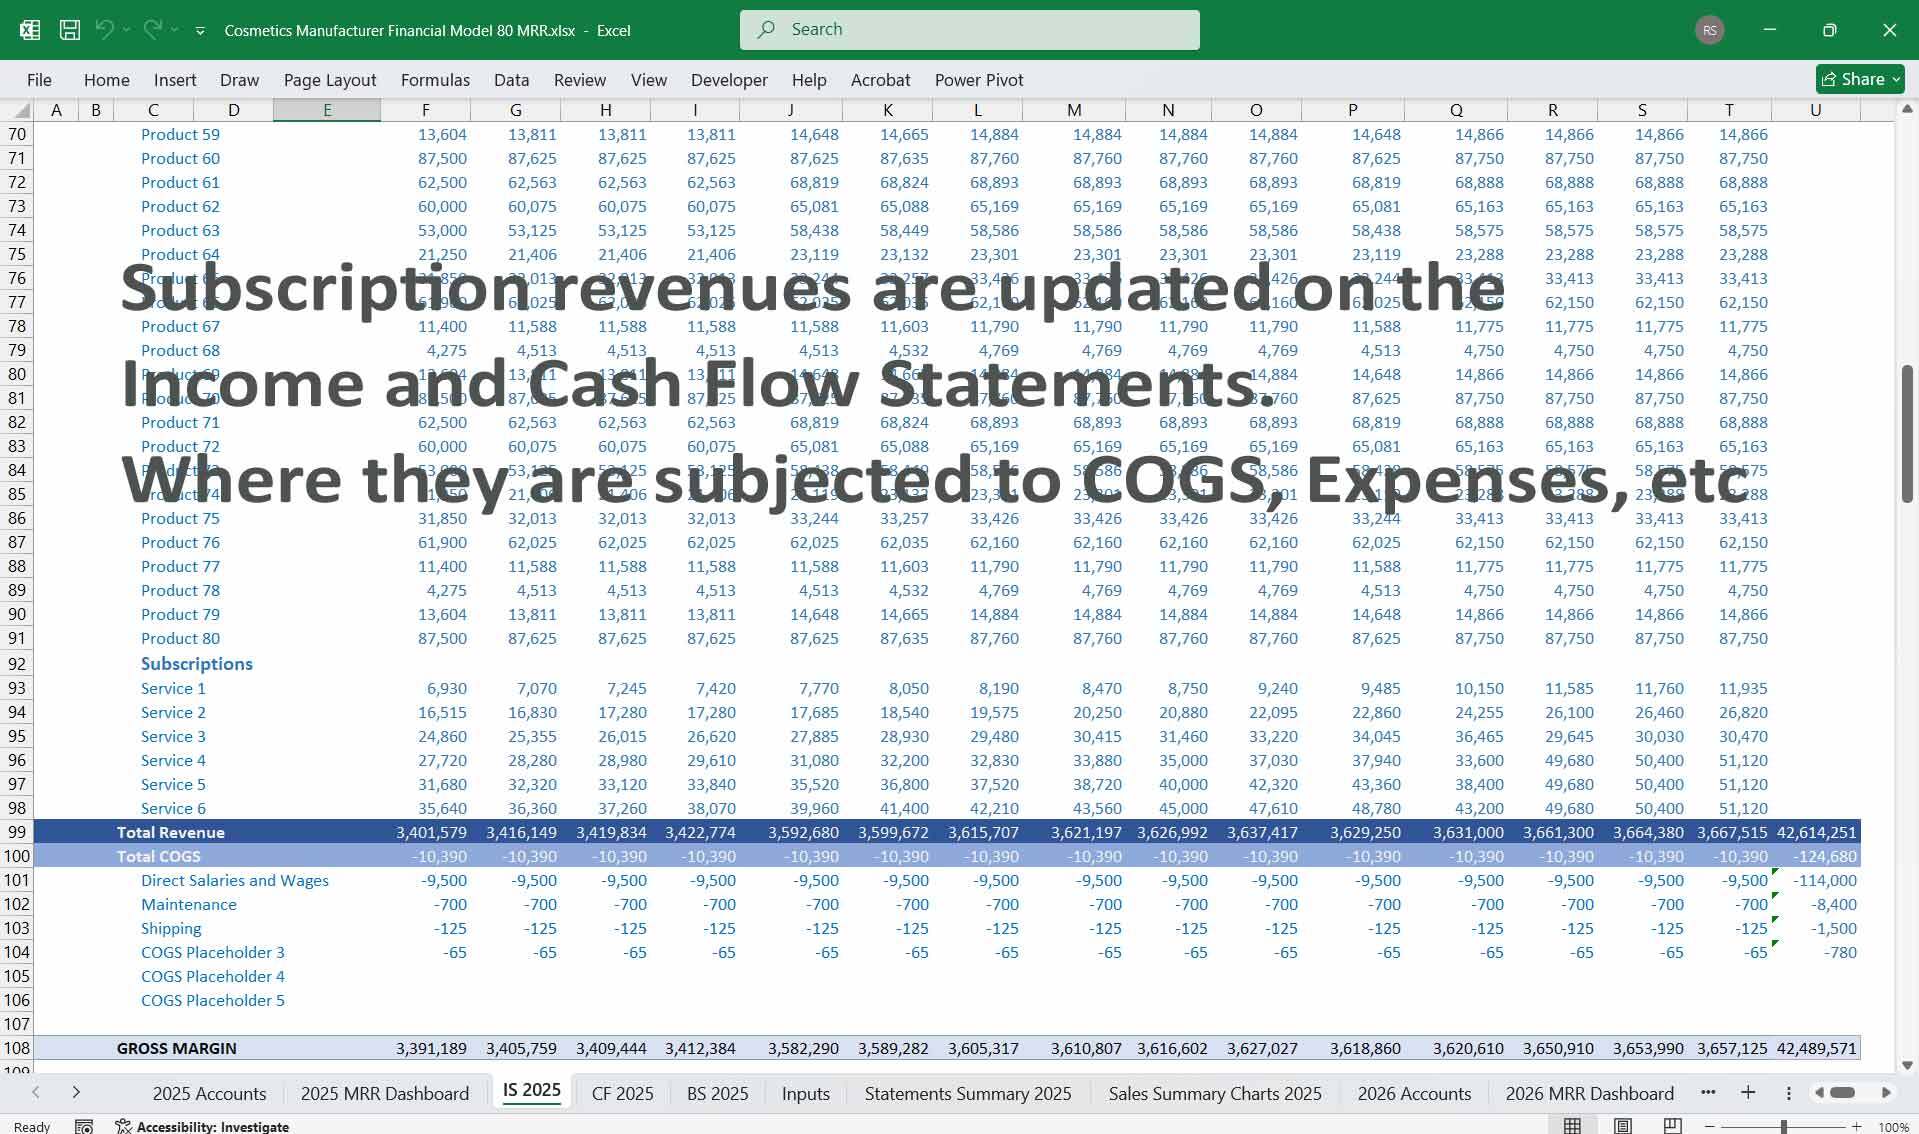
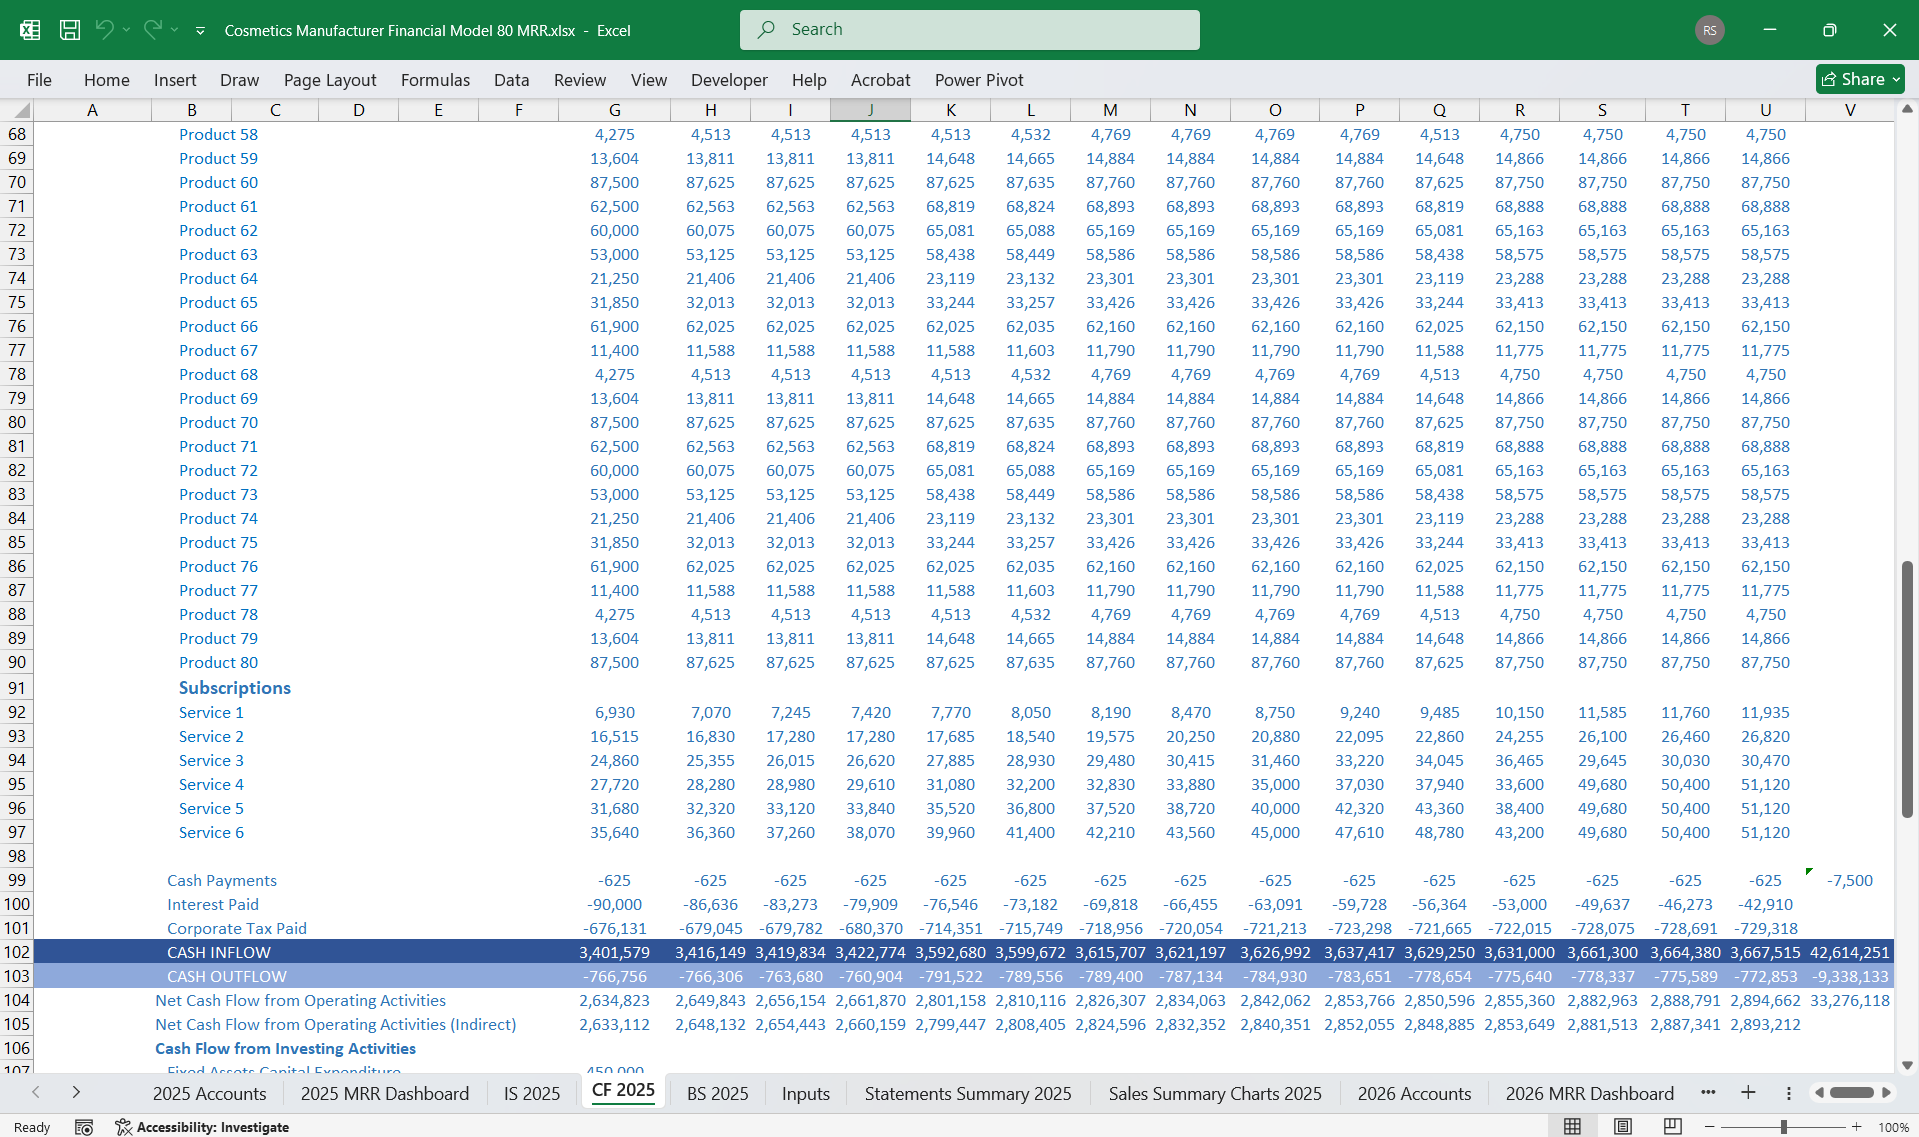
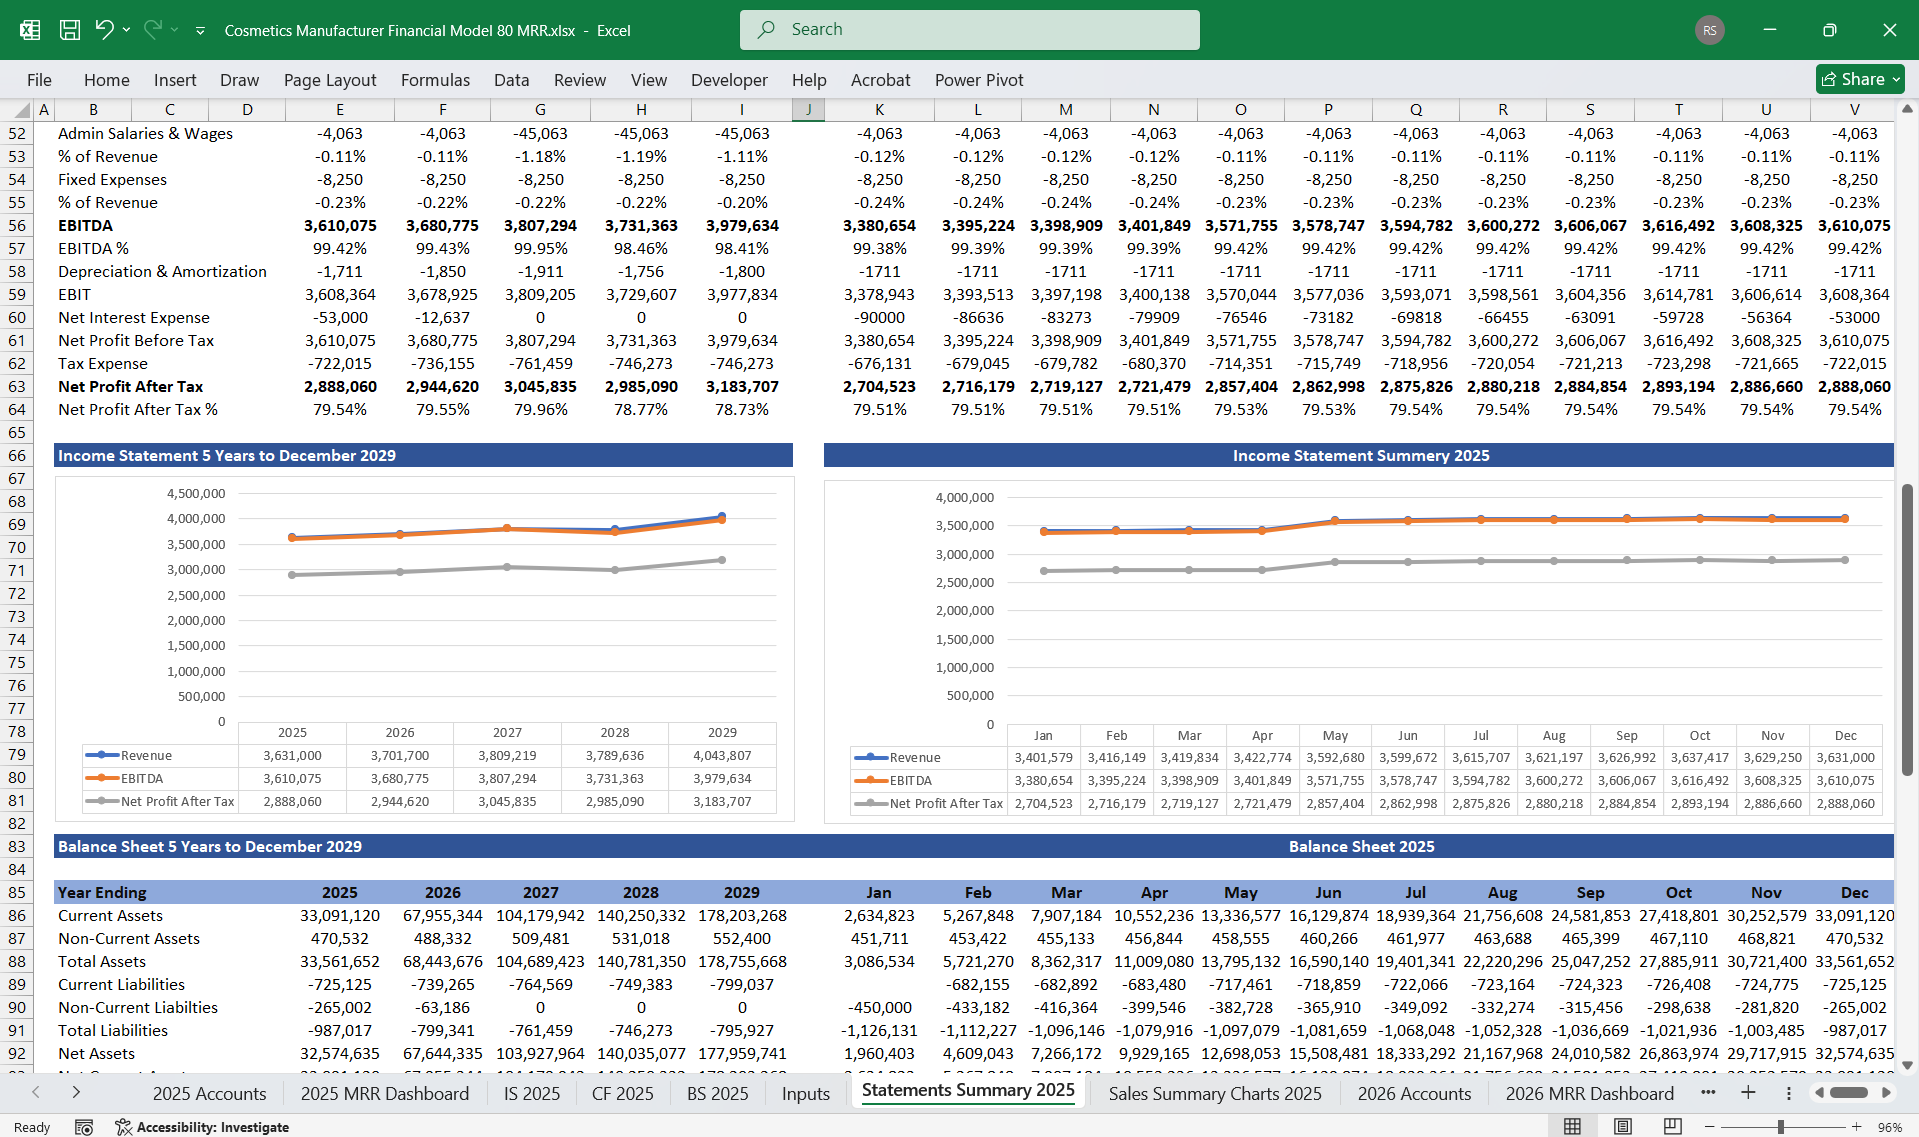
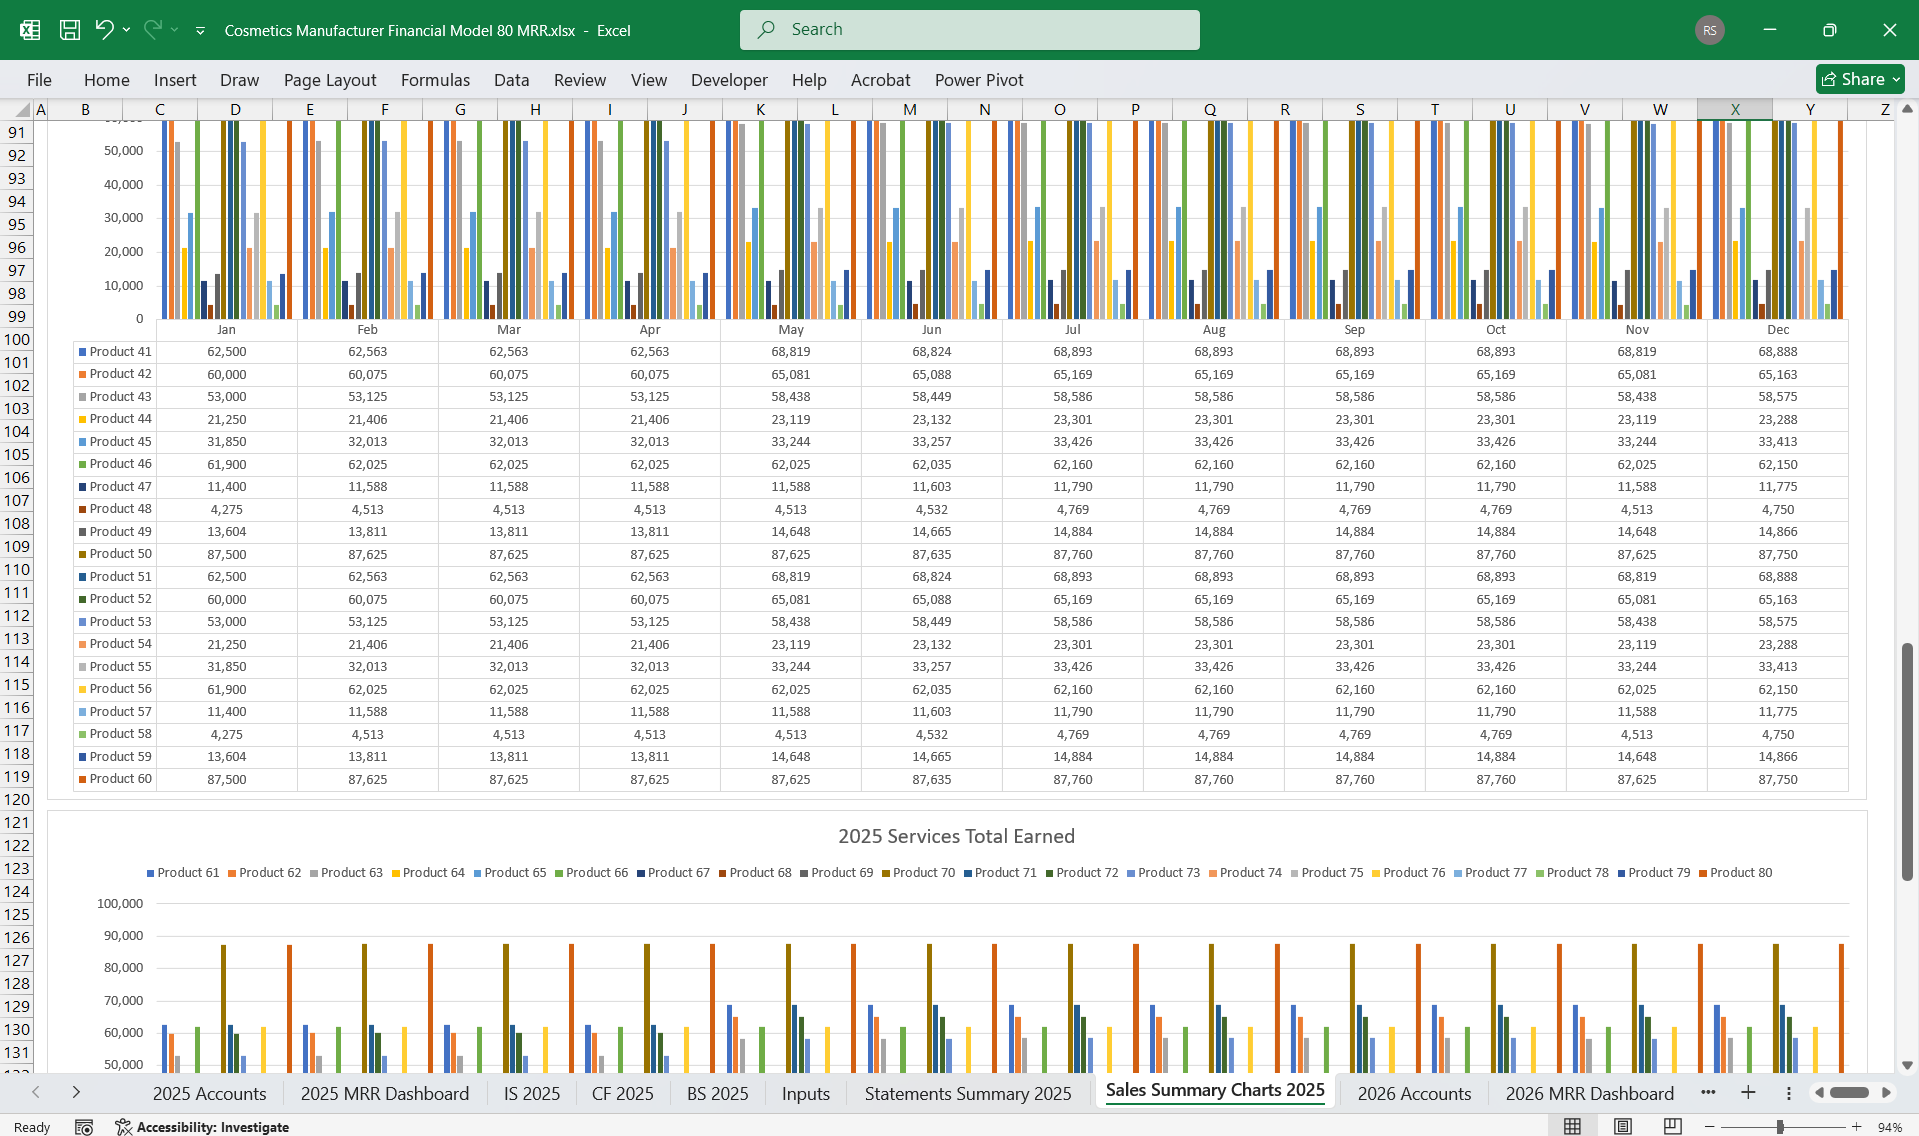
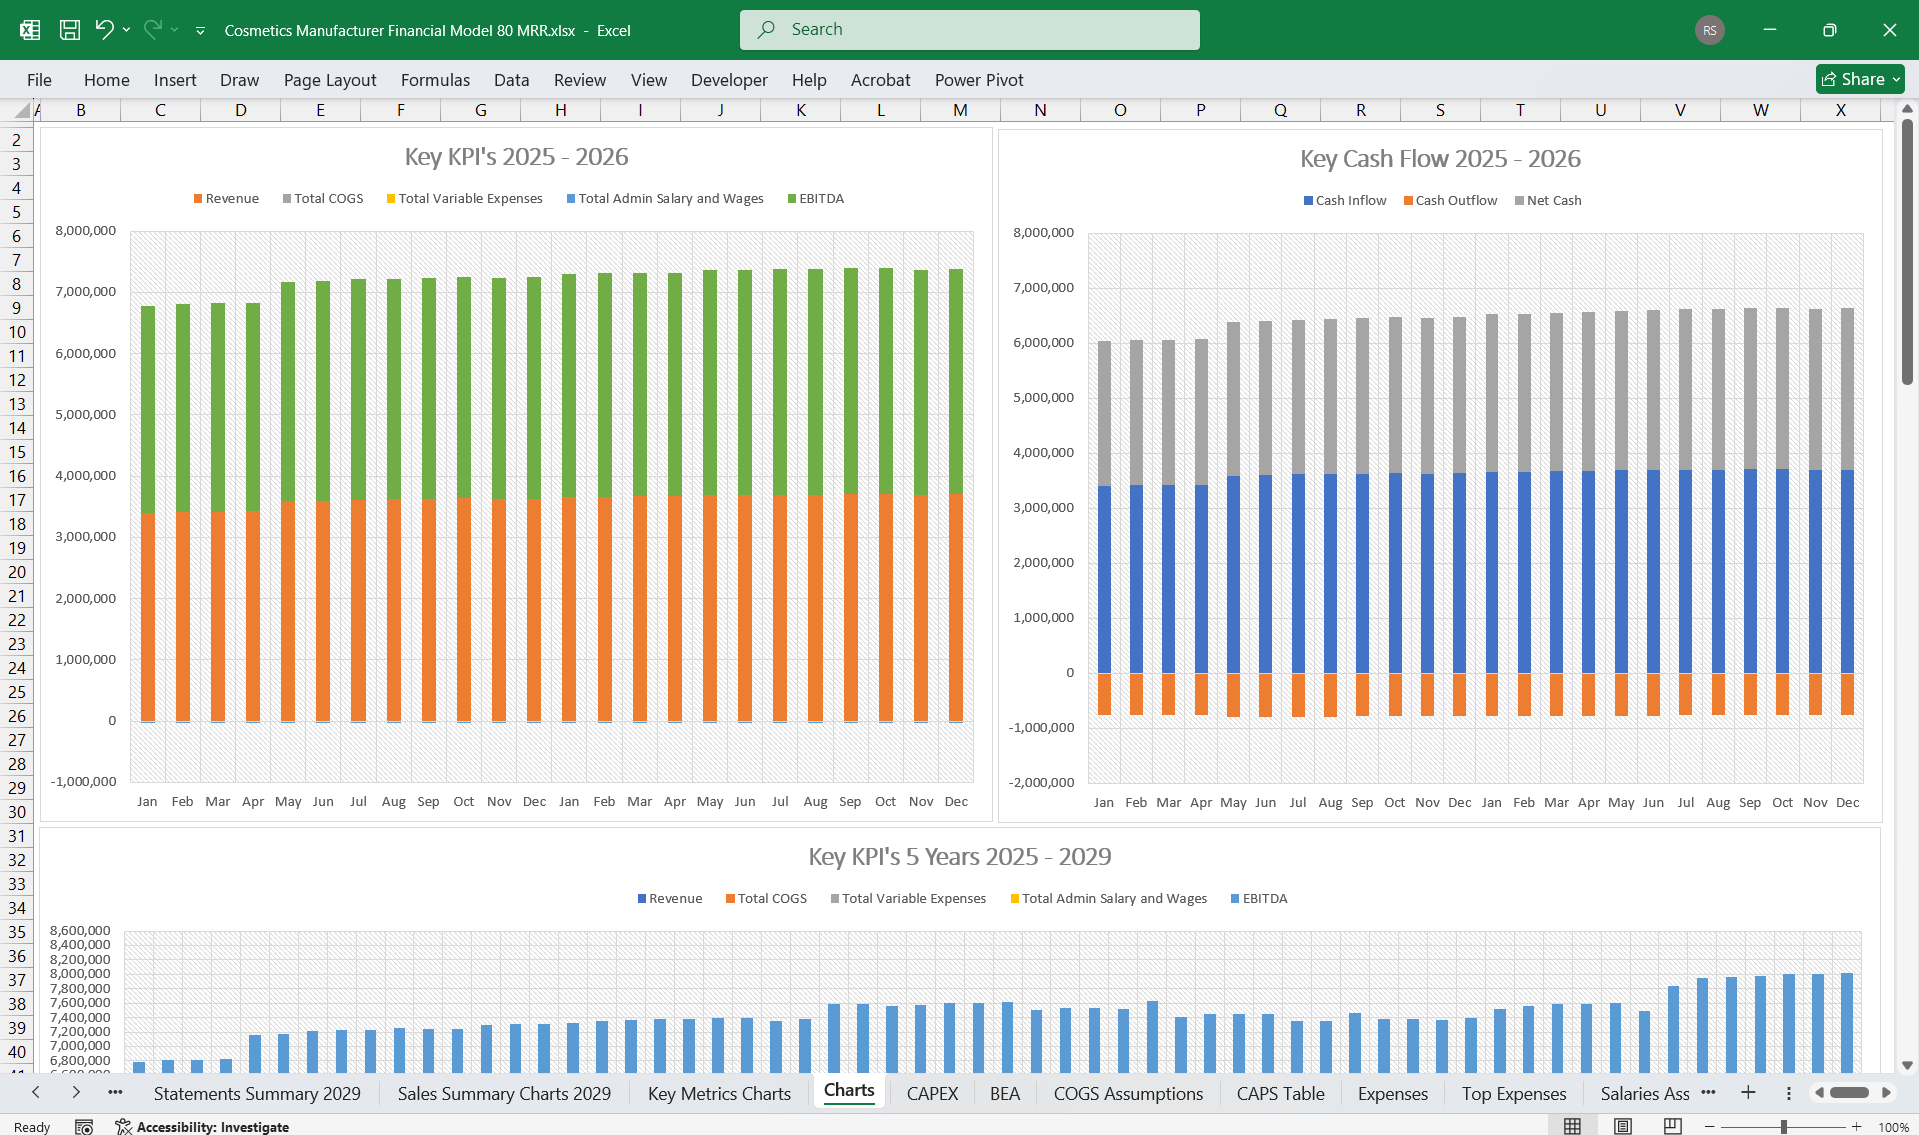
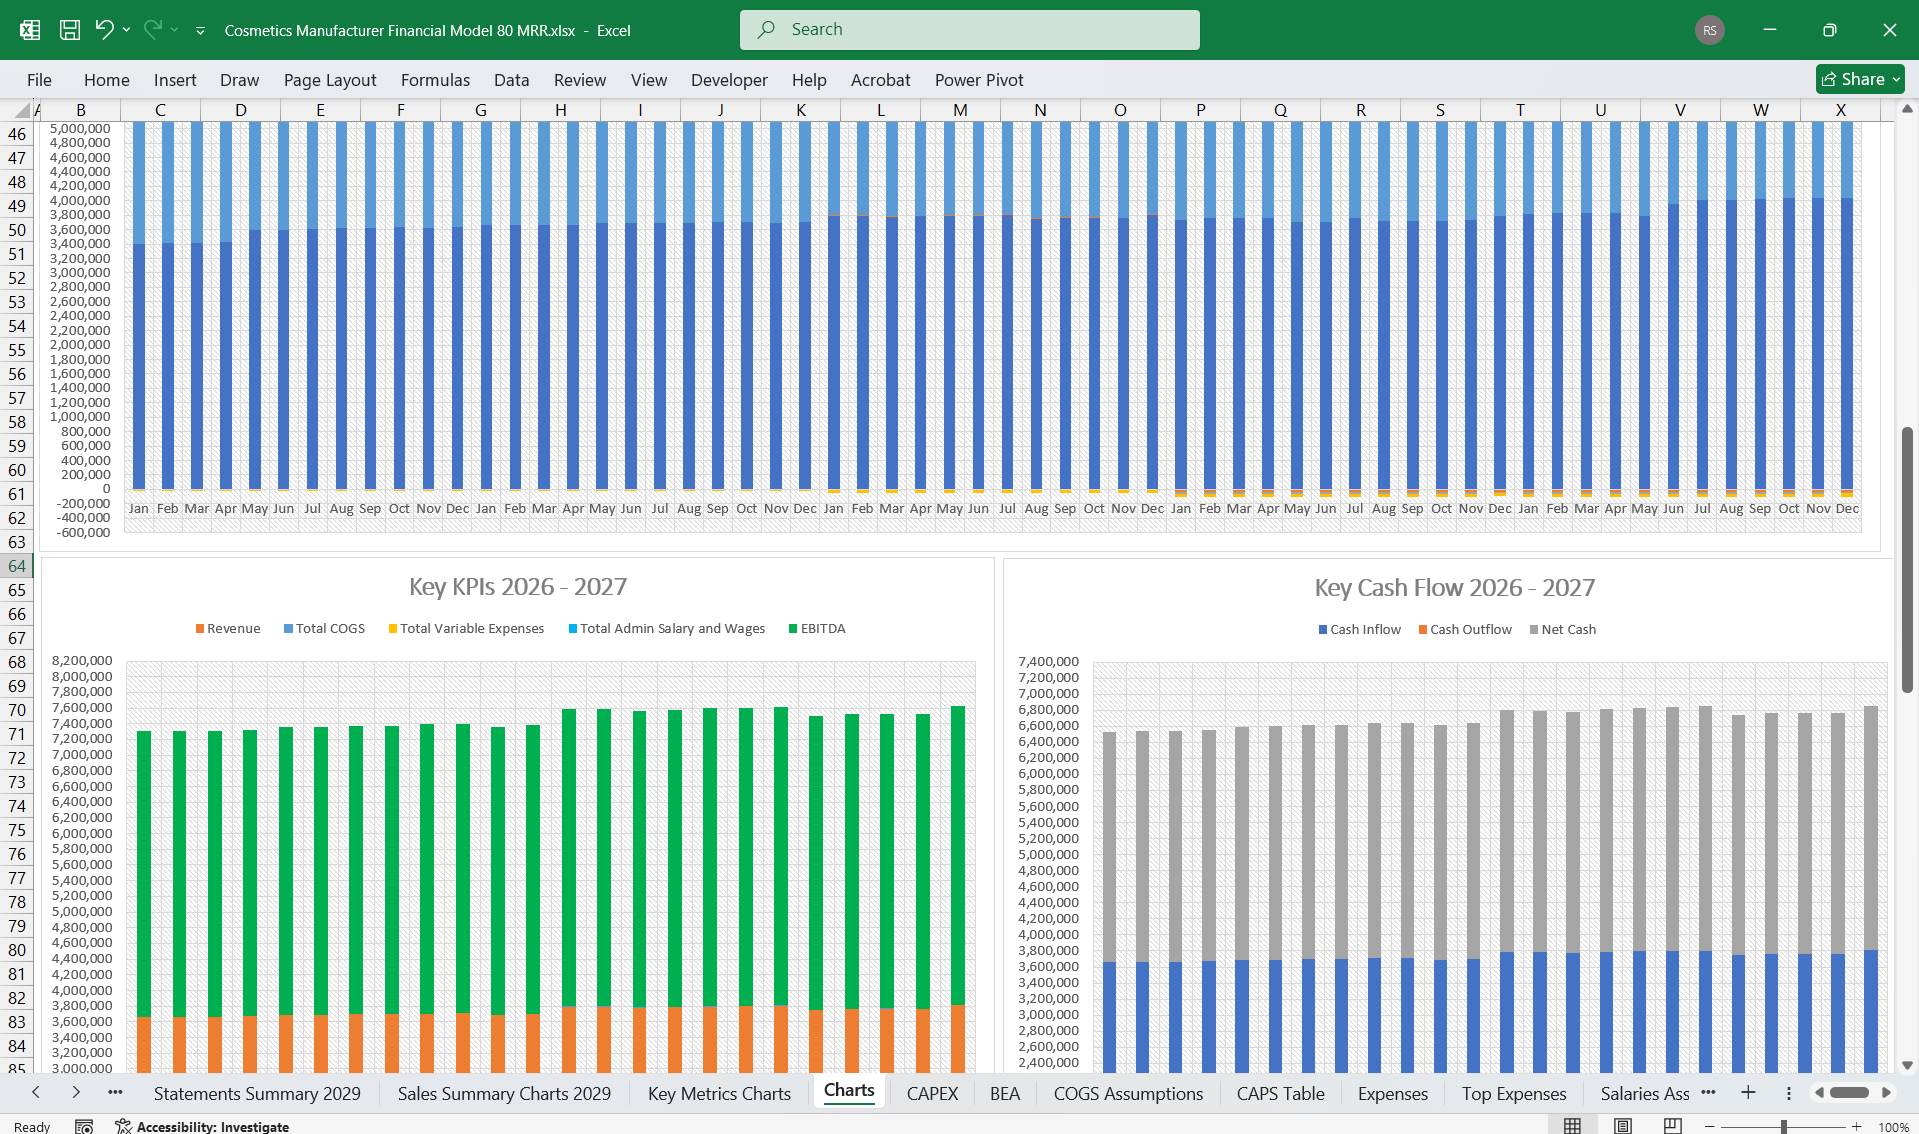
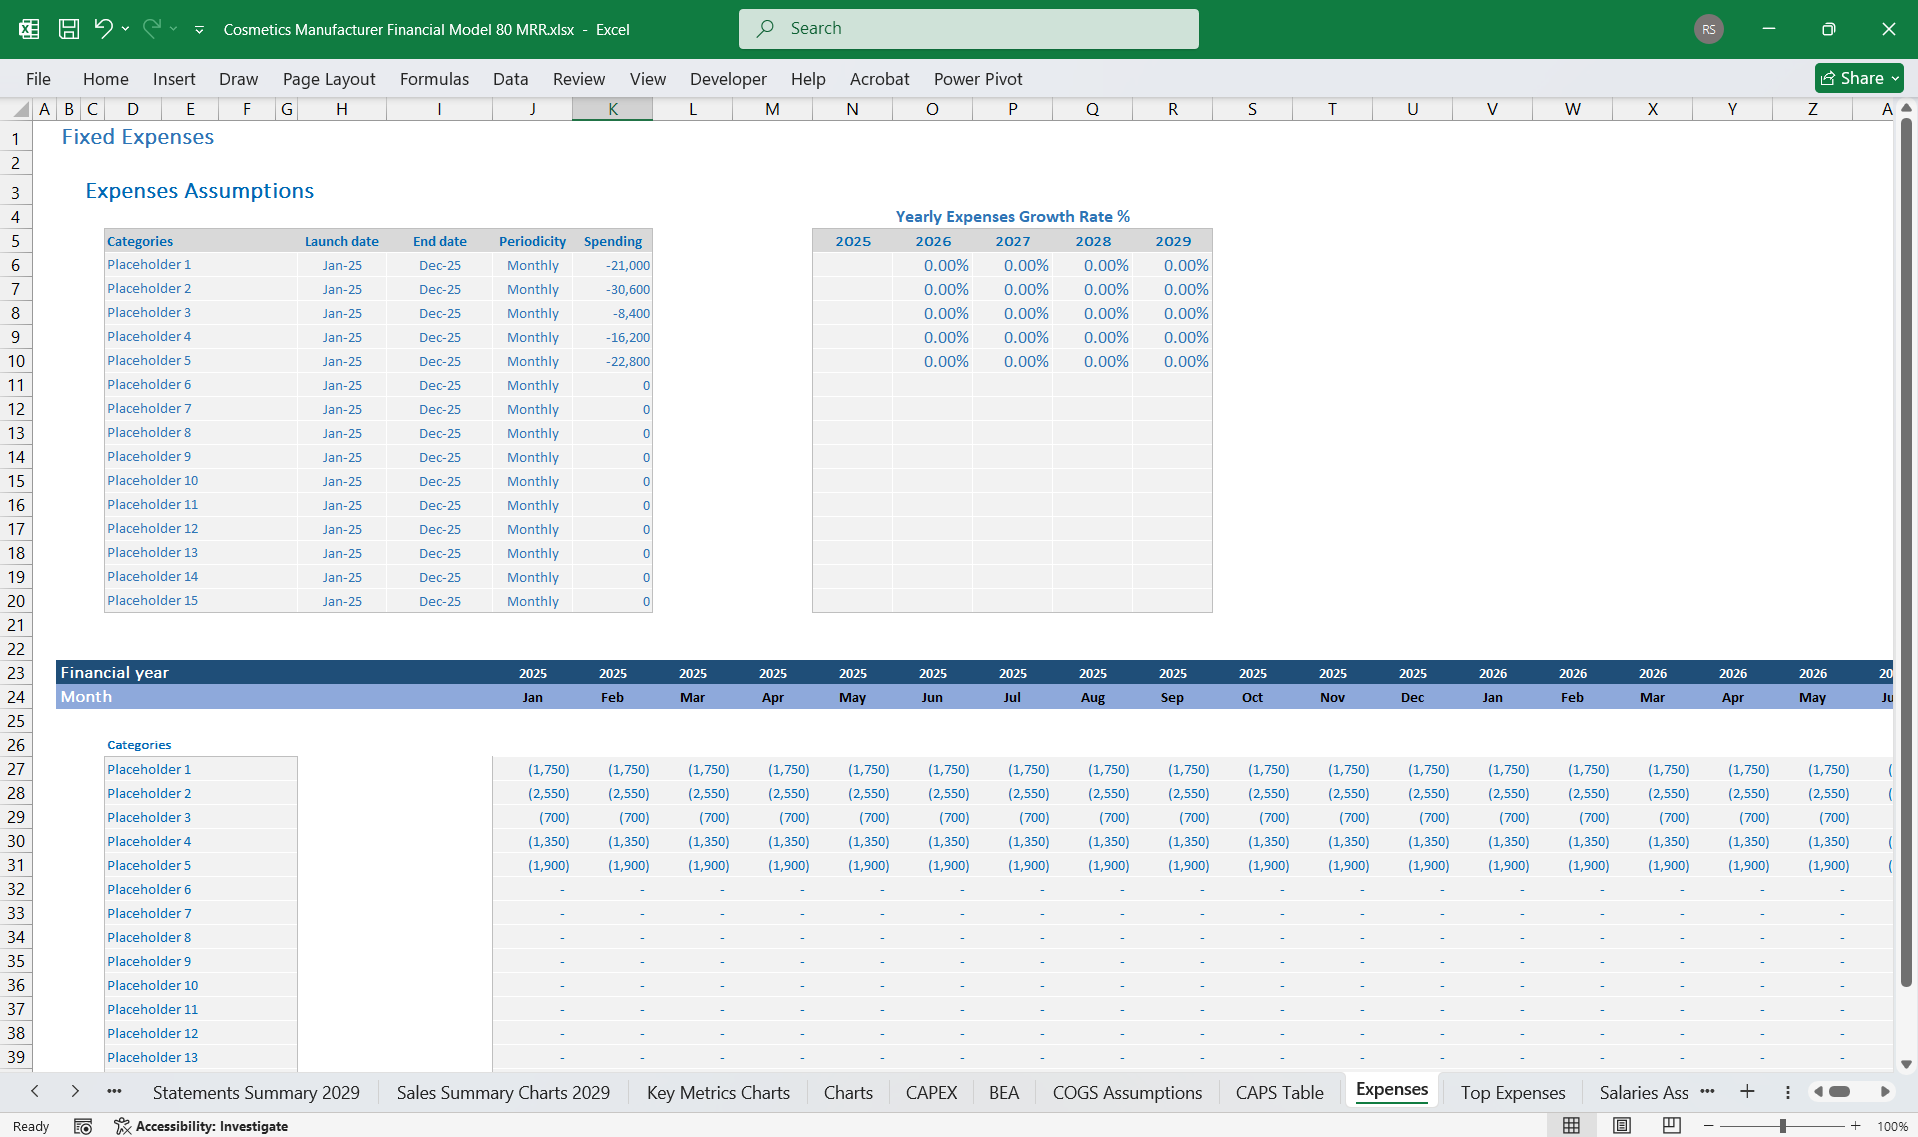
Financial Model for a Cosmetics ManufacturerThis financial model is designed to provide insights into the financial dynamics of a Cosmetics Manufacturer, covering key aspects such as revenue streams, operational efficiency, and profitability. These models include an Income Statement, Cash Flow Statement, and Balance Sheet. They feature detailed sections for managing 80 product lines and incorporates a 6-Tier Subscription Model Add-on to leverage recurring revenue streams.
1. Income StatementRevenue Streams
Tier Structure
Financial Model for a Cosmetics ManufacturerThis financial model is designed to provide insights into the financial dynamics of a Cosmetics Manufacturer, covering key aspects such as revenue streams, operational efficiency, and profitability. These models include an Income Statement, Cash Flow Statement, and Balance Sheet. They feature detailed sections for managing 80 product lines and incorporates a 6-Tier Subscription Model Add-on to leverage recurring revenue streams.
1. Income StatementRevenue Streams
- Product Sales:
- Core Products: Everyday-use items like lipsticks, foundations, skincare serums, and shampoos.
- Premium Lines: High-end or niche items such as anti-aging serums, organic cosmetics, or designer-branded products.
- Seasonal Collections: Limited-edition lines to align with holidays or fashion trends.
- Private Labeling:
- Producing cosmetics for retailers under their brand name.
- B2B Sales:
- Selling to beauty salons, spas, and retail chains.
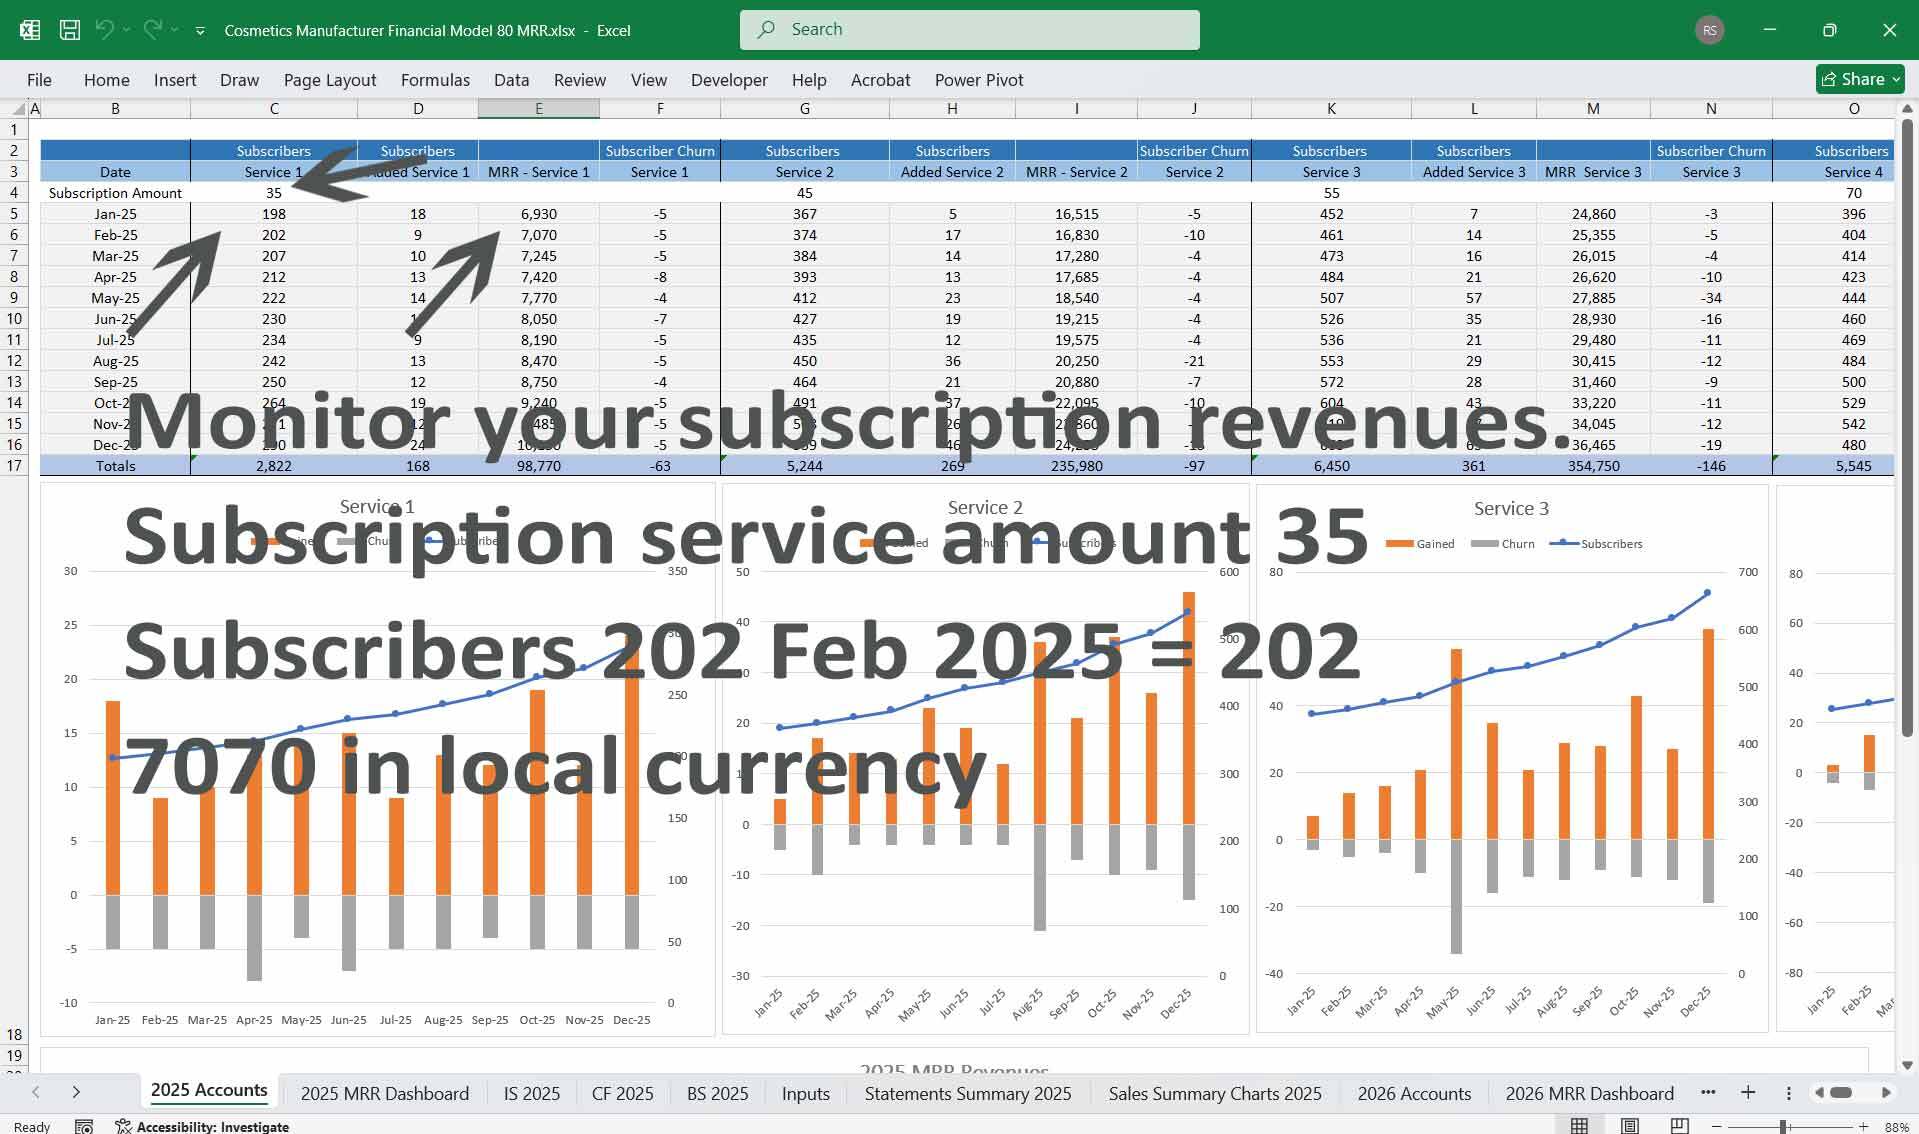
- Subscription Model:
- Direct-to-consumer subscriptions offering curated product bundles (see Section 5).
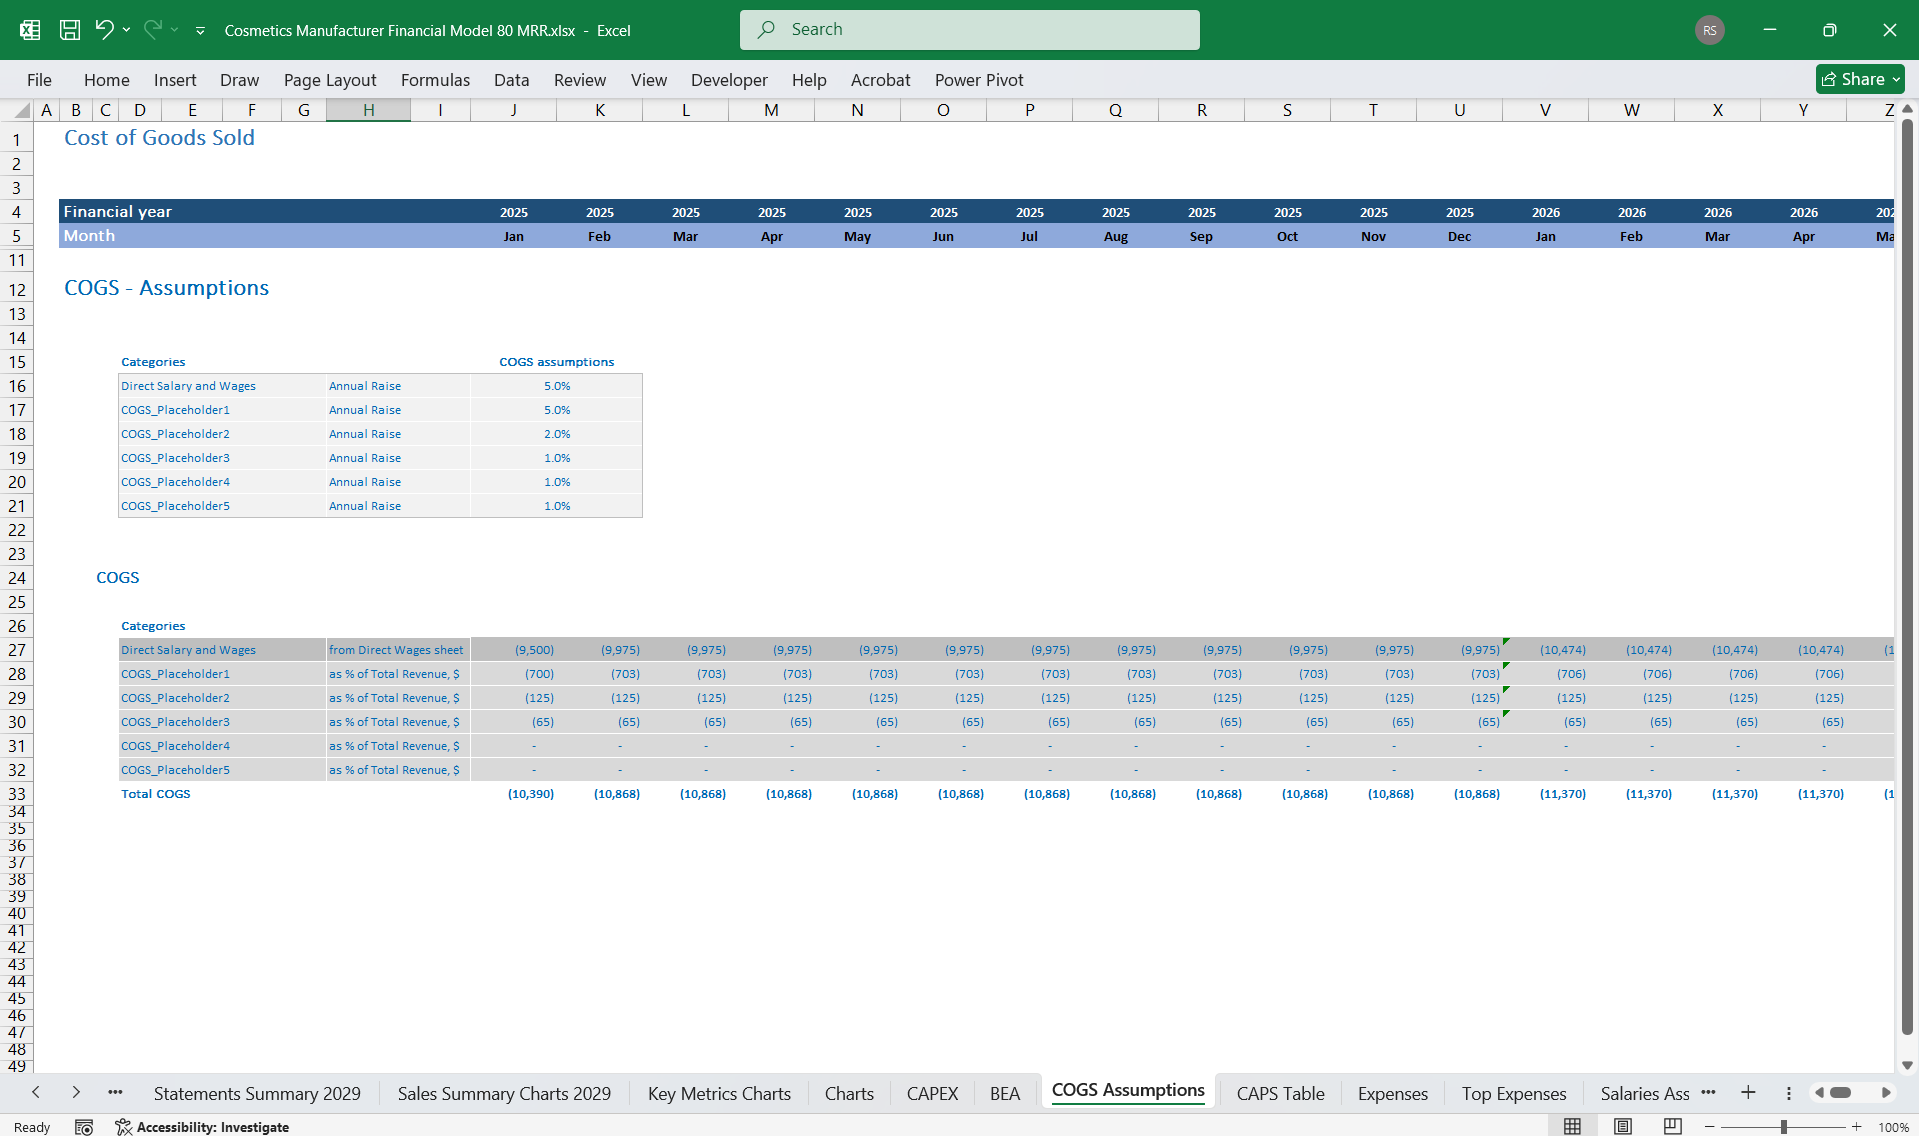
- Cost of Goods Sold (COGS):
- Raw Materials: Natural and synthetic ingredients like shea butter, retinol, and color pigments.
- Packaging: Eco-friendly containers, labels, and gift boxes.
- Labor: Assembly line workers, quality inspectors, and R&D staff.
- Overheads: Equipment maintenance, utilities, and manufacturing supplies.
- Operating Expenses:
- Sales and Marketing: Ads, influencer partnerships, and product launches.
- R&D: Development of new formulas, testing, and compliance.
- Administrative: Employee salaries, software subscriptions, and office rent.
- Other Costs:
- Legal and certification expenses, particularly for FDA approval or organic labeling.
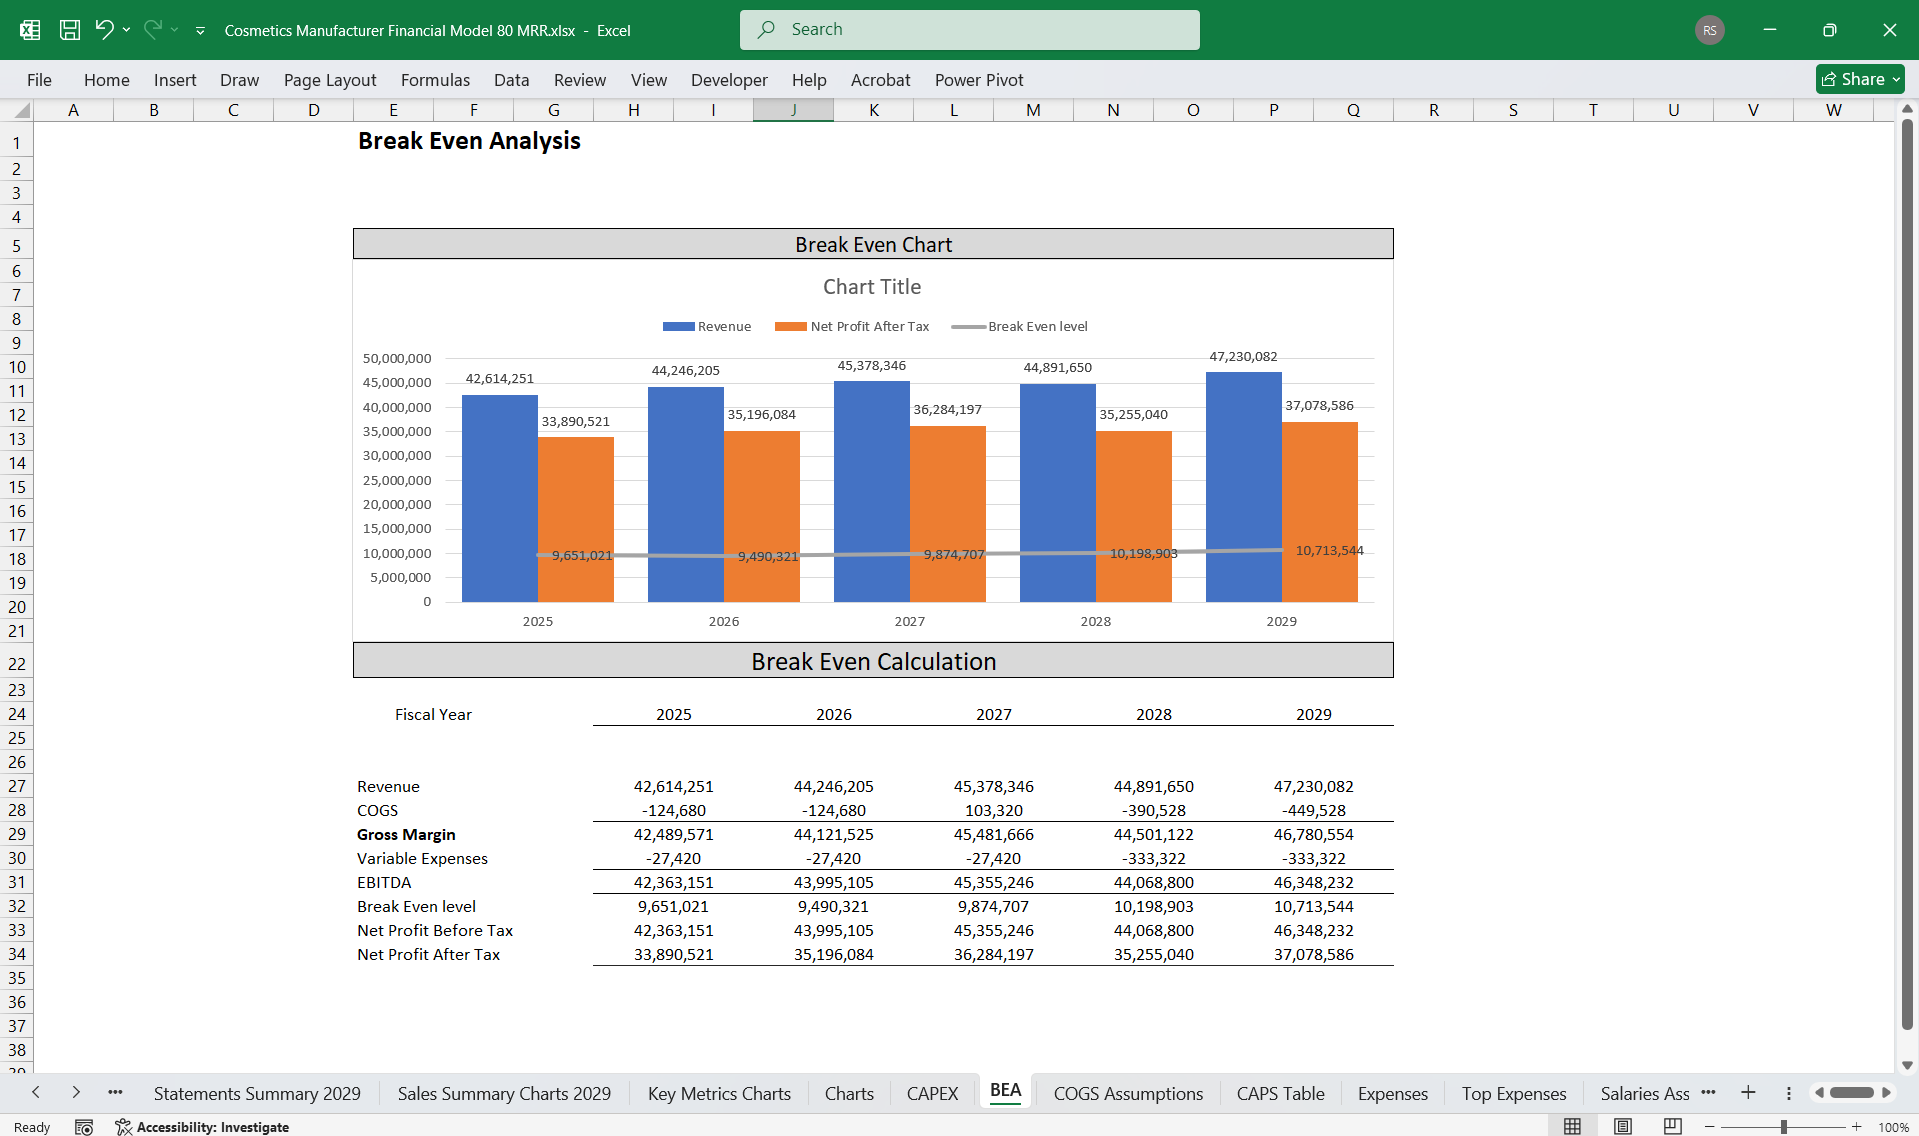
- Gross Profit = Revenue - COGS.
- Operating Profit (EBIT) = Gross Profit - Operating Expenses.
- Net Income = EBIT - Taxes - Interest.
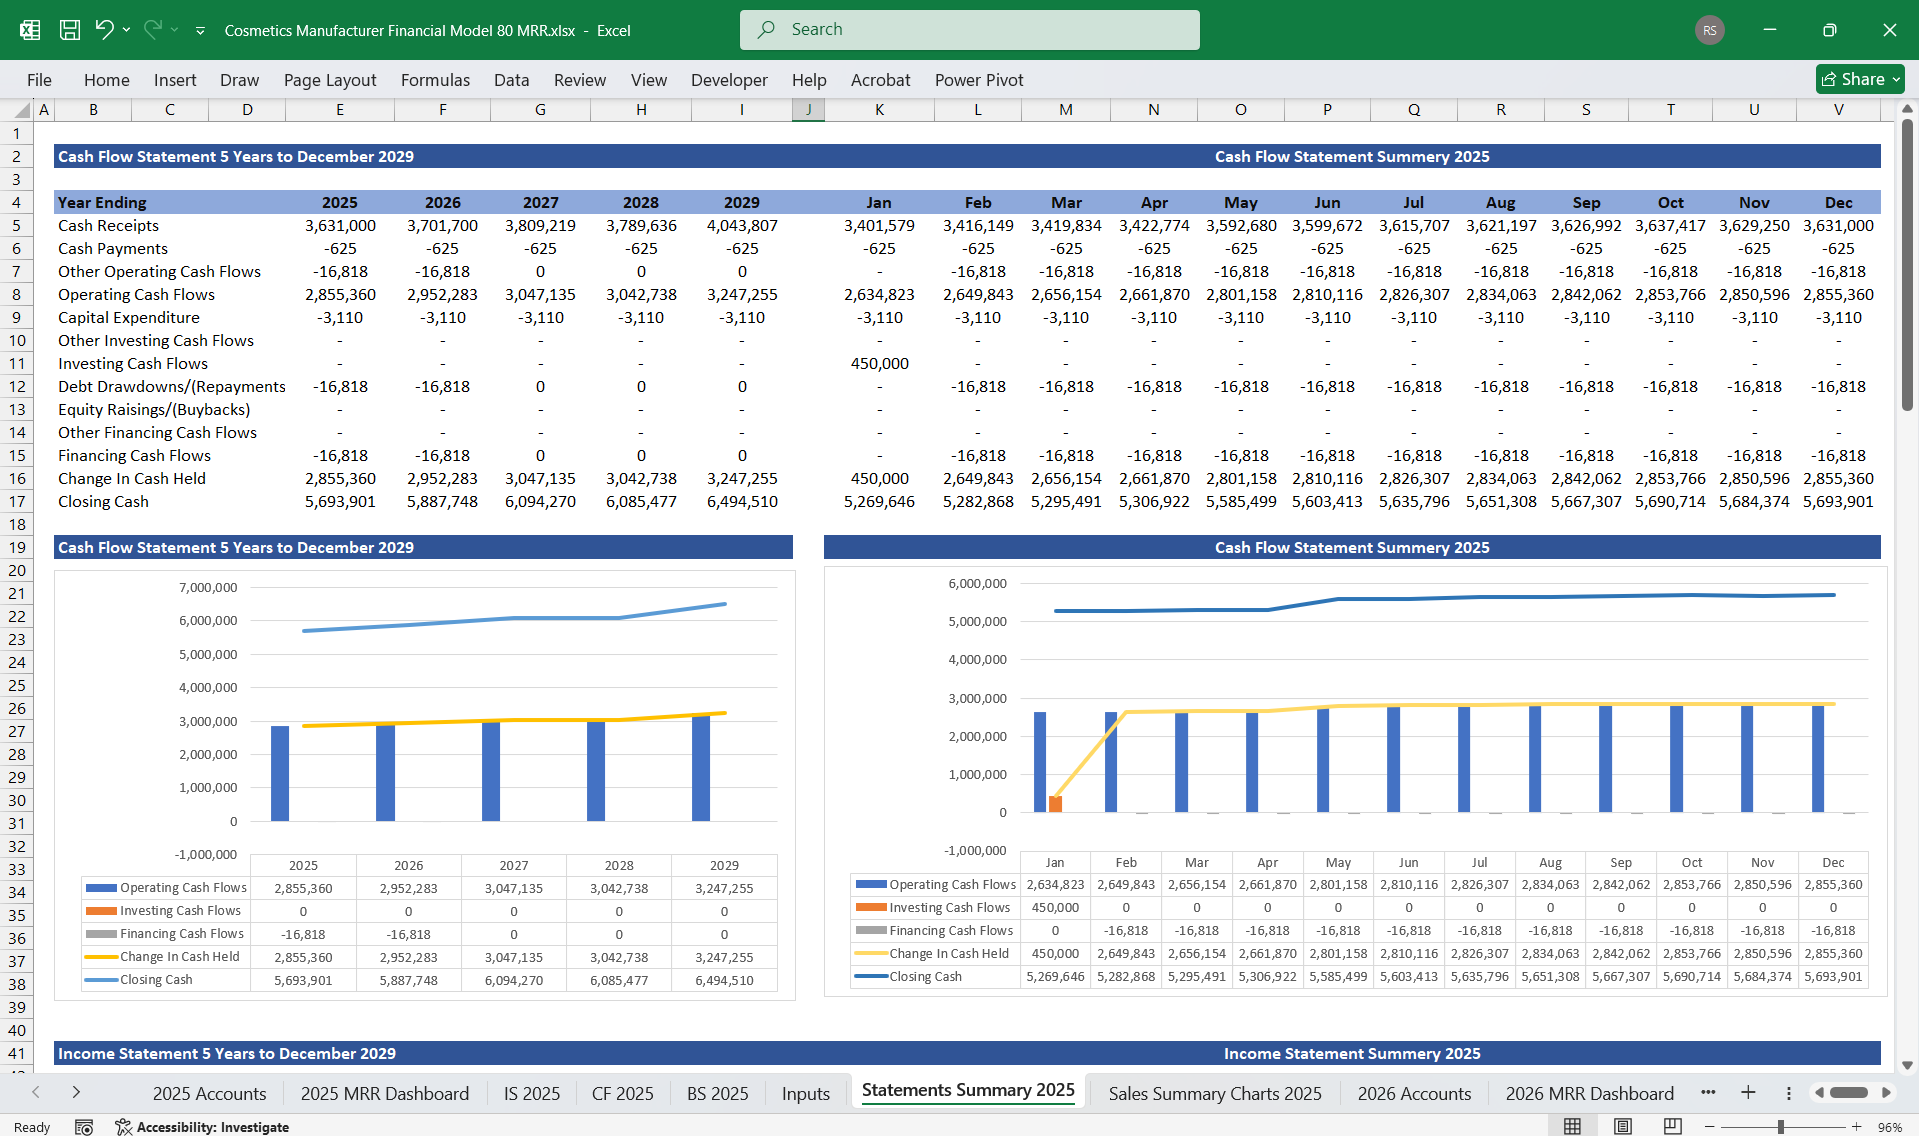
- Inflows:
- Sales revenue from B2B and direct-to-consumer channels.
- Subscription-based payments.
- Outflows:
- Supplier payments for raw materials.
- Wages and marketing campaign budgets.
- Utility bills for production facilities.
- Inflows:
- Sale of surplus equipment or raw material inventories.
- Government grants for sustainable production practices.
- Outflows:
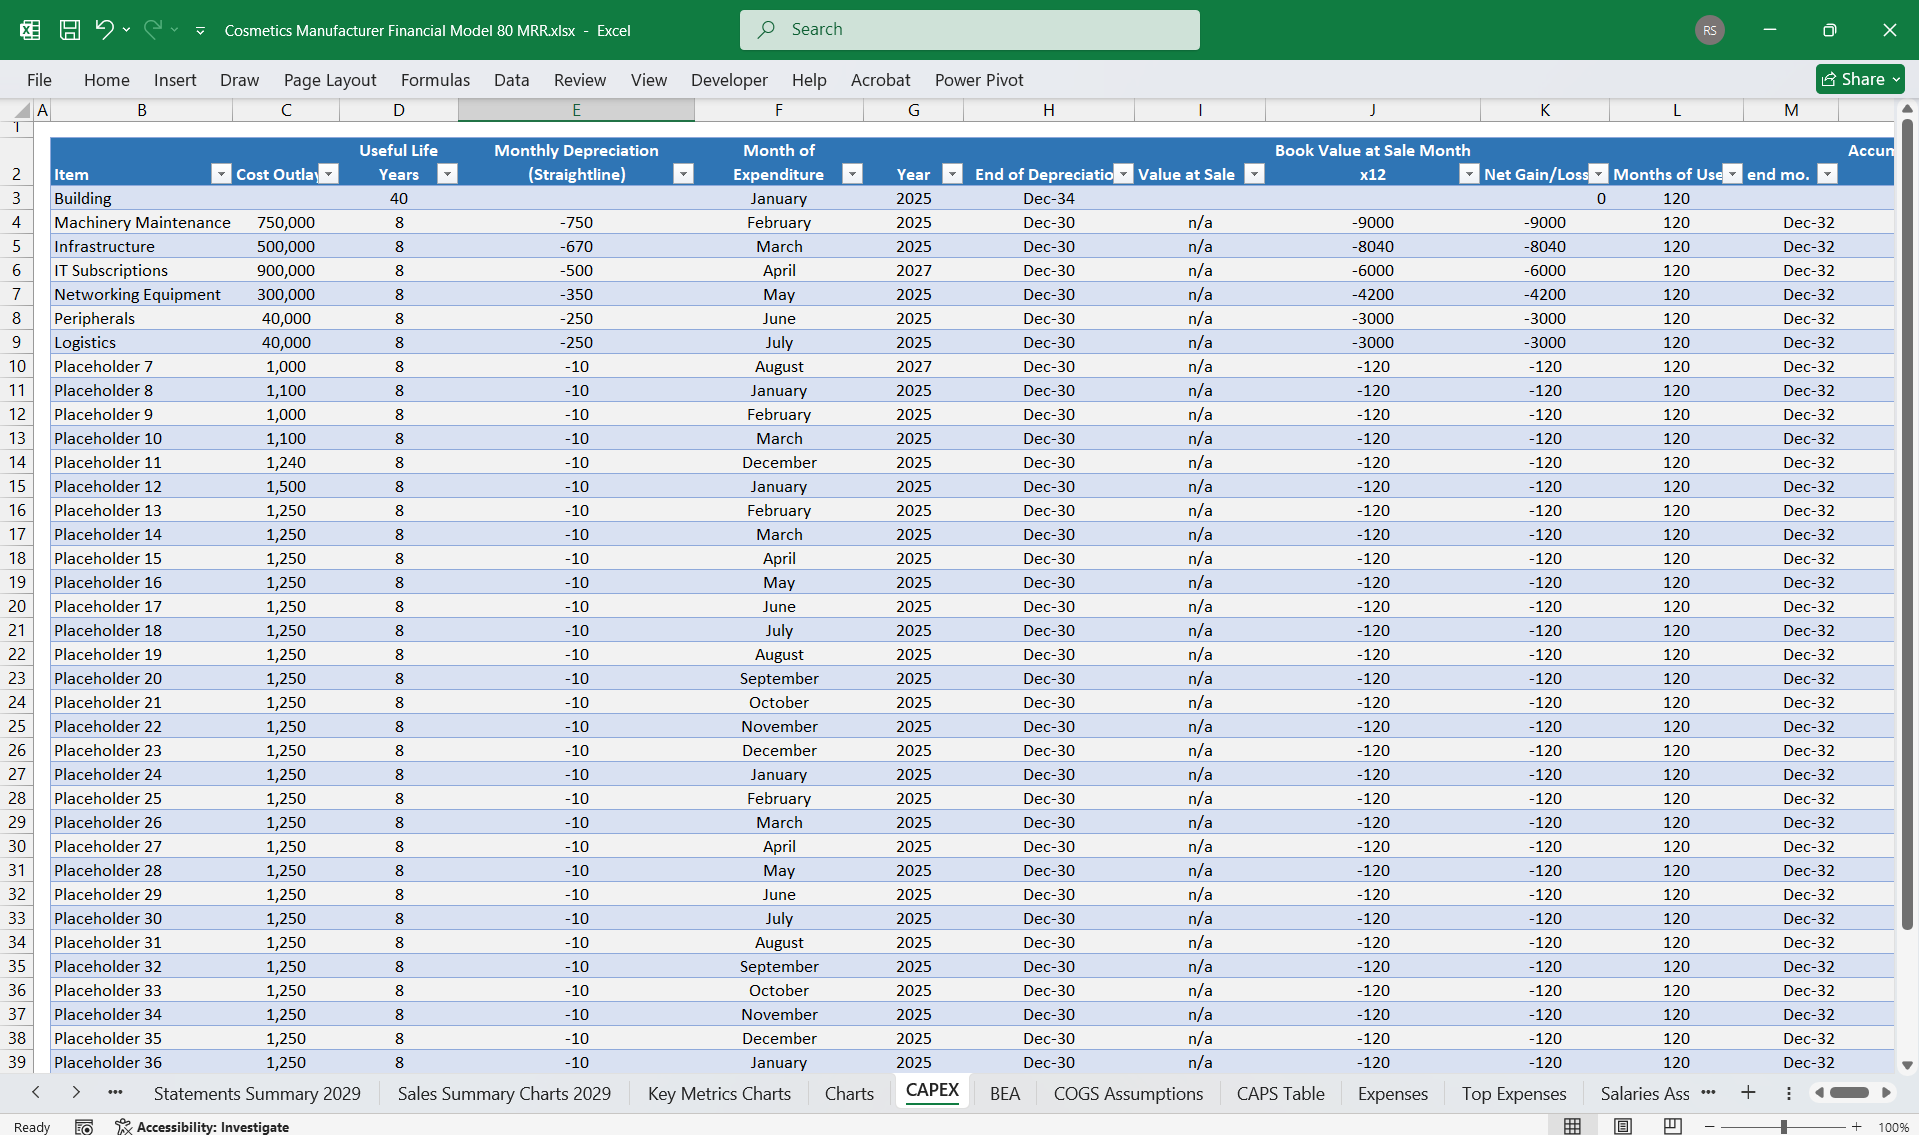
- Investments in advanced machinery, new product lines, or eco-friendly initiatives.
- Inflows:
- Loans for factory upgrades.
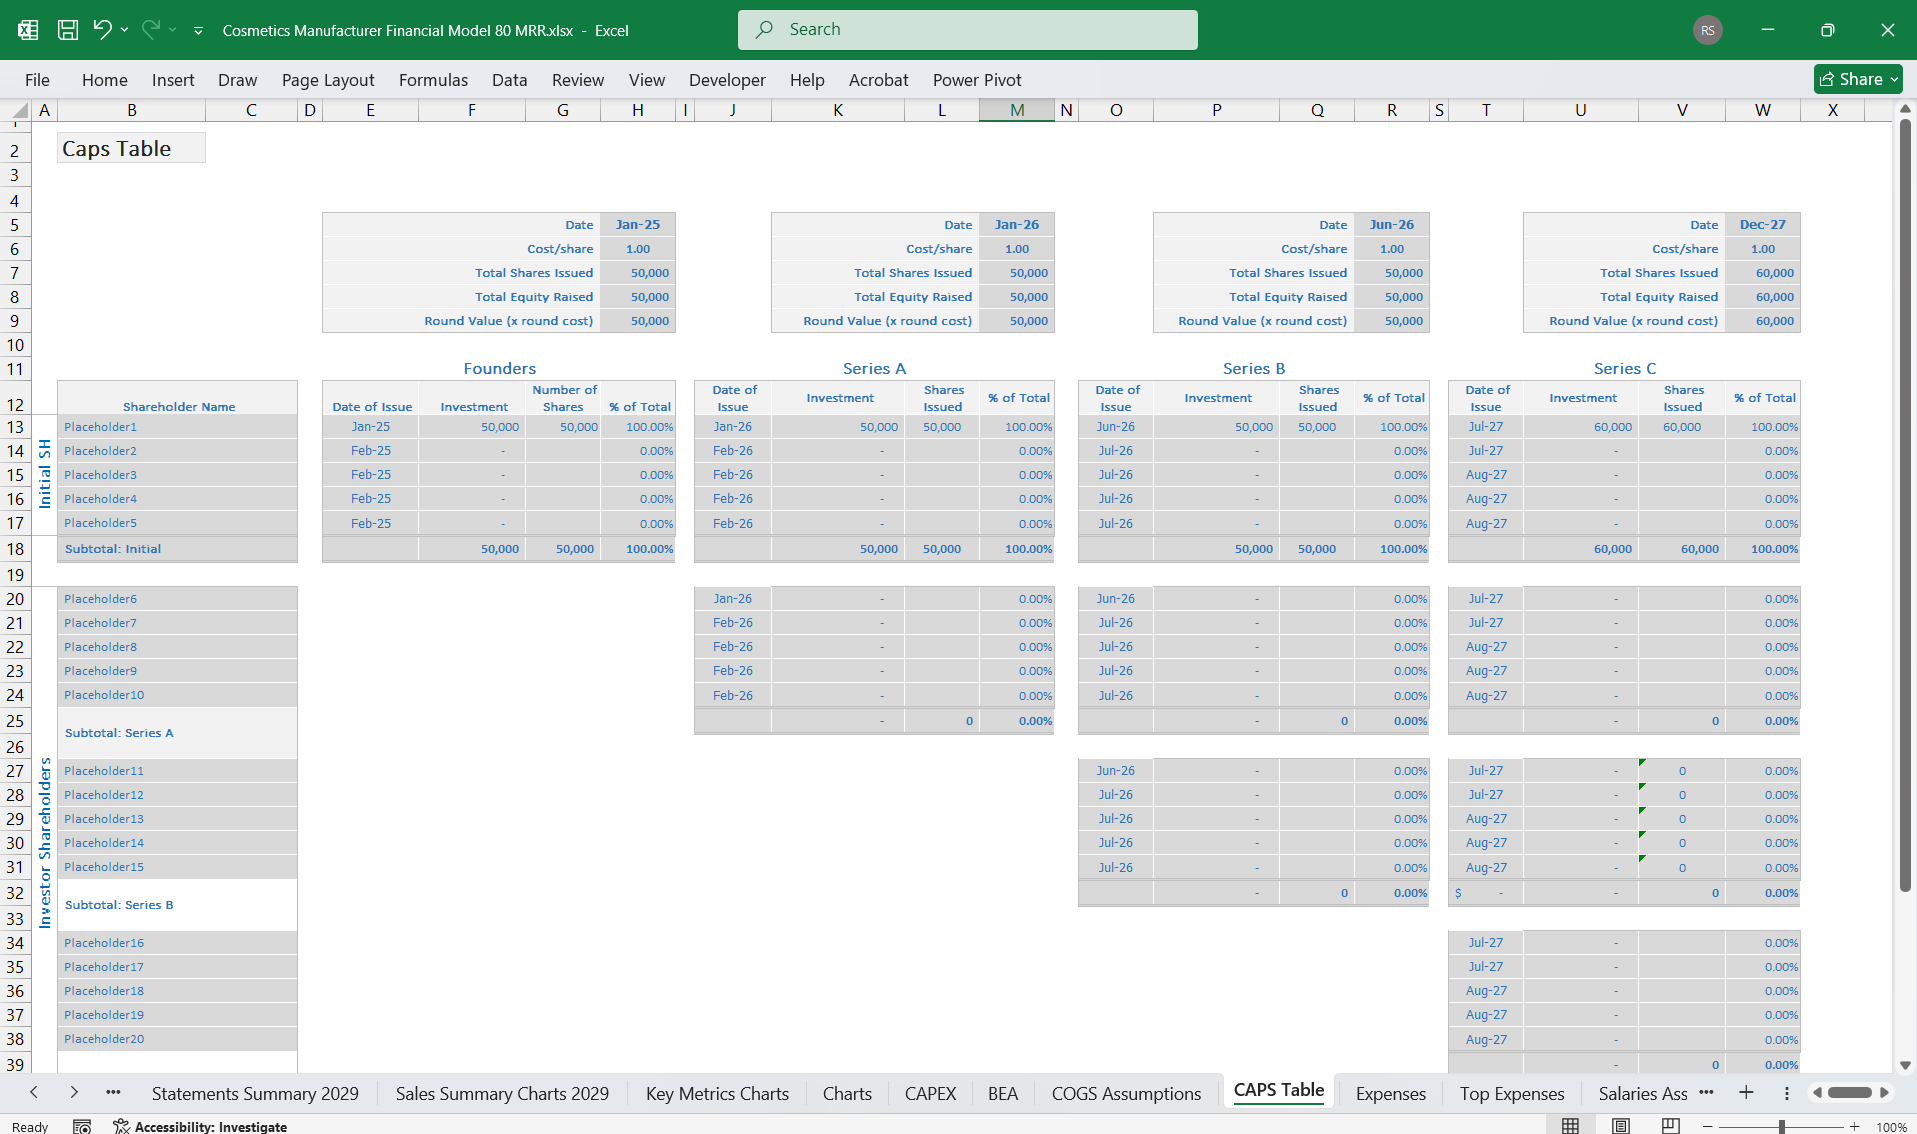
- Equity from investors or venture capital.
- Outflows:
- Debt repayment and interest obligations.
- Dividend payouts to shareholders.
- Free Cash Flow (FCF): Shows cash availability for growth or dividends.
- Cash Conversion Cycle (CCC): Tracks the time to convert investments in inventory into cash from sales.
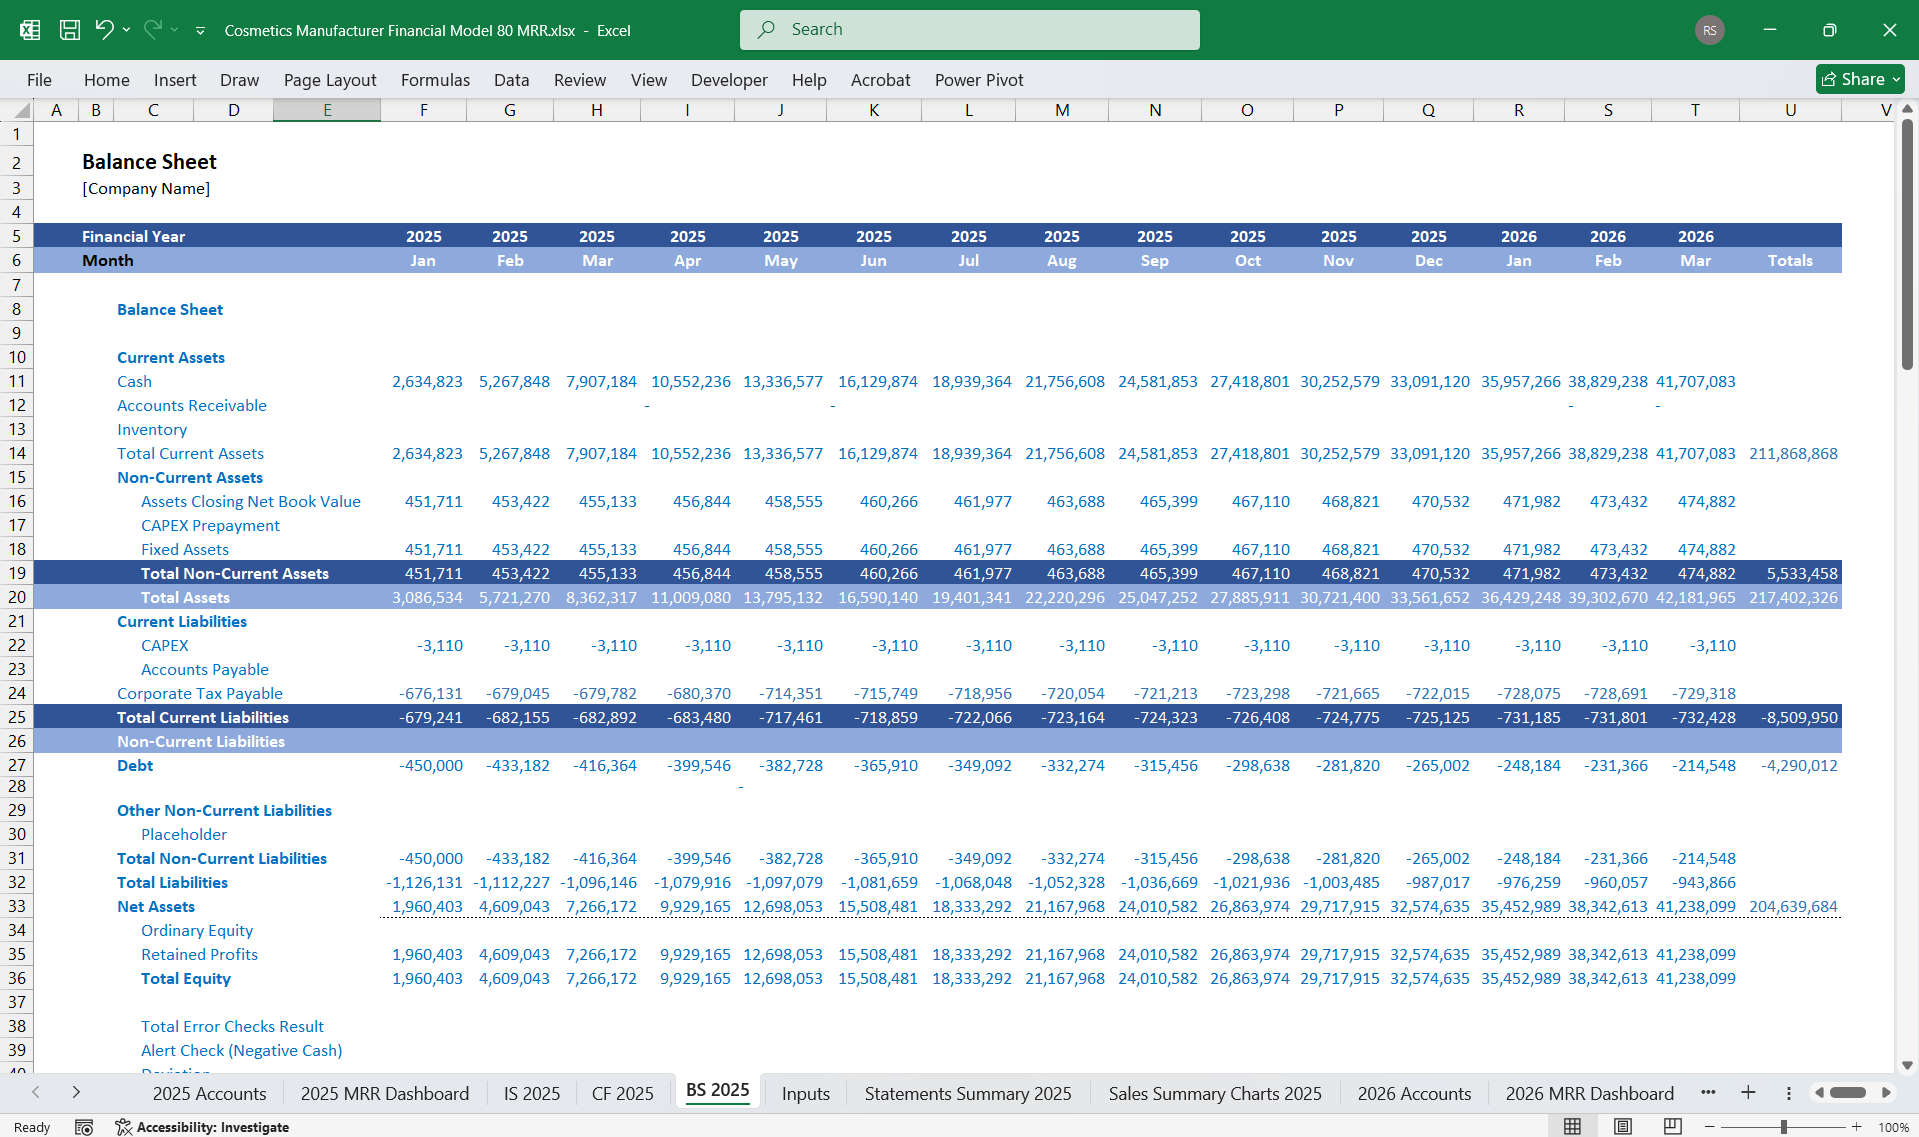
- Current Assets:
- Cash and Equivalents: Ensuring liquidity for operational needs.
- Inventory:
- Raw materials like oils and pigments.
- Work-in-progress formulations.
- Finished products awaiting distribution.
- Accounts Receivable: Outstanding payments from retailers or subscription customers.
- Non-Current Assets:
- Manufacturing equipment such as mixing machines, filling equipment, and conveyor systems.
- Intellectual property like product patents and brand trademarks.
- Current Liabilities:
- Payables to suppliers.
- Accrued marketing or labor costs.
- Non-Current Liabilities:
- Long-term loans or capital leases for manufacturing equipment.
- Shareholder equity for funding expansions.
- Retained earnings reinvested into R&D and new product lines.
- Revenue Growth Potential:
- Higher total revenue through niche products, premium items, and diverse demographics.
- Enables cross-selling opportunities (e.g., skincare serums + sunscreens).
- Cost Implications:
- Increased material costs due to specialized ingredients.
- Higher logistics and warehousing costs for managing diverse inventories.
- Profit Margins:
- Gross Margin: ~40-50%.
- Net Margin: ~10-15%.
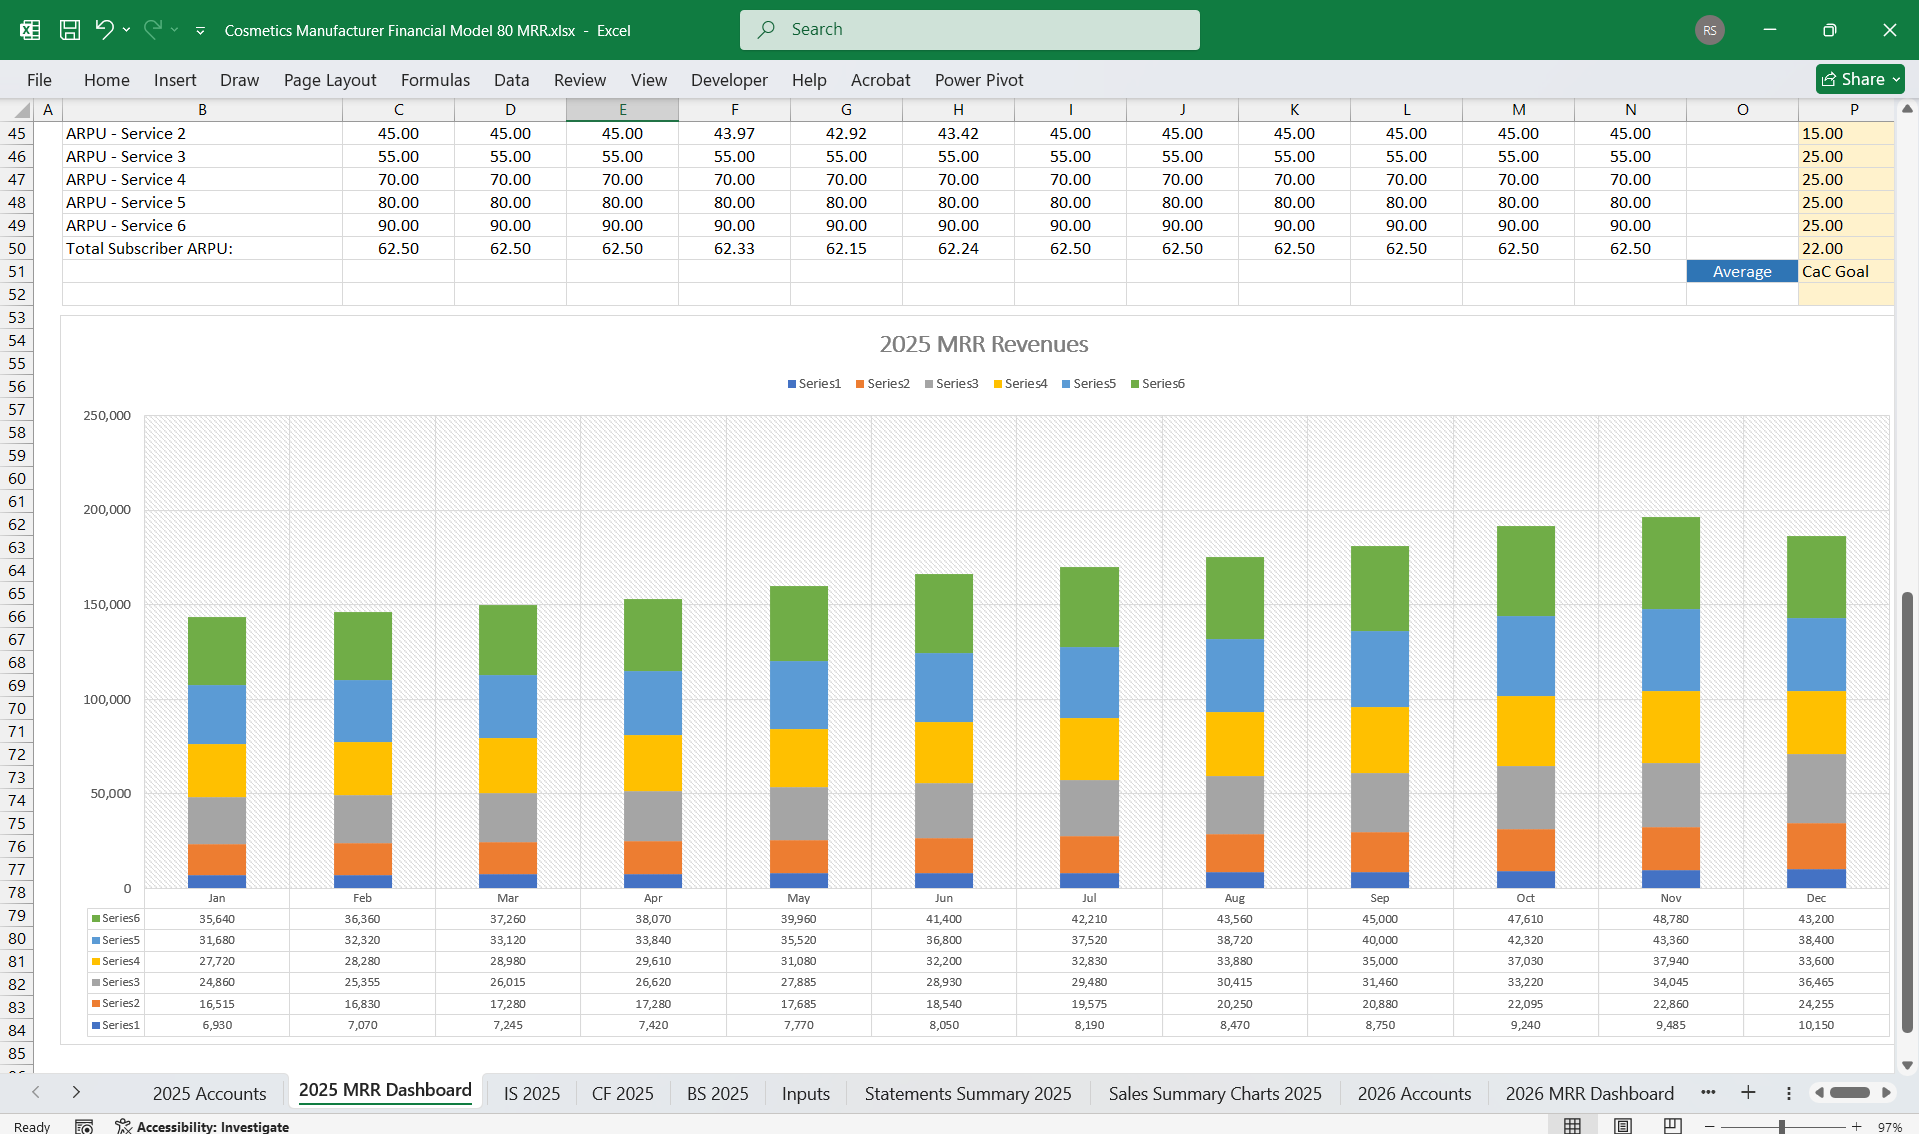
Tier Structure
- Tier 1 (Starter):
- Monthly selection of 2 products.
- Early access to new launches.
- Tier 2 (Essentials):
- Includes Tier 1 features.
- Customization options (e.g., skin type preferences).
- Tier 3 (Pro):
- Includes Tier 2 features.
- Seasonal skincare guide.
- Free samples of new products.
- Tier 4 (Premium):
- Includes Tier 3 features.
- Access to exclusive products not sold in stores.
- Virtual skincare consultations.
- Tier 5 (Enterprise):
- Includes Tier 4 features.
- Loyalty points program for additional savings.
- Access to personal account managers.
- Tier 6 (Custom Elite):
- Dedicated subscription package for spas, salons, and bulk buyers.
- Price: Starts at $1,000/month, varies based on order size.
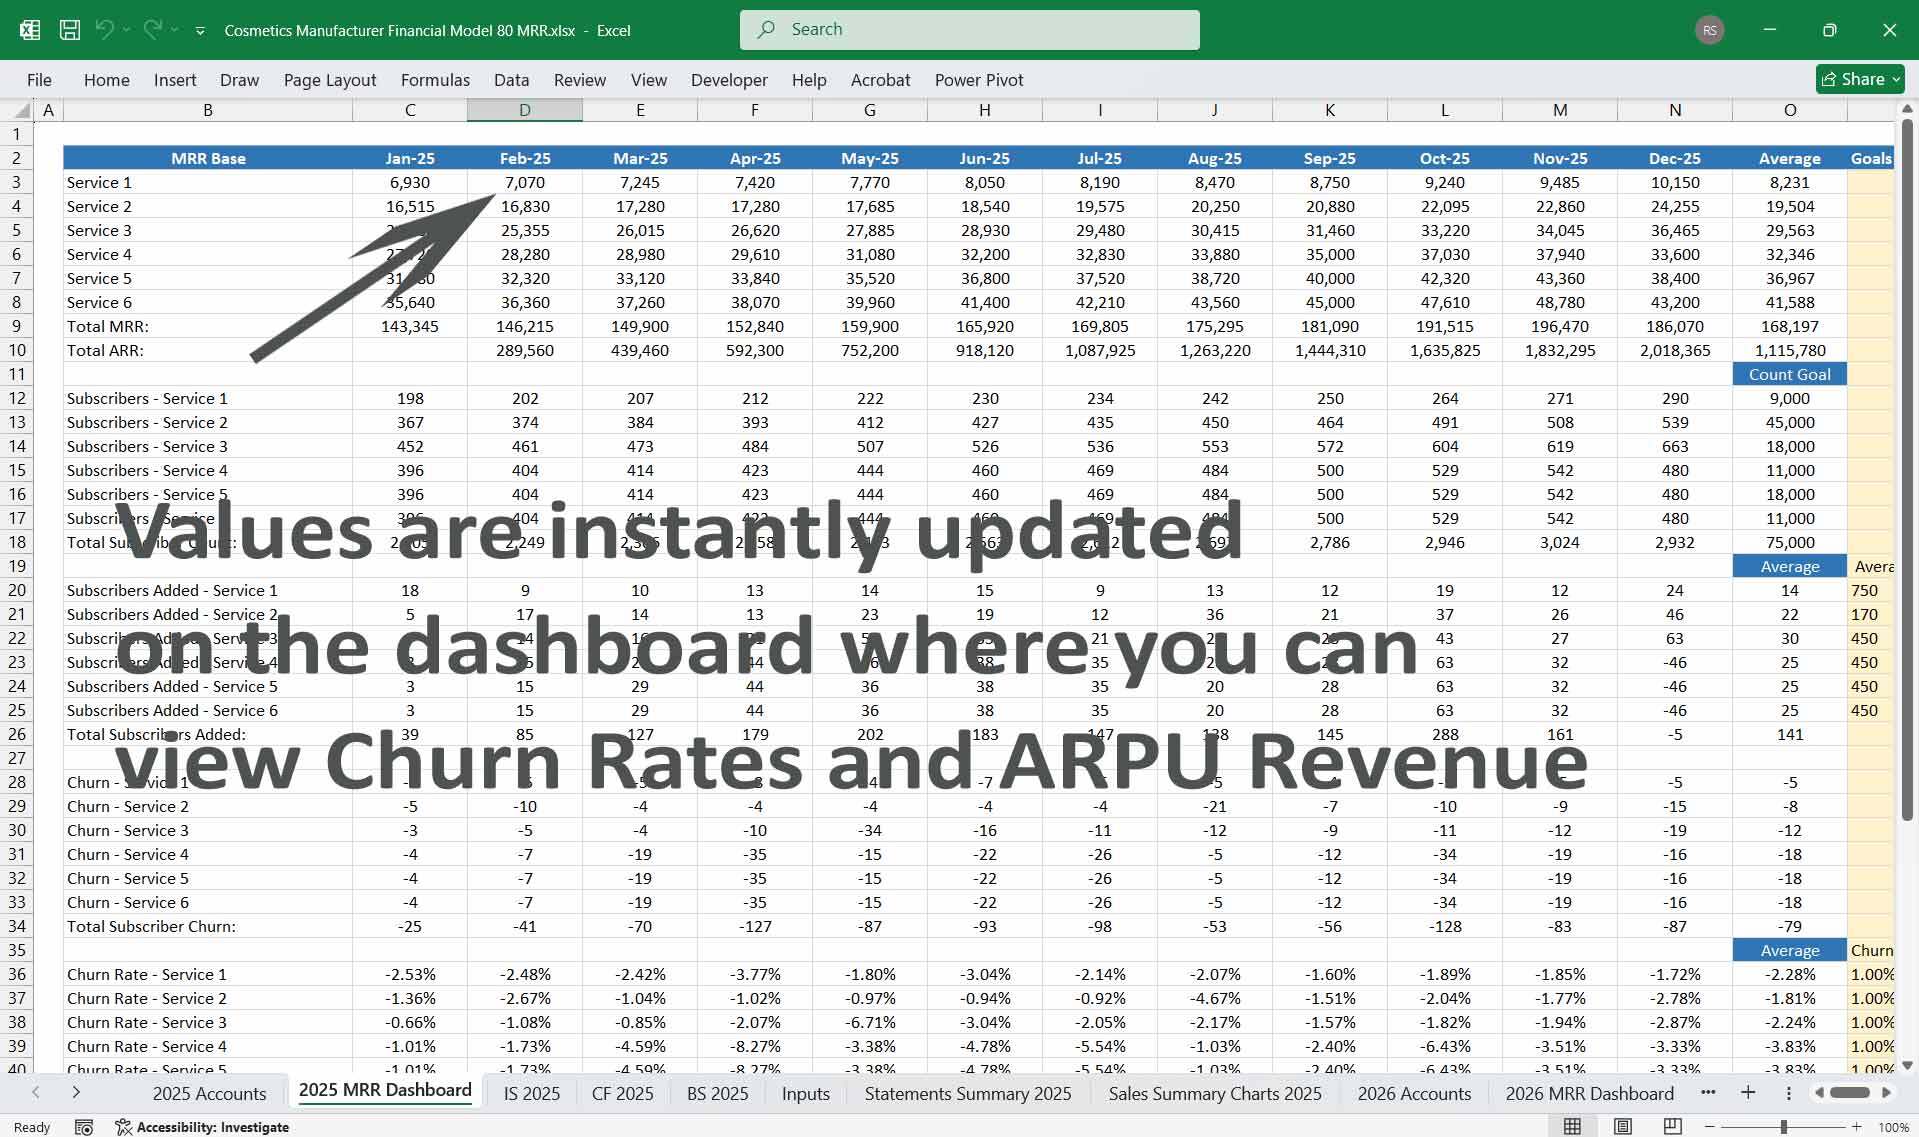
- Monthly Recurring Revenue (MRR) = ∑ (Subscribers × Monthly Fee).
- Annual Recurring Revenue (ARR) = MRR × 12.
- Customer Acquisition Cost (CAC): Total sales/marketing spend ÷ new subscribers.
- Lifetime Value (LTV) = Average Subscription Revenue × Average Subscription Duration (in months).
- Factory Utilization Rate: Tracks manufacturing capacity usage.
- Inventory Turnover Ratio: Measures efficiency in stock cycling.
- Subscriber Retention Rate: Loyalty percentage over a set time.
- Churn Rate: Monthly loss percentage in subscriber count.
- Contribution Margin by product line and subscription tier.
- Return on Invested Capital (ROIC): Monitors investment efficiency.
- Financial outcomes between 40- and 80-product portfolios.
- Profitability with and without subscription revenue streams.
This Best Practice includes
1 Excel Financial Model
Further information
Provides thorough oversight, tracking, and reporting of a cosmetics manufacturer's finances, including updates on budget utilisation and projections.
