
Originally published: 26/06/2023 10:20
Publication number: ELQ-73860-1
View all versions & Certificate
Publication number: ELQ-73860-1
View all versions & Certificate

Budget Analysis Model
This model performs analysis on actual spending of capex and opex items and conducts budget variance calculations and visualizations of spending monthly.
Description
BUDGET ANALYSIS MODEL
***Introduction***
Budgetary control is the most effective way of keeping expenses under control and ensuring targets for profitability and cash flows are met.
However, budgets are never met without variances.
The challenge facing Finance Directors is how to ensure the budgeting process is effective in reflecting actual results. This can only be achieved by understanding the nature and reason for variances across various budget items and expense categories.
Budgetary analysis will show the source and magnitude of variances as well as the weight of expenditures to allow for corrective measures by management.
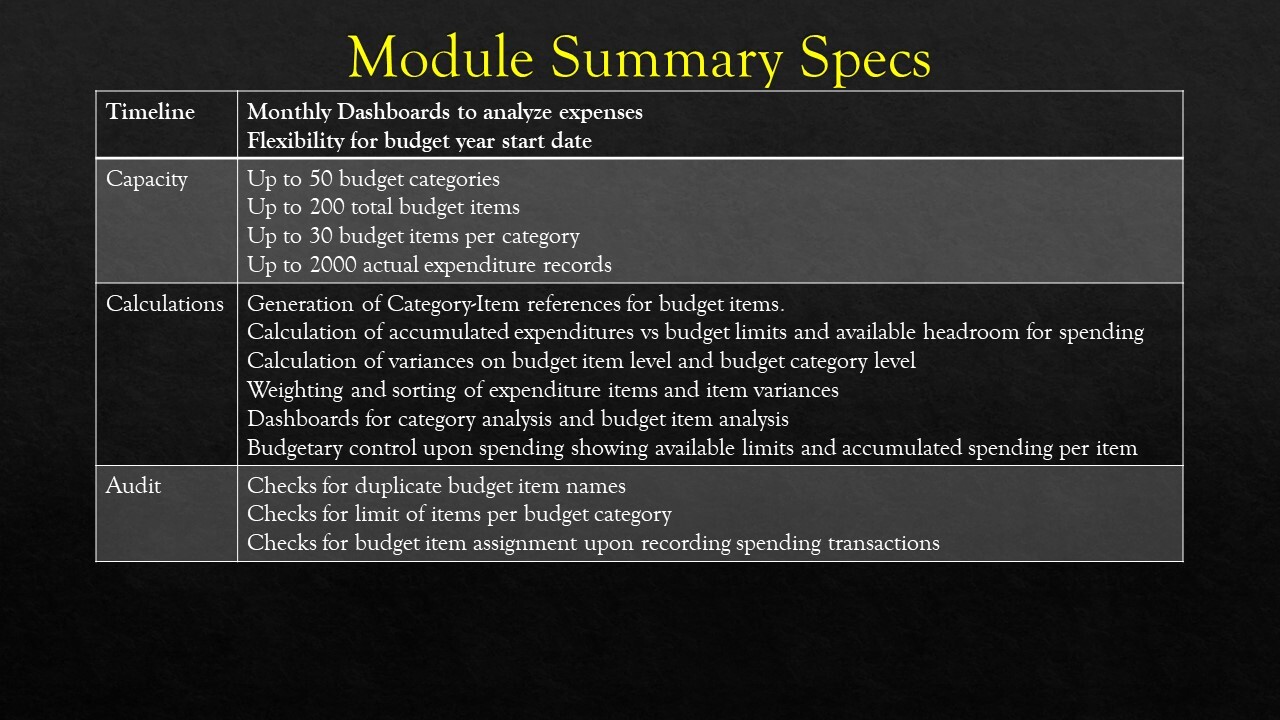
***Timeline***
Monthly Dashboards to analyze expenses
Flexibility for budget year start date
***Capacity***
Up to 50 budget categories
Up to 200 total budget items
Up to 30 budget items per category
Up to 2000 actual expenditure records
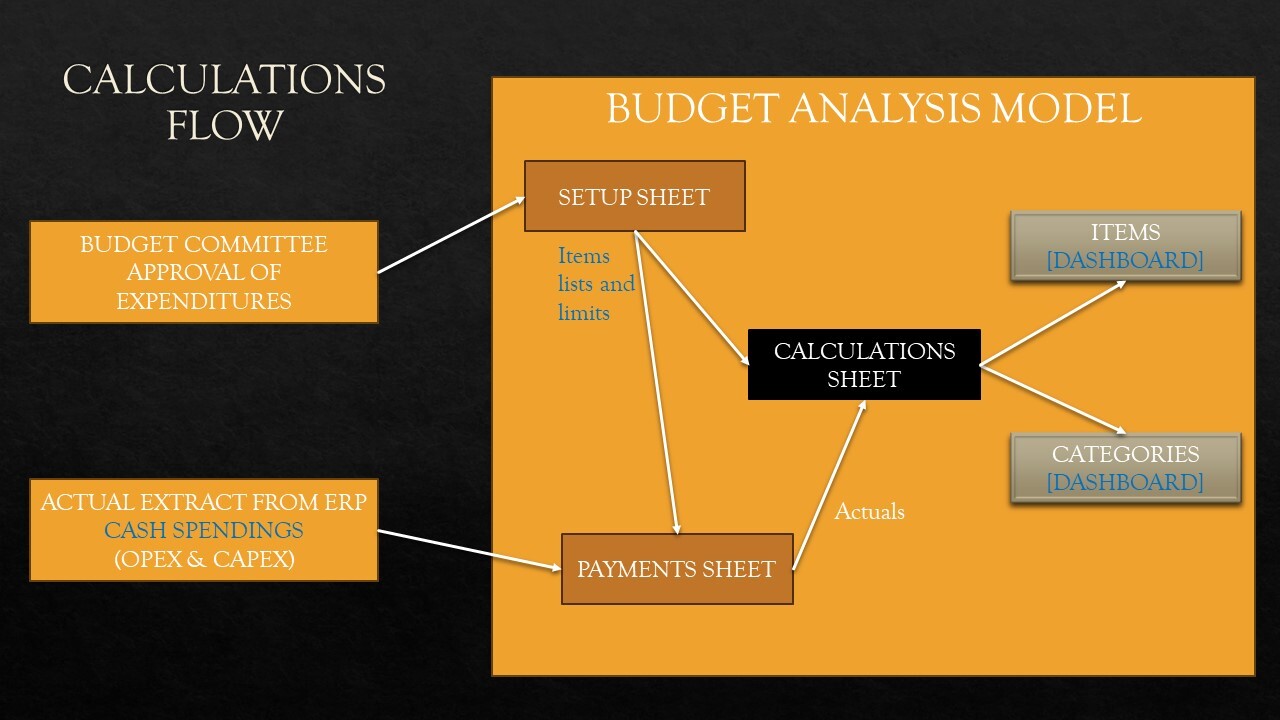
***Calculations***
Generation of Category-Item references for budget items.
Calculation of accumulated expenditures vs budget limits and available headroom for spending
Calculation of variances on budget item level and budget category level
Weighting and sorting of expenditure items and item variances
Dashboards for category analysis and budget item analysis
Budgetary control upon spending showing available limits and accumulated spending per item
***Audit***
Checks for duplicate budget item names
Checks for limit of items per budget category
Checks for budget item assignment upon recording spending transactions
***Budget Categories Setup***
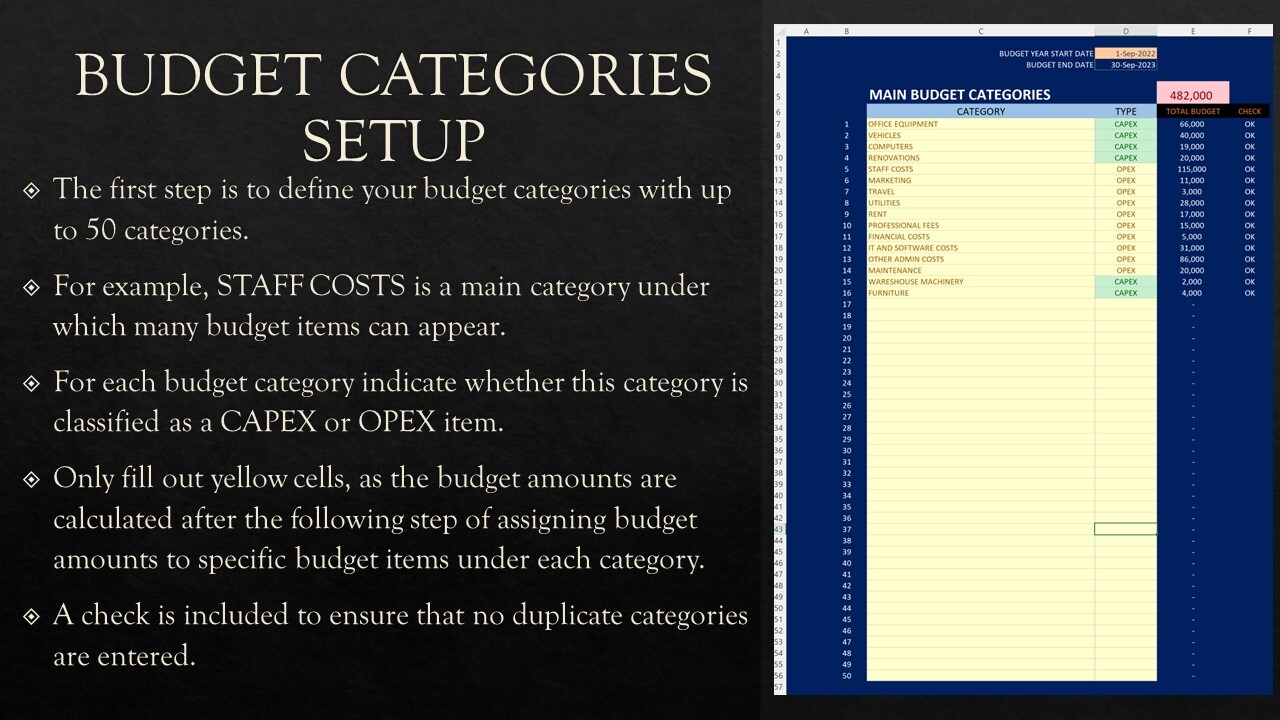
The first step is to define your budget categories with up to 50 categories.
For example, STAFF COSTS is a main category under which many budget items can appear.
For each budget category indicate whether this category is classified as a CAPEX or OPEX item.
Only fill out yellow cells, as the budget amounts are calculated after the following step of assigning budget amounts to specific budget items under each category.
A check is included to ensure that no duplicate categories are entered.
***Budget Items Setup***
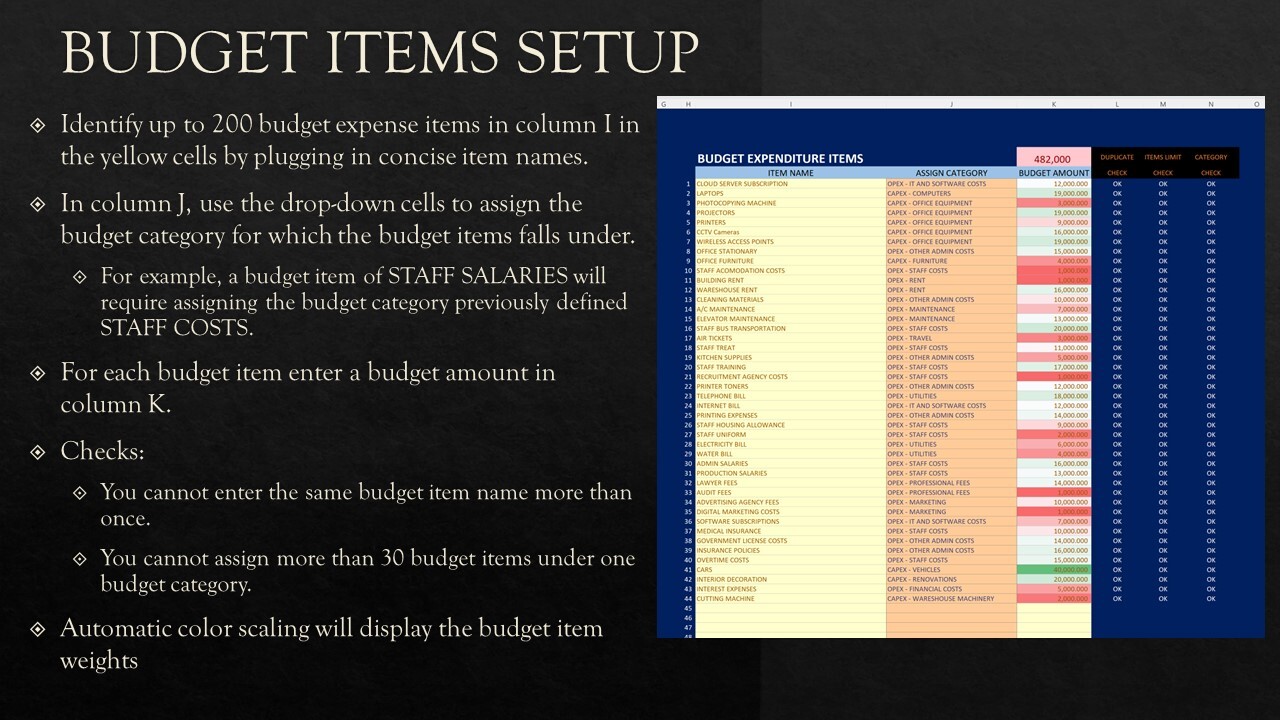
Identify up to 200 budget expense items in column I in the yellow cells by plugging in concise item names.
In column J, use the drop-down cells to assign the budget category for which the budget items falls under. For example, a budget item of STAFF SALARIES will require assigning the budget category previously defined STAFF COSTS.
For each budget item enter a budget amount in column K.
Checks: 1) You cannot enter the same budget item name more than once; 2) You cannot assign more than 30 budget items under one budget category.
Automatic color scaling will display the budget item weights
***Recording Payments [Actuals]***
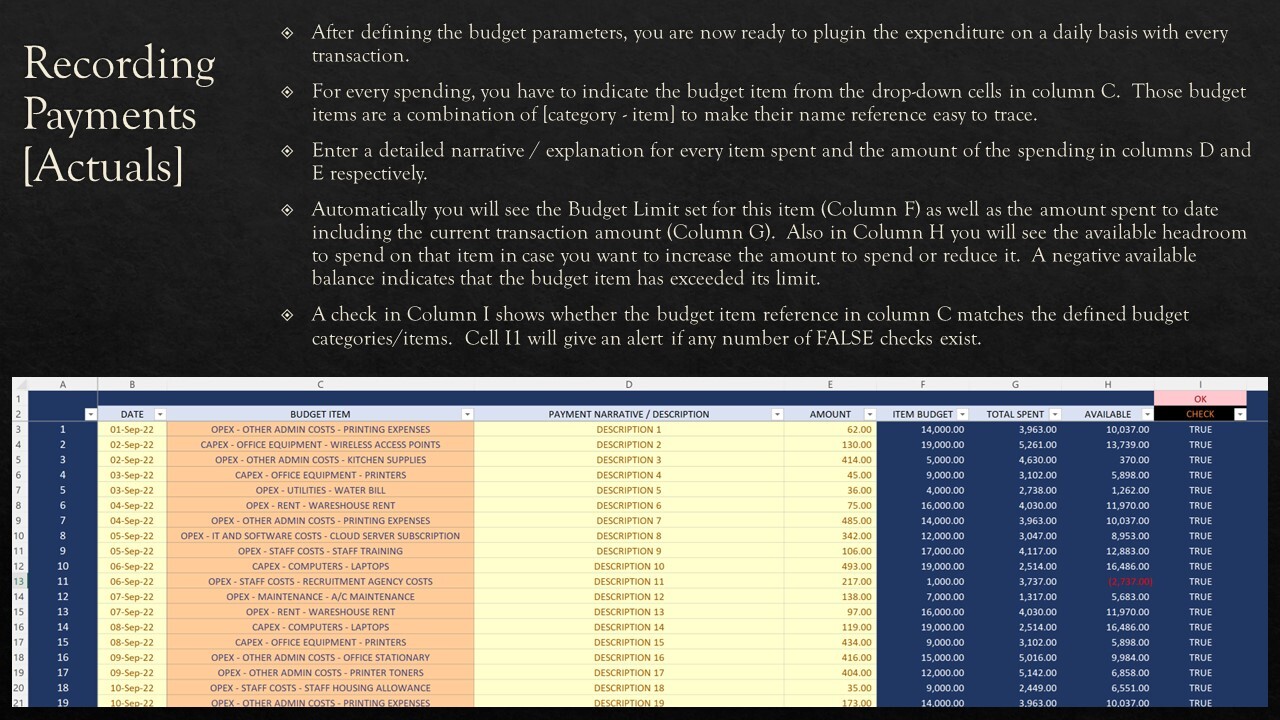
After defining the budget parameters, you are now ready to plugin the expenditure on a daily basis with every transaction.
For every spending, you have to indicate the budget item from the drop-down cells in column C. Those budget items are a combination of [category - item] to make their name reference easy to trace.
Enter a detailed narrative / explanation for every item spent and the amount of the spending in columns D and E respectively.
Automatically you will see the Budget Limit set for this item (Column F) as well as the amount spent to date including the current transaction amount (Column G). Also, in Column H you will see the available headroom to spend on that item in case you want to increase the amount to spend or reduce it. A negative available balance indicates that the budget item has exceeded its limit.
A check in Column I shows whether the budget item reference in column C matches the defined budget categories/items. Cell I1 will give an alert if any number of FALSE checks exist.
***Items Dashboard***
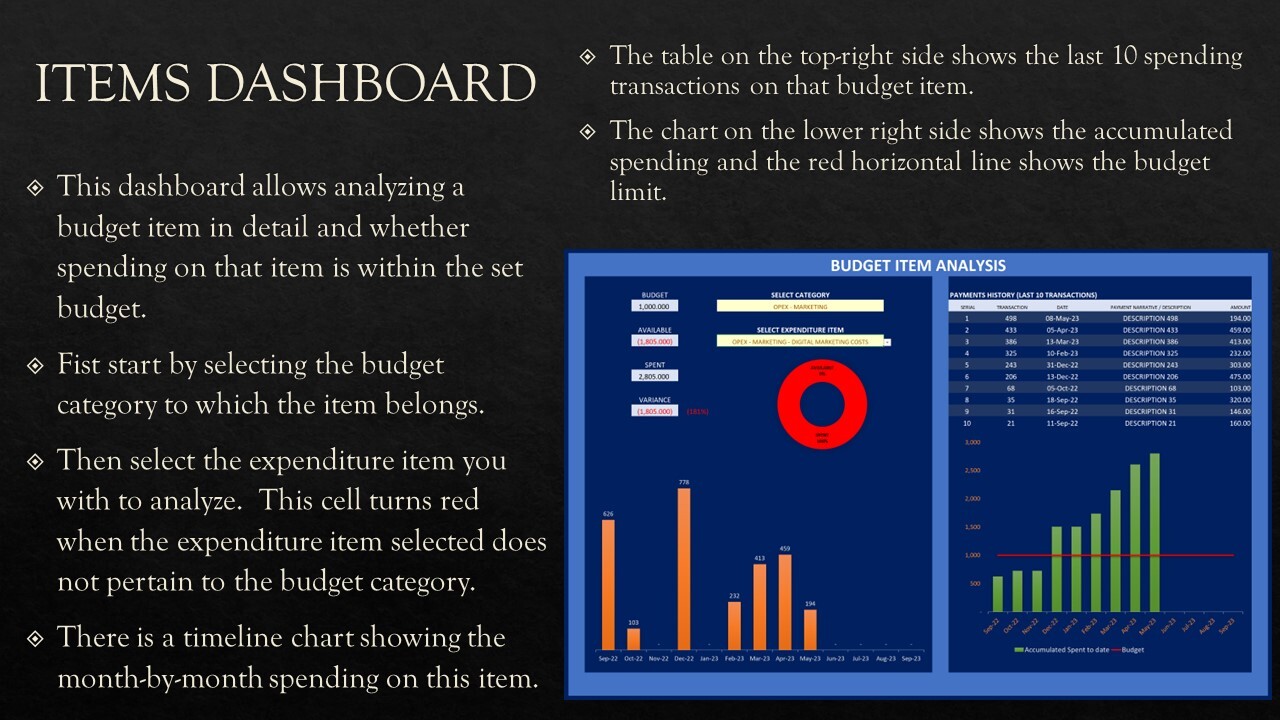
This dashboard allows analyzing a budget item in detail and whether spending on that item is within the set budget.
First, start by selecting the budget category to which the item belongs.
Then select the expenditure item you with to analyze. This cell turns red when the expenditure item selected does not pertain to the budget category.
There is a timeline chart showing the month-by-month spending on this item.
The table on the top-right side shows the last 10 spending transactions on that budget item.
The chart on the lower right side shows the accumulated spending and the red horizontal line shows the budget limit.
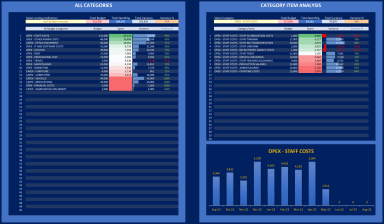
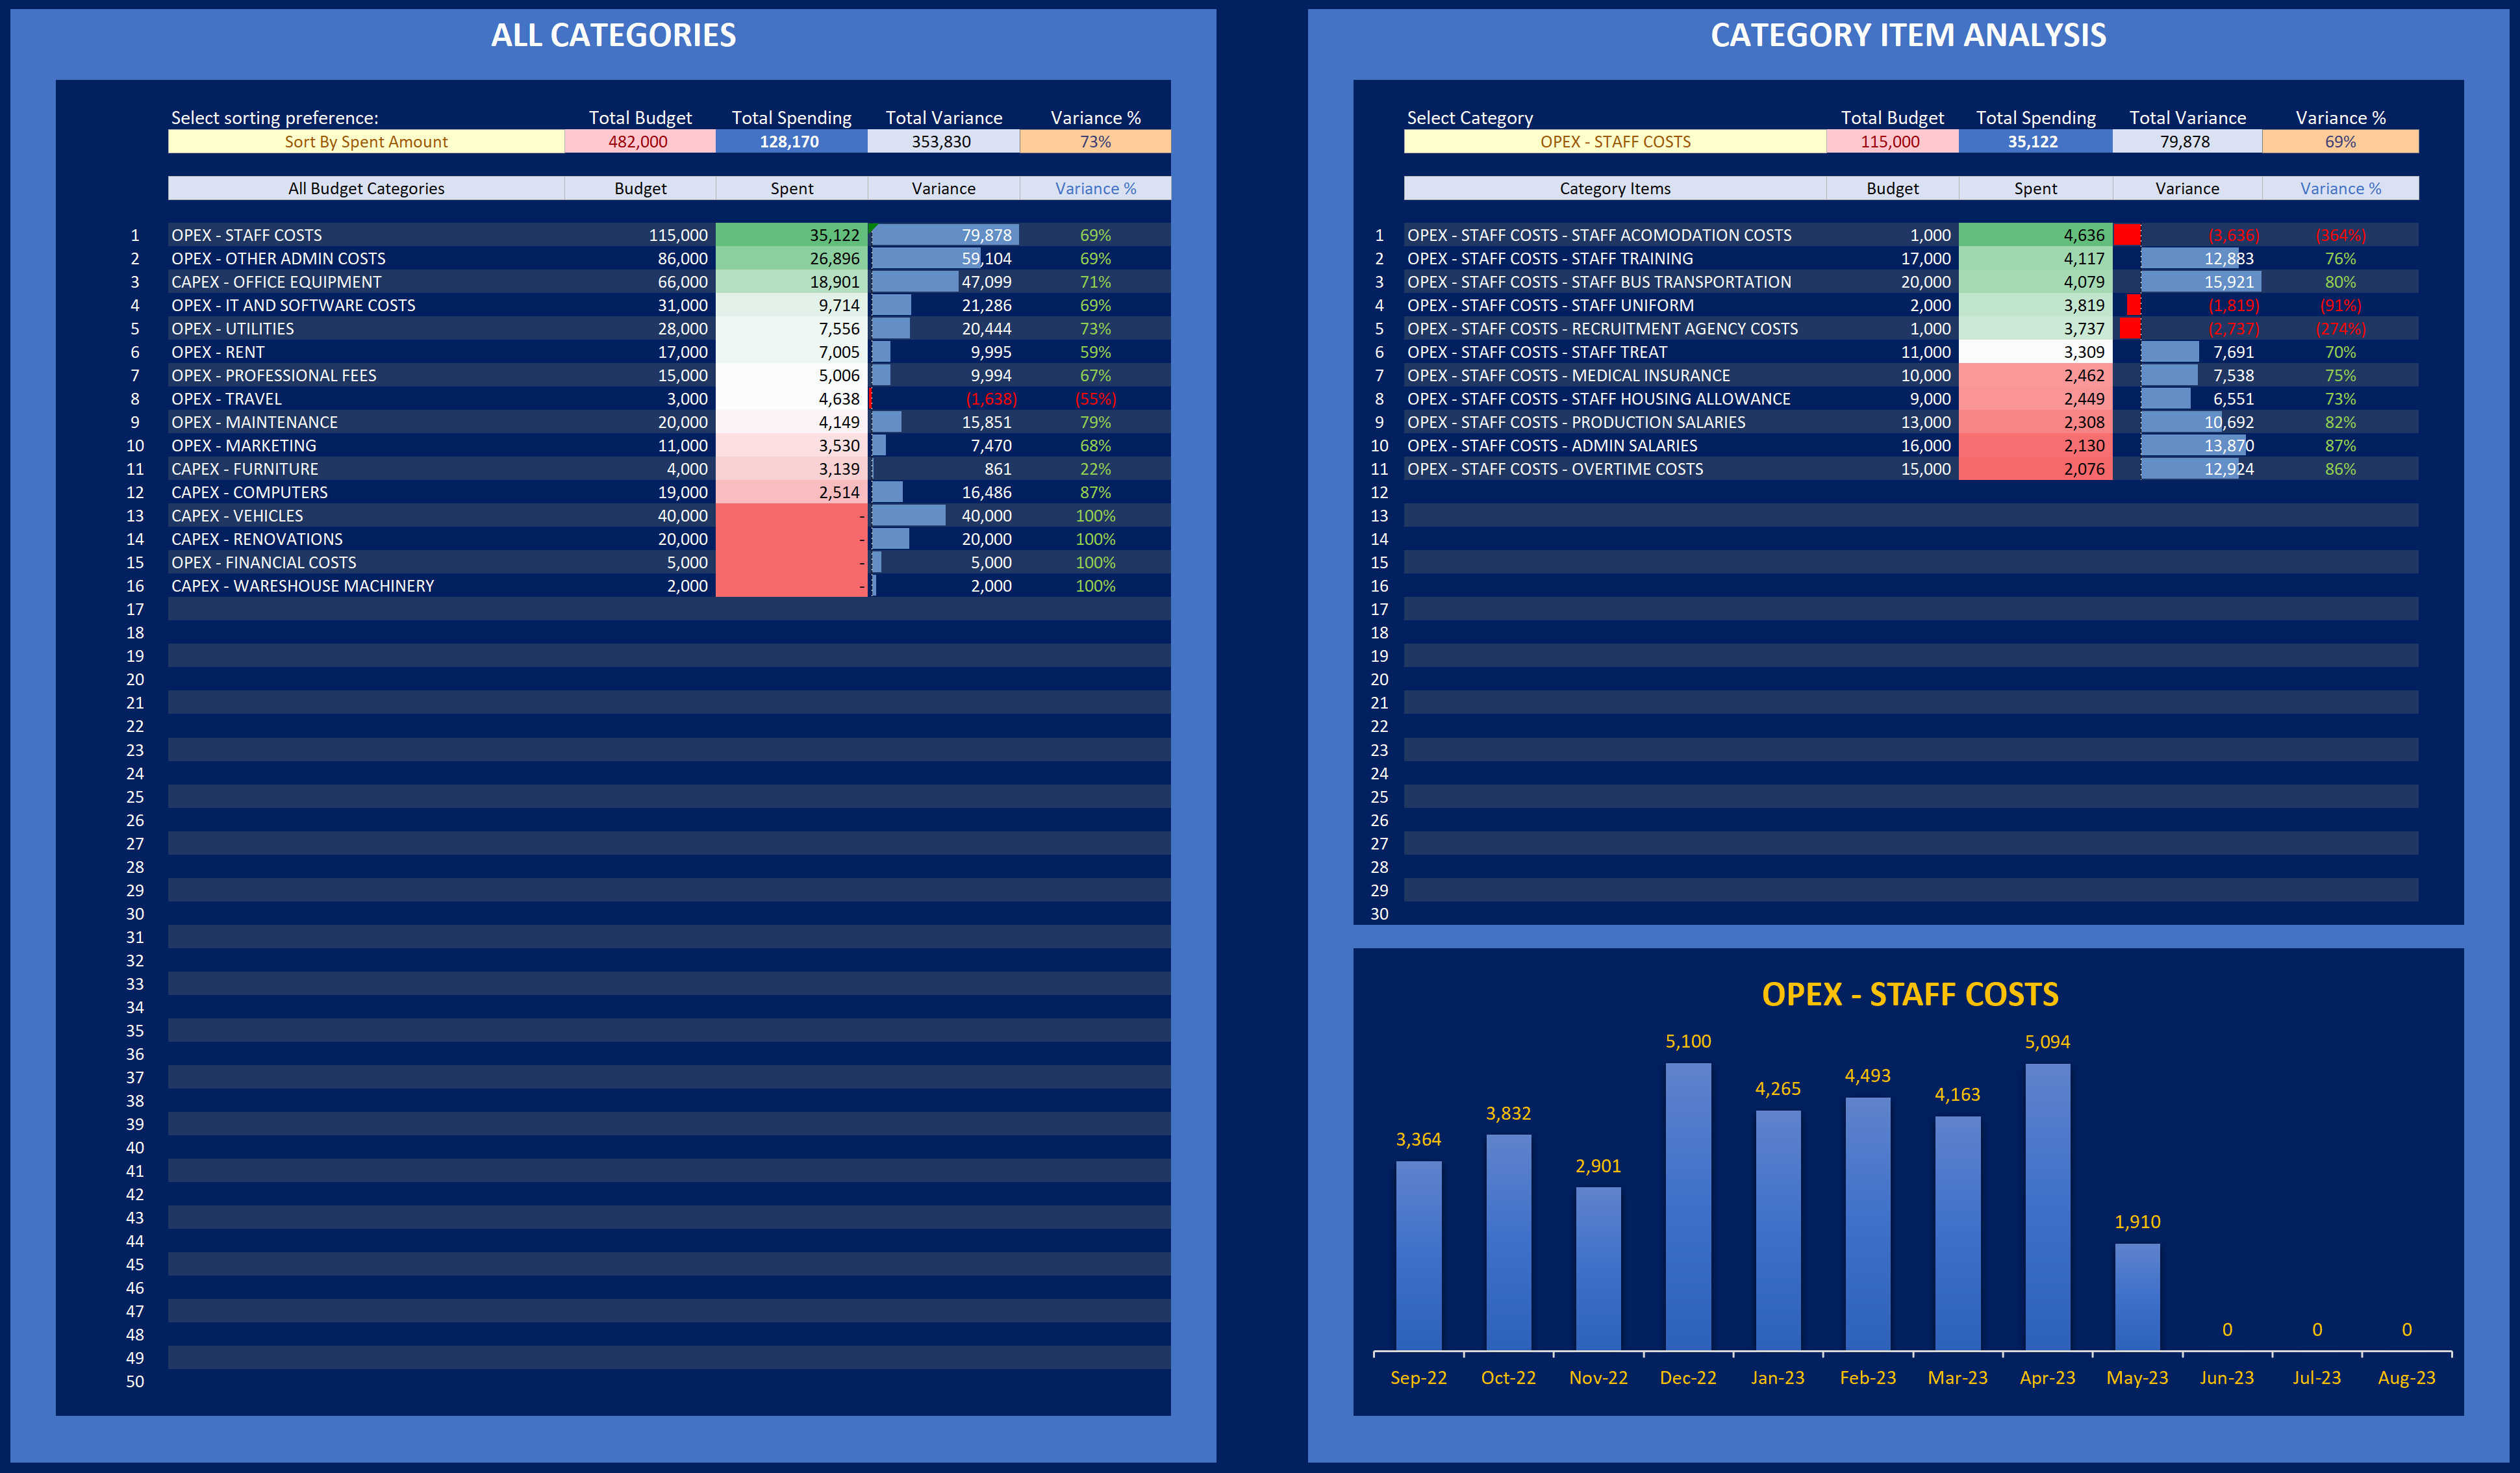
***Categories Dashboard***
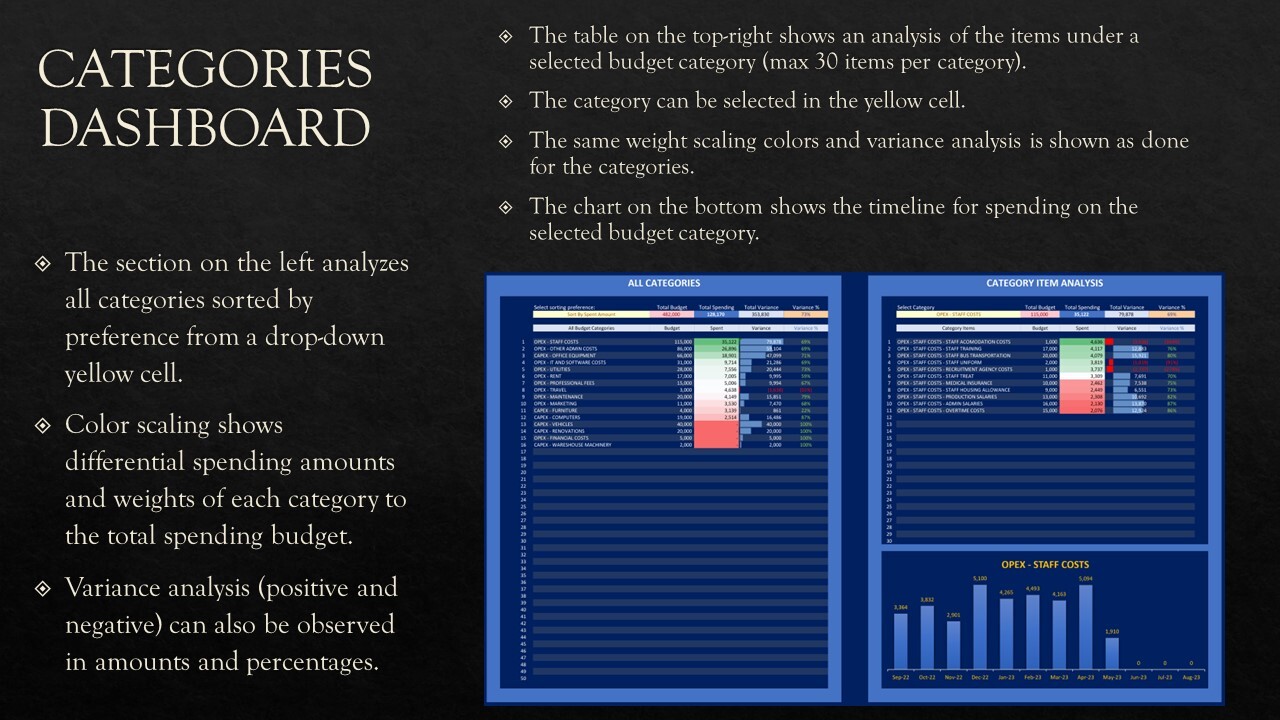
The section on the left analyzes all categories sorted by preference from a drop-down yellow cell.
Color scaling shows differential spending amounts and weights of each category to the total spending budget.
Variance analysis (positive and negative) can also be observed in amounts and percentages.
The table on the top-right shows an analysis of the items under a selected budget category (max 30 items per category).
The category can be selected in the yellow cell.
The same weight scaling colors and variance analysis is shown as done for the categories.
The chart on the bottom shows the timeline for spending on the selected budget category.
BUDGET ANALYSIS MODEL
***Introduction***
Budgetary control is the most effective way of keeping expenses under control and ensuring targets for profitability and cash flows are met.
However, budgets are never met without variances.
The challenge facing Finance Directors is how to ensure the budgeting process is effective in reflecting actual results. This can only be achieved by understanding the nature and reason for variances across various budget items and expense categories.
Budgetary analysis will show the source and magnitude of variances as well as the weight of expenditures to allow for corrective measures by management.
***Timeline***
Monthly Dashboards to analyze expenses
Flexibility for budget year start date
***Capacity***
Up to 50 budget categories
Up to 200 total budget items
Up to 30 budget items per category
Up to 2000 actual expenditure records
***Calculations***
Generation of Category-Item references for budget items.
Calculation of accumulated expenditures vs budget limits and available headroom for spending
Calculation of variances on budget item level and budget category level
Weighting and sorting of expenditure items and item variances
Dashboards for category analysis and budget item analysis
Budgetary control upon spending showing available limits and accumulated spending per item
***Audit***
Checks for duplicate budget item names
Checks for limit of items per budget category
Checks for budget item assignment upon recording spending transactions
***Budget Categories Setup***
The first step is to define your budget categories with up to 50 categories.
For example, STAFF COSTS is a main category under which many budget items can appear.
For each budget category indicate whether this category is classified as a CAPEX or OPEX item.
Only fill out yellow cells, as the budget amounts are calculated after the following step of assigning budget amounts to specific budget items under each category.
A check is included to ensure that no duplicate categories are entered.
***Budget Items Setup***
Identify up to 200 budget expense items in column I in the yellow cells by plugging in concise item names.
In column J, use the drop-down cells to assign the budget category for which the budget items falls under. For example, a budget item of STAFF SALARIES will require assigning the budget category previously defined STAFF COSTS.
For each budget item enter a budget amount in column K.
Checks: 1) You cannot enter the same budget item name more than once; 2) You cannot assign more than 30 budget items under one budget category.
Automatic color scaling will display the budget item weights
***Recording Payments [Actuals]***
After defining the budget parameters, you are now ready to plugin the expenditure on a daily basis with every transaction.
For every spending, you have to indicate the budget item from the drop-down cells in column C. Those budget items are a combination of [category - item] to make their name reference easy to trace.
Enter a detailed narrative / explanation for every item spent and the amount of the spending in columns D and E respectively.
Automatically you will see the Budget Limit set for this item (Column F) as well as the amount spent to date including the current transaction amount (Column G). Also, in Column H you will see the available headroom to spend on that item in case you want to increase the amount to spend or reduce it. A negative available balance indicates that the budget item has exceeded its limit.
A check in Column I shows whether the budget item reference in column C matches the defined budget categories/items. Cell I1 will give an alert if any number of FALSE checks exist.
***Items Dashboard***
This dashboard allows analyzing a budget item in detail and whether spending on that item is within the set budget.
First, start by selecting the budget category to which the item belongs.
Then select the expenditure item you with to analyze. This cell turns red when the expenditure item selected does not pertain to the budget category.
There is a timeline chart showing the month-by-month spending on this item.
The table on the top-right side shows the last 10 spending transactions on that budget item.
The chart on the lower right side shows the accumulated spending and the red horizontal line shows the budget limit.
***Categories Dashboard***
The section on the left analyzes all categories sorted by preference from a drop-down yellow cell.
Color scaling shows differential spending amounts and weights of each category to the total spending budget.
Variance analysis (positive and negative) can also be observed in amounts and percentages.
The table on the top-right shows an analysis of the items under a selected budget category (max 30 items per category).
The category can be selected in the yellow cell.
The same weight scaling colors and variance analysis is shown as done for the categories.
The chart on the bottom shows the timeline for spending on the selected budget category.
This Best Practice includes
1 pdf file, 1 excel file
Further information
To help finance managers, treasurers and CFOs perform budgetary control and analysis of expenditures.
Users must have installed office 365 and have basic knowledge of budget variances.
none
