



Originally published: 09/01/2025 13:10
Publication number: ELQ-53622-1
View all versions & Certificate
Publication number: ELQ-53622-1
View all versions & Certificate

3D Printing Manufacturer (Additive Mfg) Financial Model
Comprehensive editable, 5-year 3 statement MS Excel spreadsheet for tracking 3d Printing Manufacturer Finances.
 by AllFinancialModels
AllFinancialModels offer a curated selection of high-quality yet financial model templates designed to support a wide range of business needs.Follow
Description
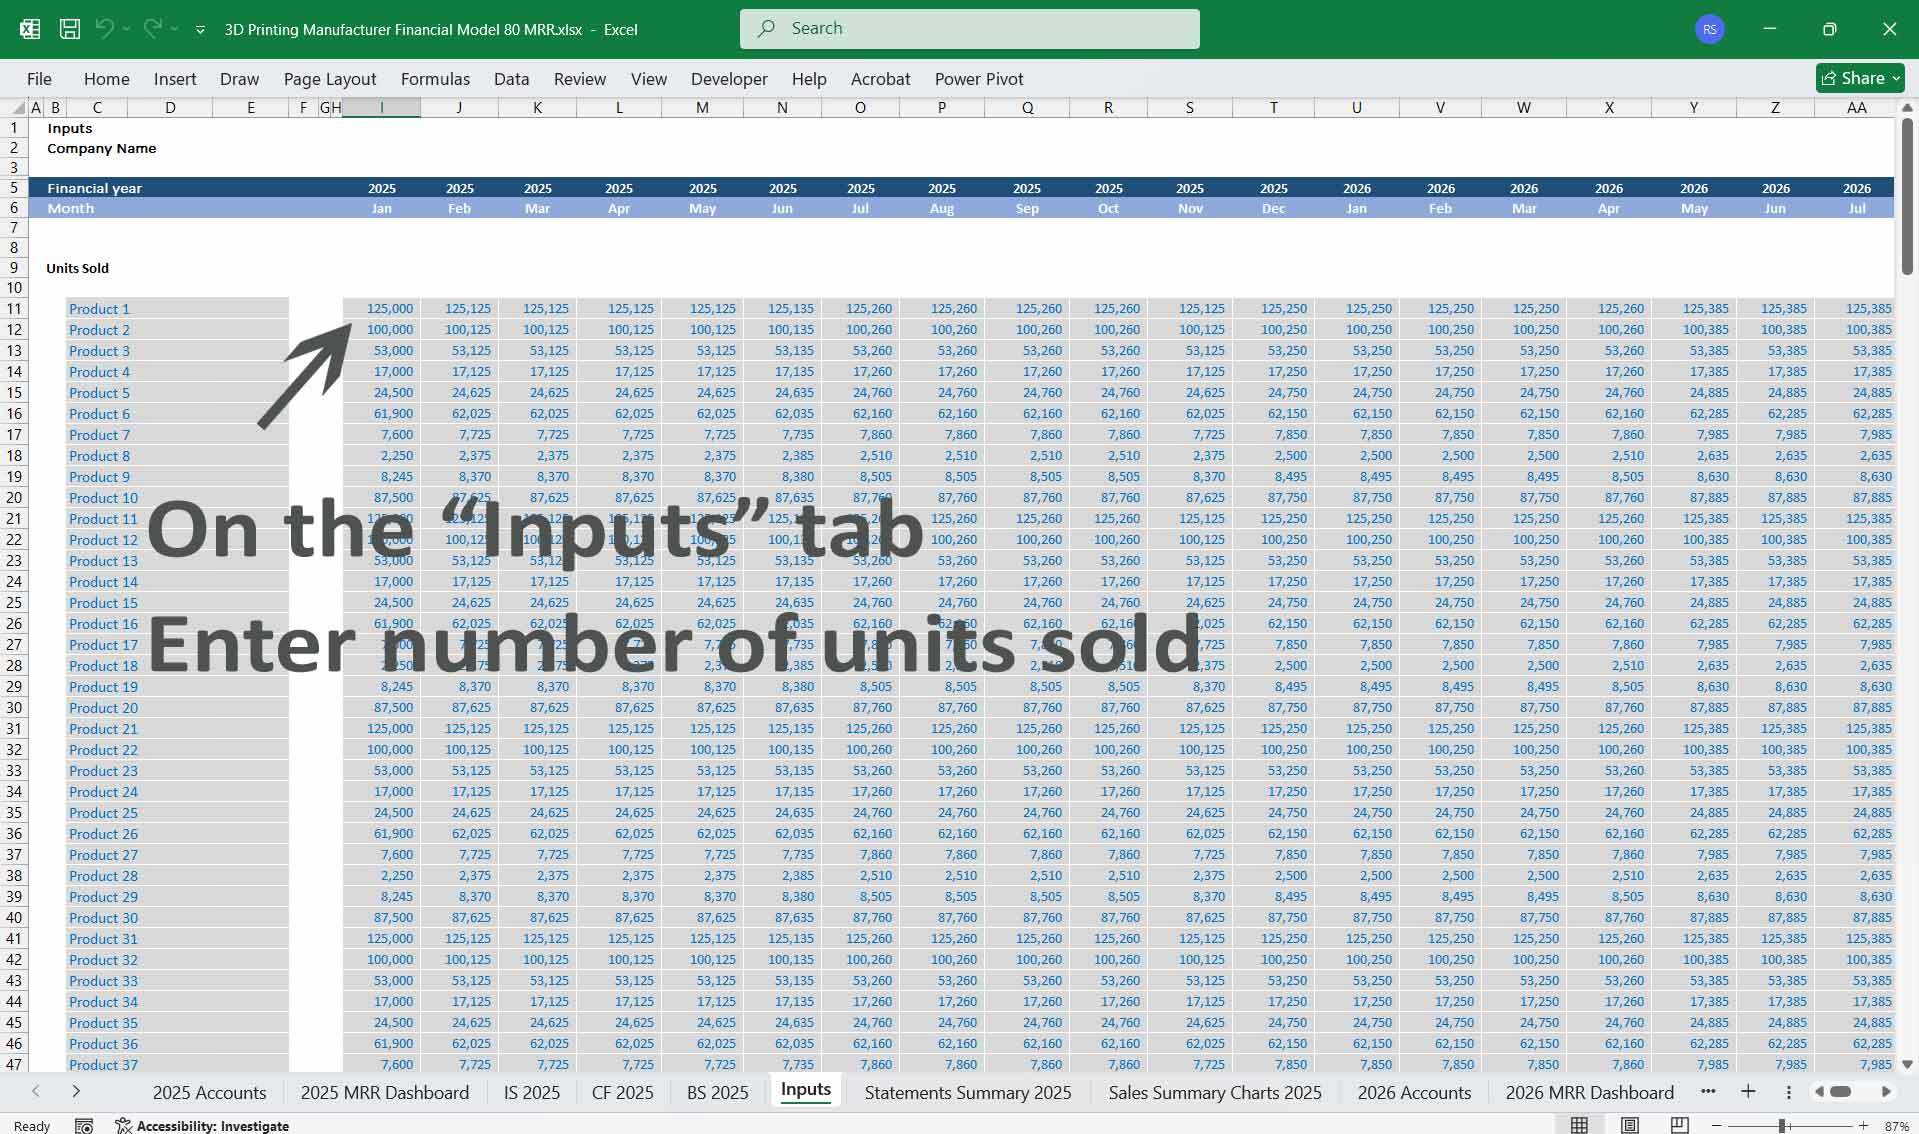
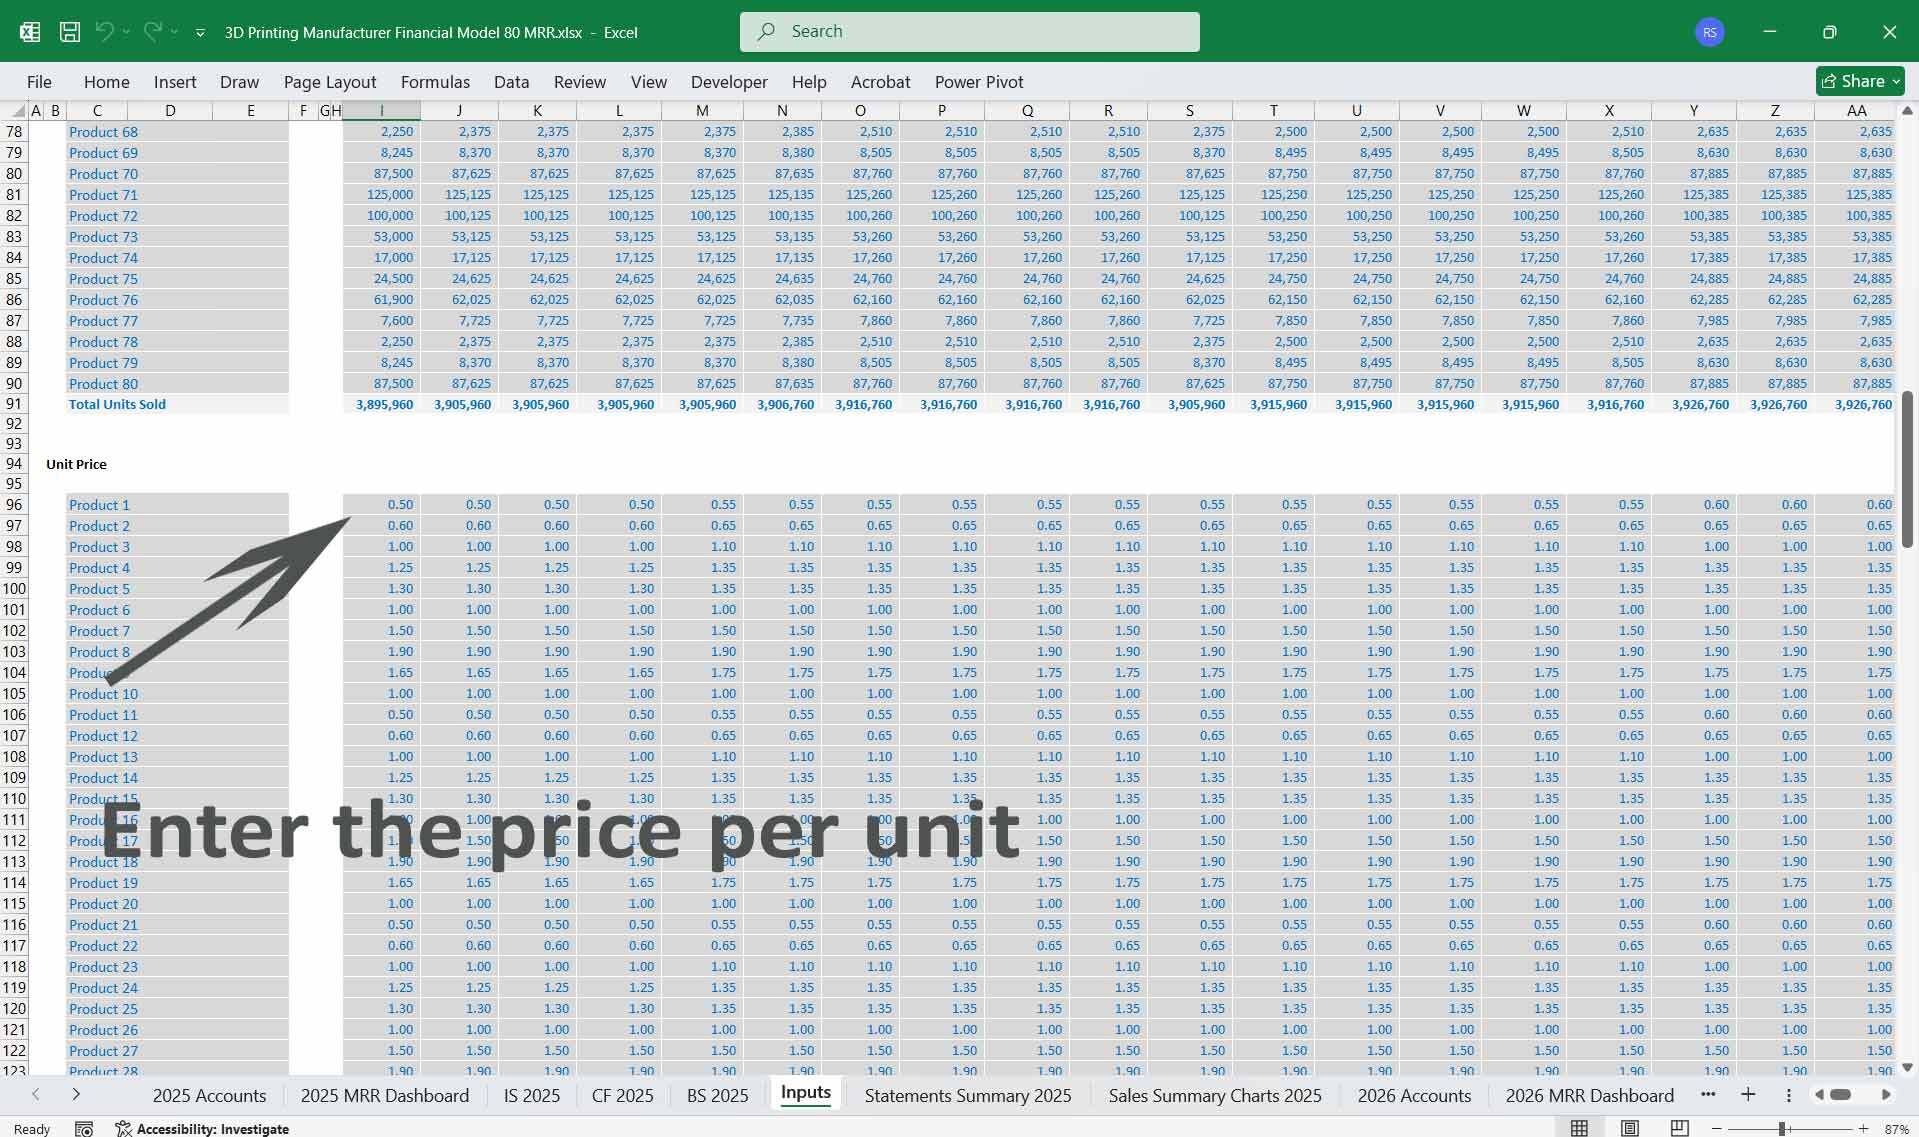
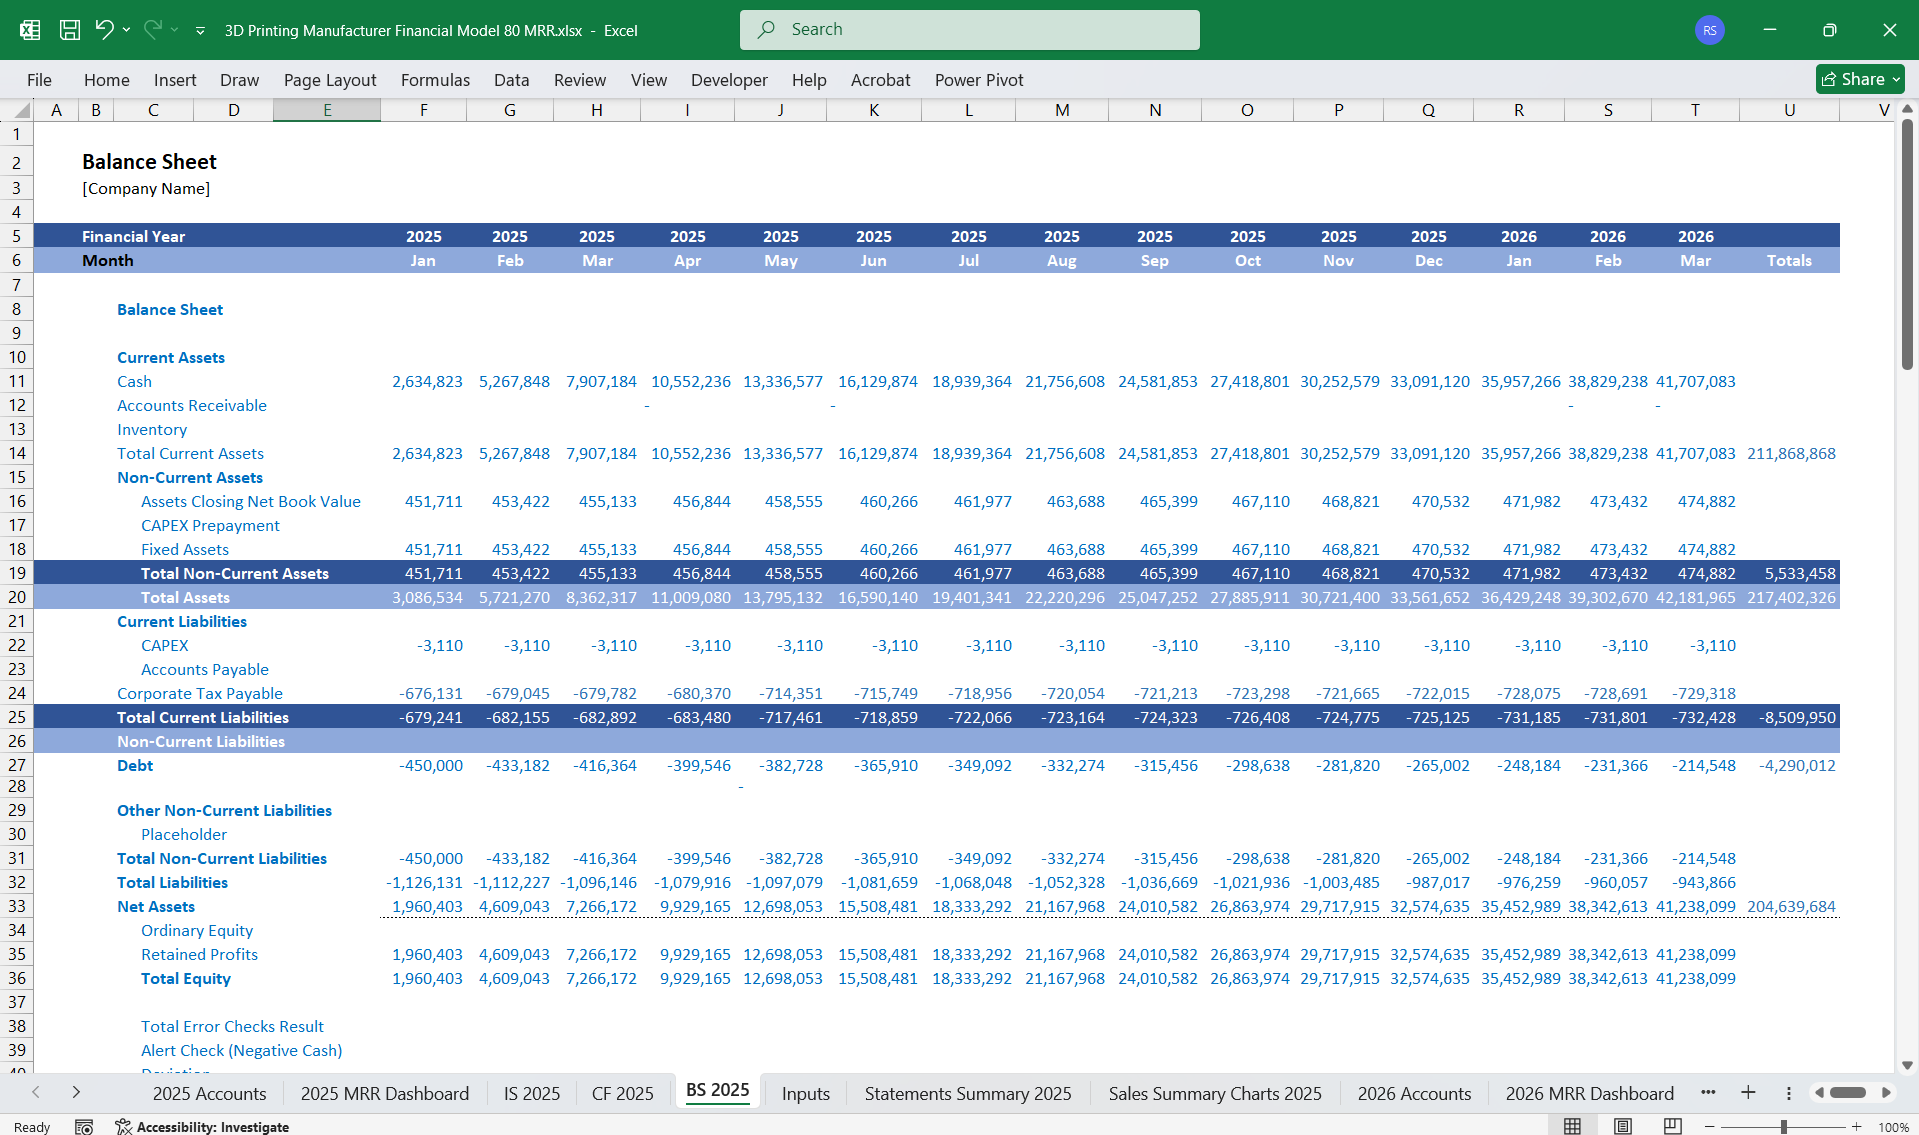
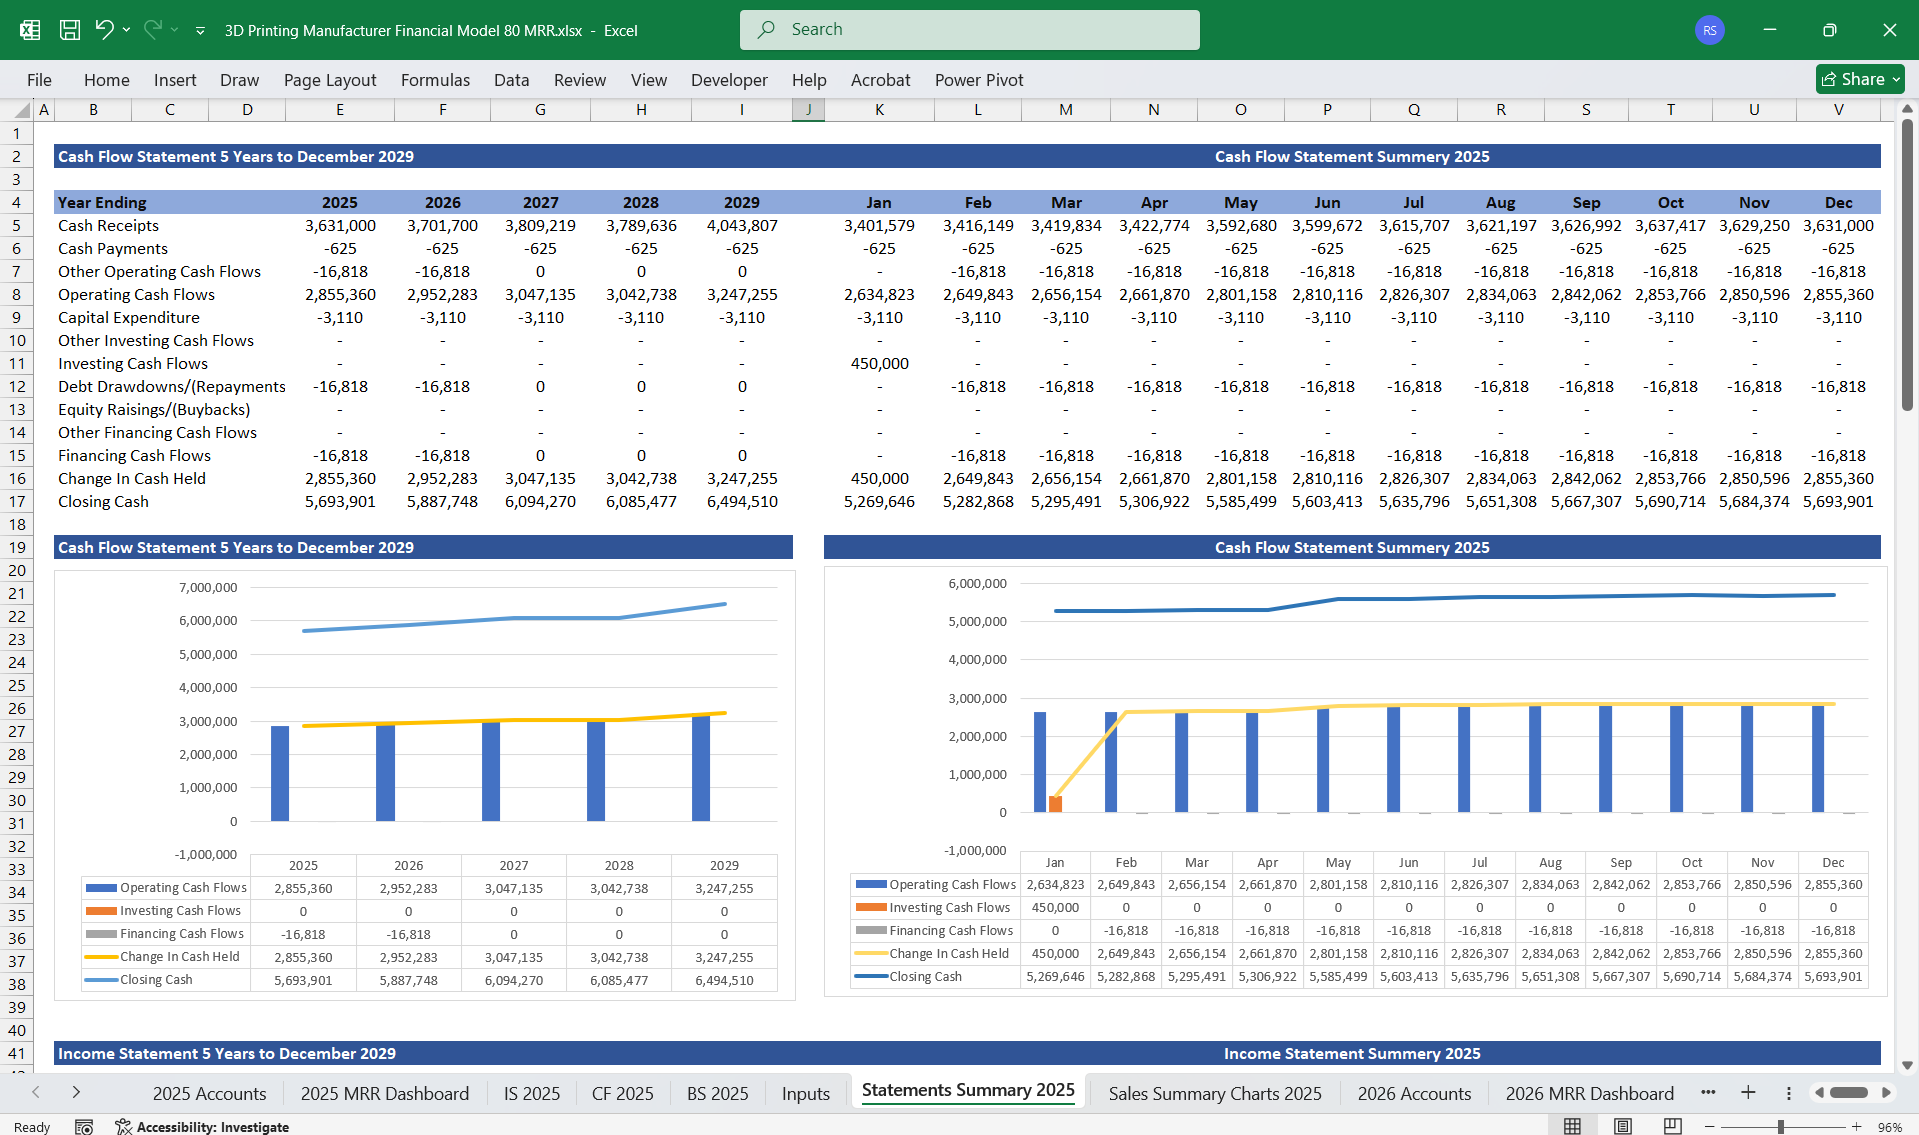
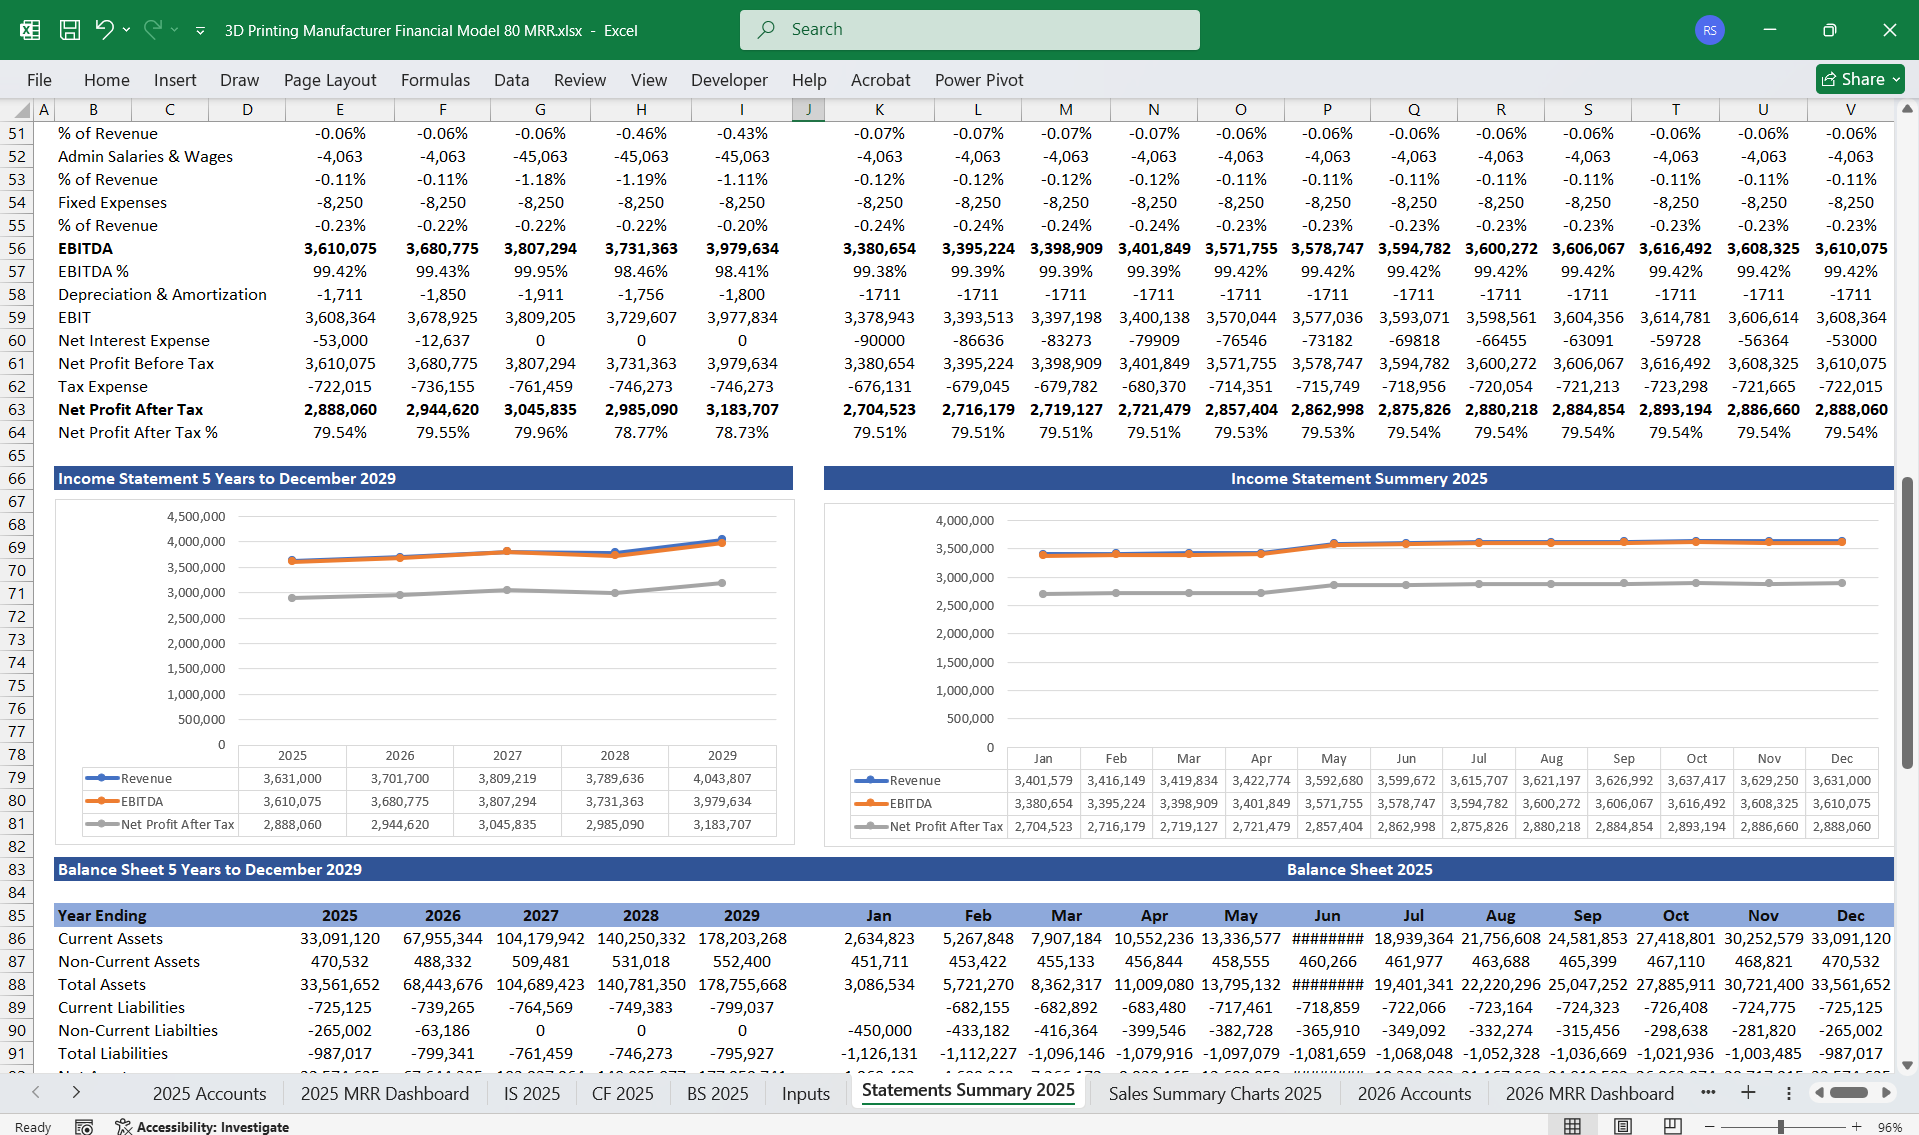
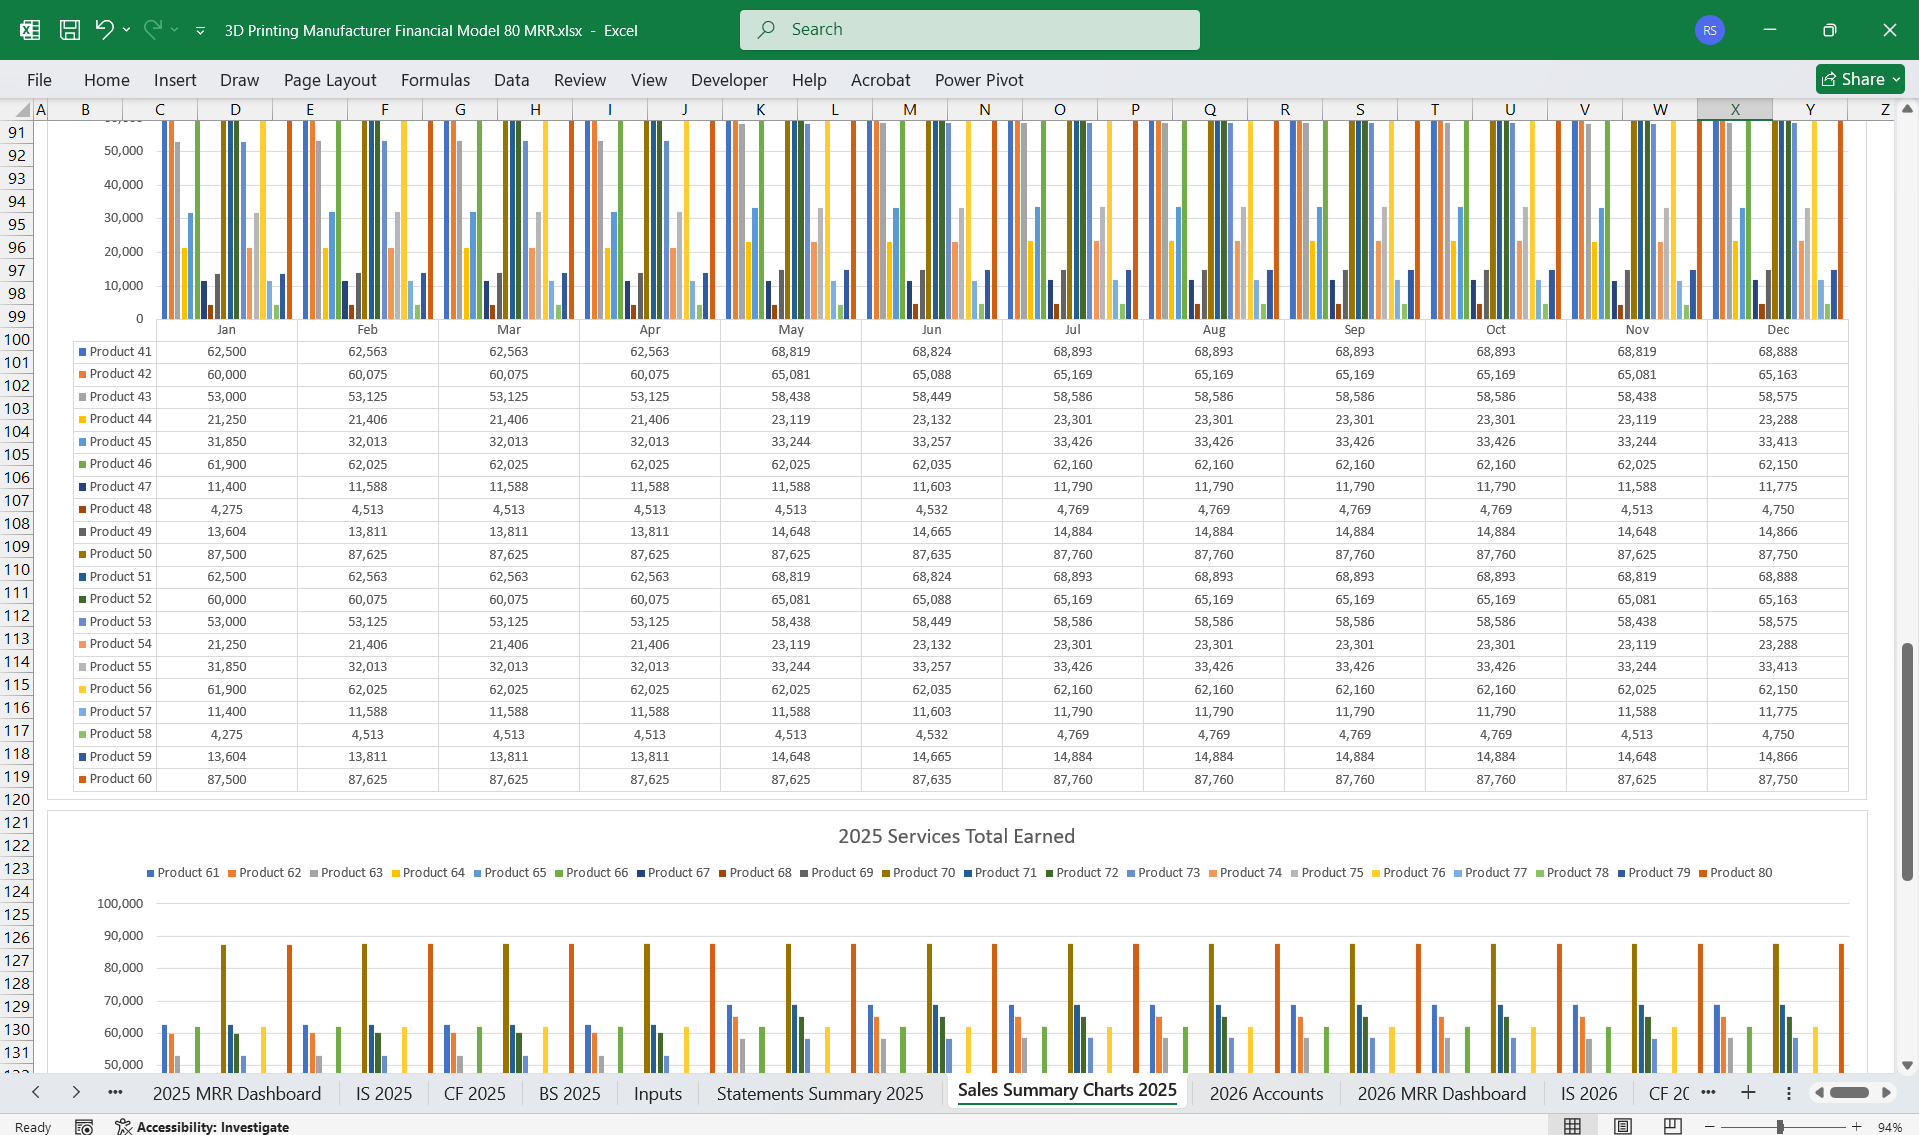
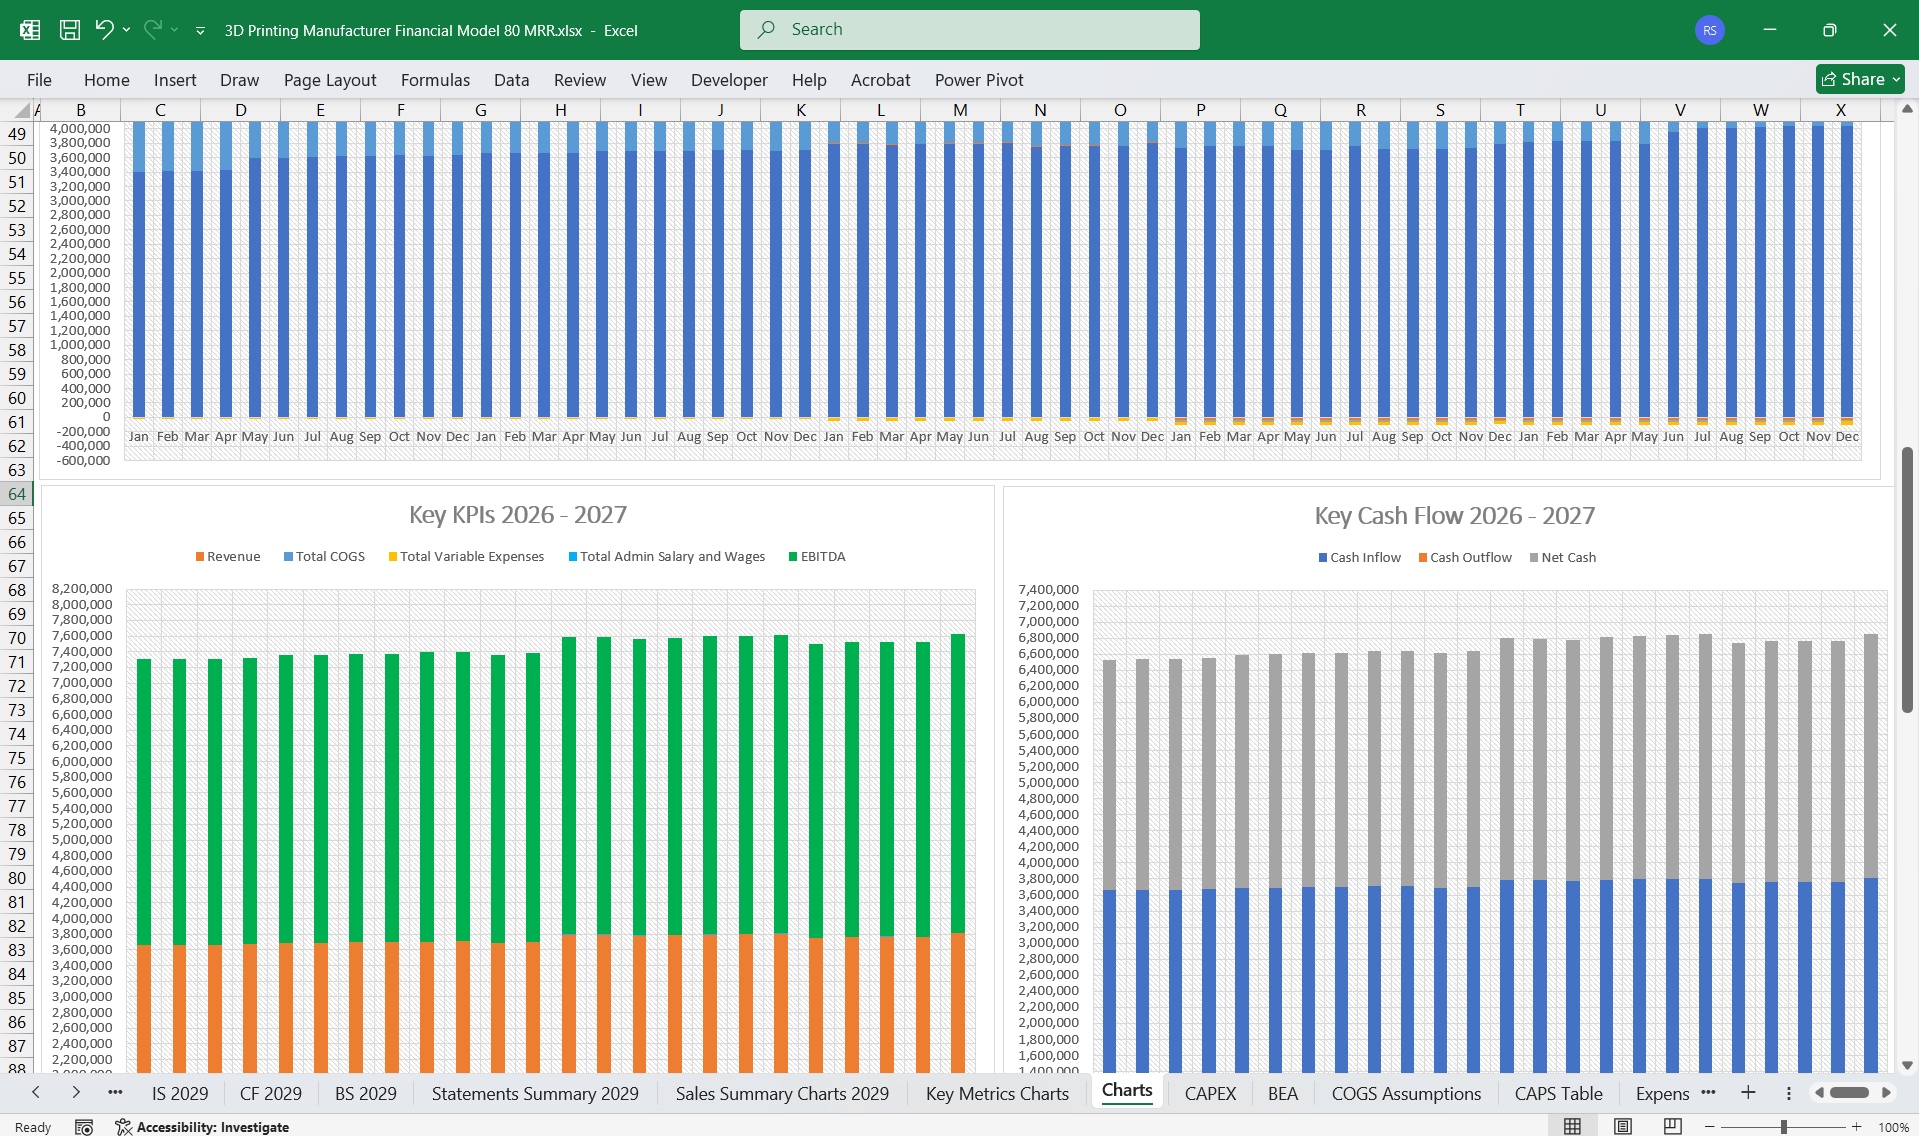
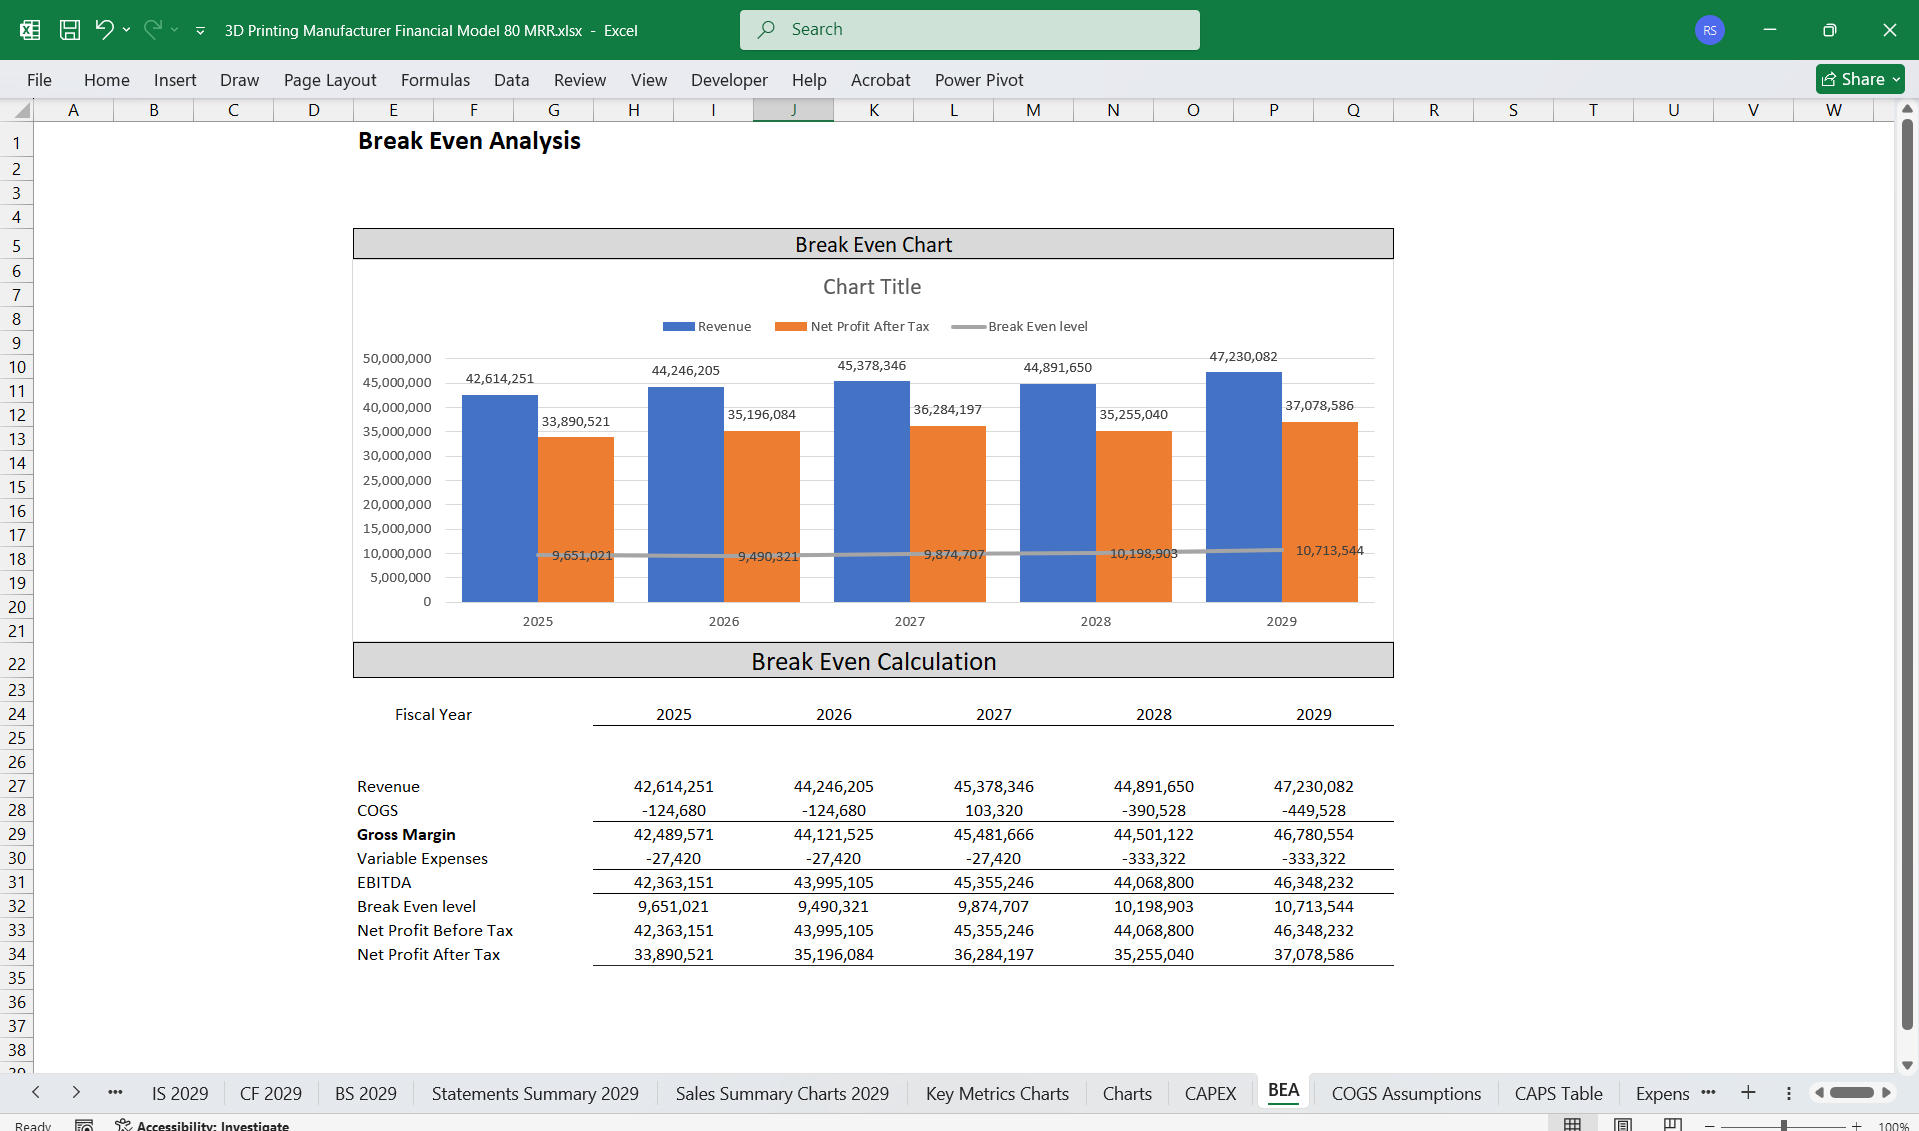
Financial Models for a 3D Printing Manufacturer (Additive Mfg)This detailed 5-year 3 3-statement financial model is tailored for a 3D Printing (Additive Mfg) Manufacturer, which creates precision-engineered parts for industries like aerospace, automotive, healthcare, and electronics. The models encompass the Income Statement, Cash Flow Statement, and Balance Sheet, with segmented projections for 80-product lines, along with 6-Tier Subscription aimed at offering specialized services.
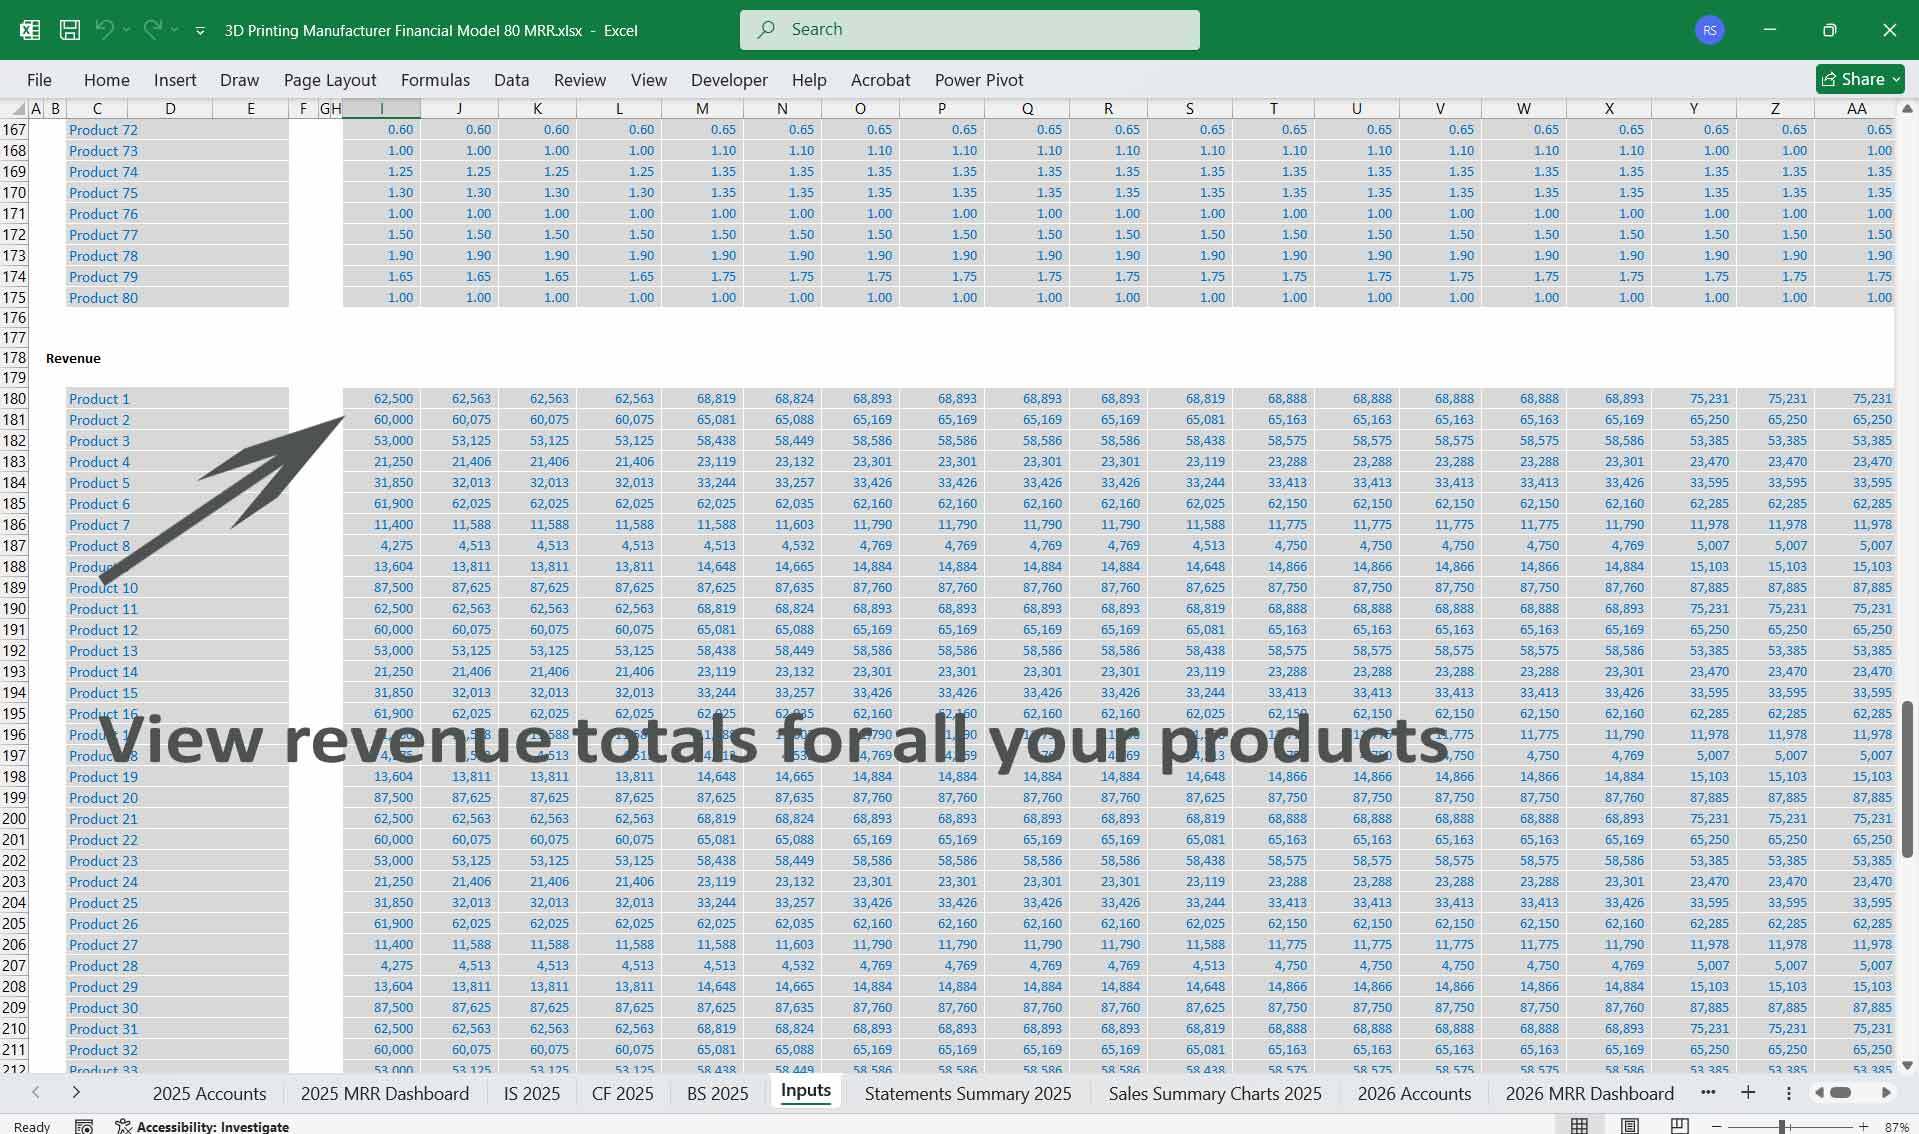
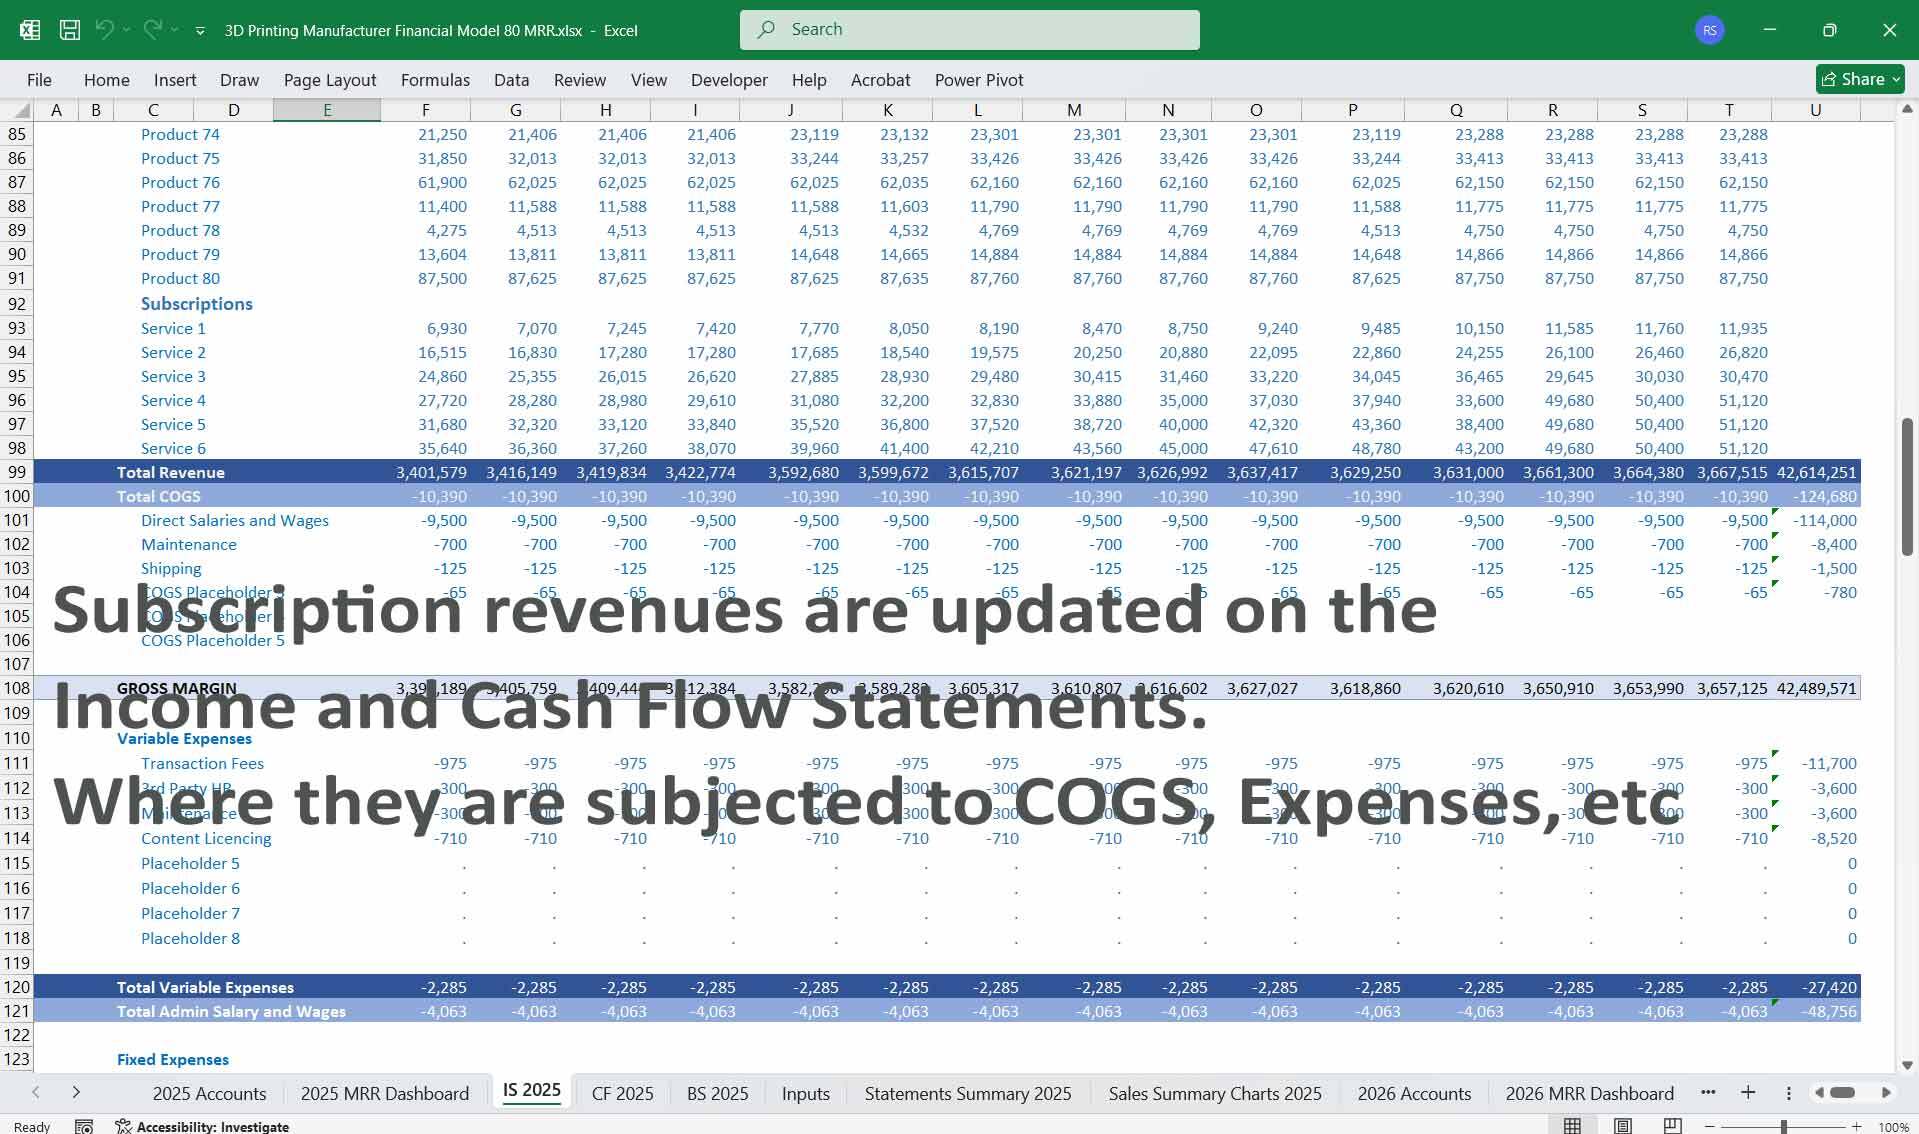
1. Income StatementRevenue Streams
Focus on diverse industries and offering specialized, high-value components.
Financial Models for a 3D Printing Manufacturer (Additive Mfg)This detailed 5-year 3 3-statement financial model is tailored for a 3D Printing (Additive Mfg) Manufacturer, which creates precision-engineered parts for industries like aerospace, automotive, healthcare, and electronics. The models encompass the Income Statement, Cash Flow Statement, and Balance Sheet, with segmented projections for 80-product lines, along with 6-Tier Subscription aimed at offering specialized services.
1. Income StatementRevenue Streams
- Component Sales:
- Sales of 3D-manufactured parts are segmented into custom and standard product categories.
- Custom: High-margin niche products for bespoke client requirements.
- Standard: Regular production parts for repeat orders (e.g., gears, brackets).
- Sales of 3D-manufactured parts are segmented into custom and standard product categories.
- Recurring Services Revenue:
- Maintenance contracts, calibration of 3D Additive machines, and part replacements.
- Tiered subscription revenue for design optimization and supply chain integration.
- Tooling & Setup Fees:
- One-time charges for creating molds, dies, and jigs are required for custom designs.
- After-Sales Support:
- Revenue from servicing 3D-developed parts and selling add-ons.
- COGS:
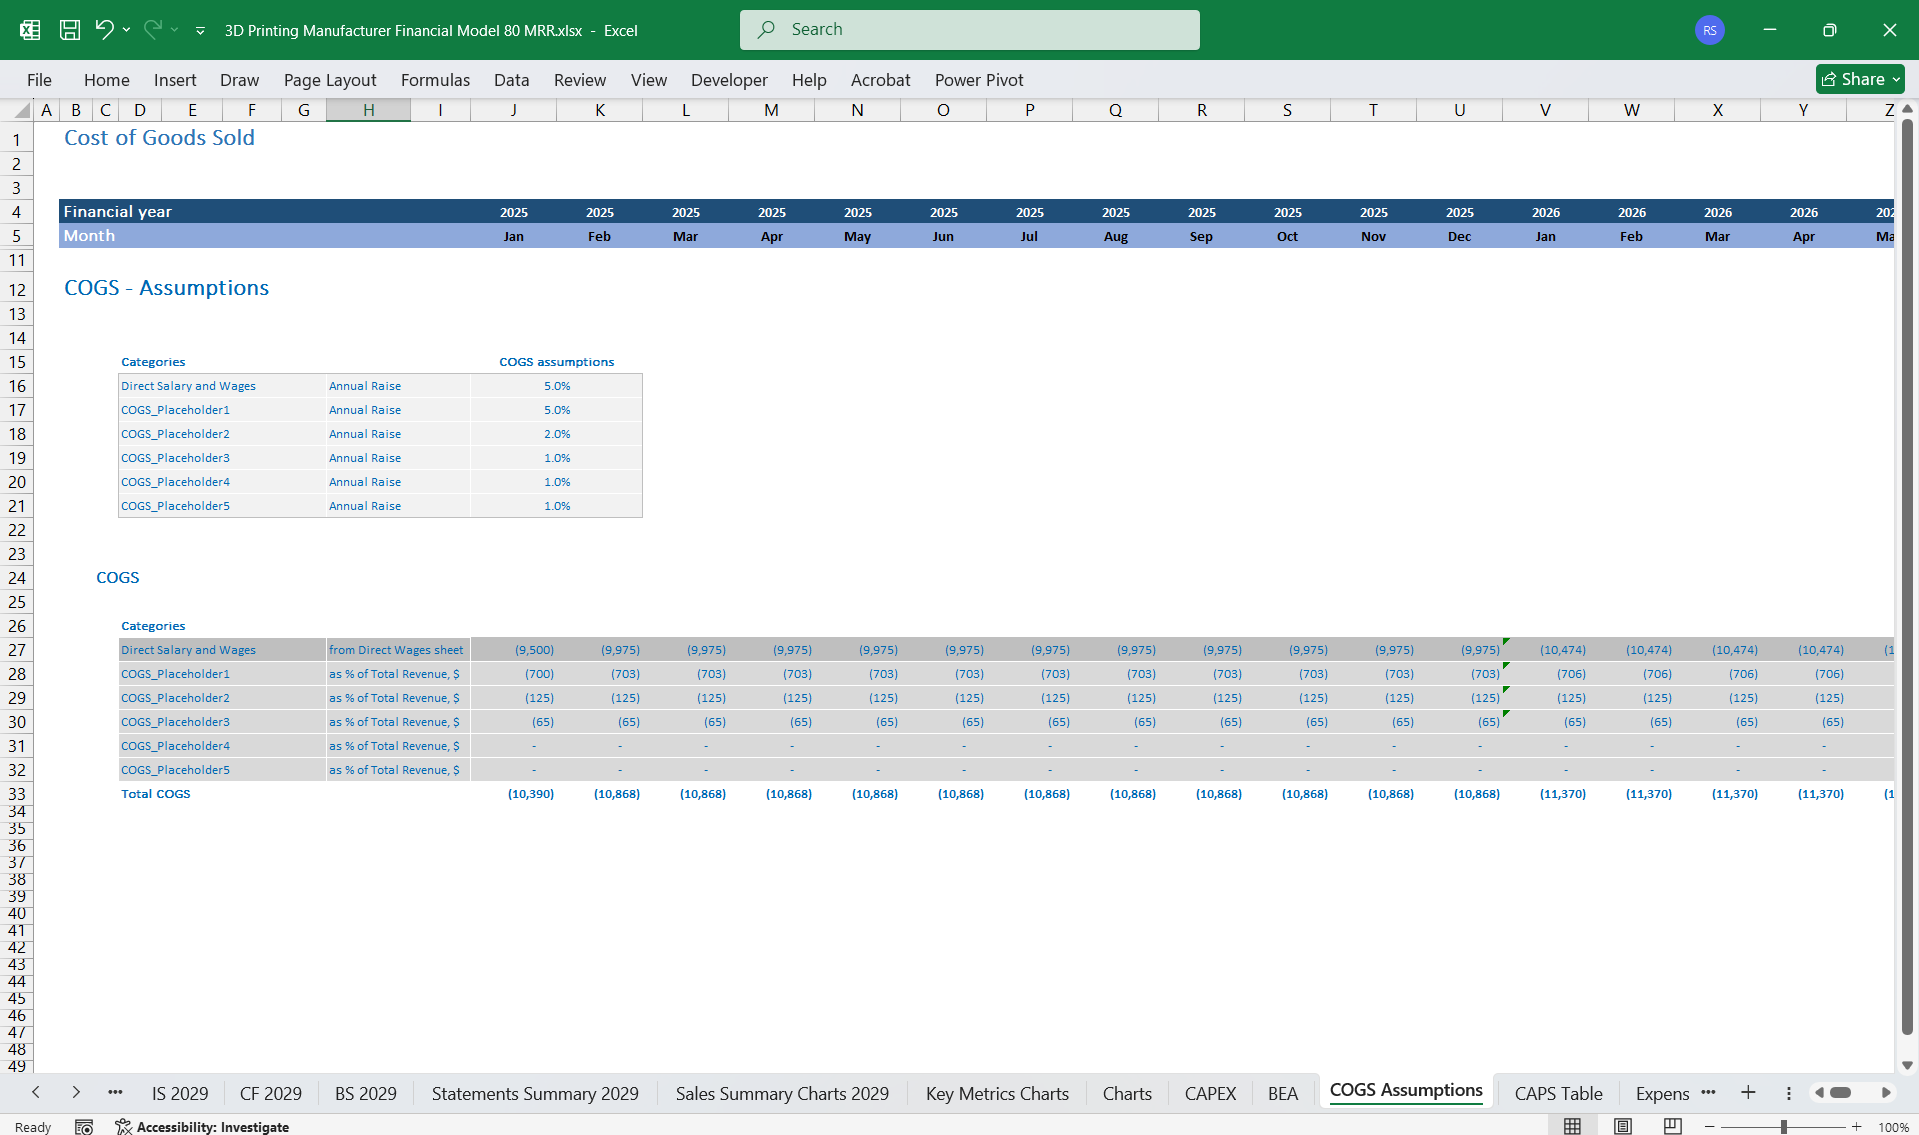
- Raw Materials: Metal alloys, plastics, composites used in manufacturing.
- Direct Labor: Skilled machinists and machine operators.
- Overheads: Depreciation of 3D printing machines, utility costs, and maintenance.
- Operating Expenses:
- R&D: Development of more efficient manufacturing techniques.
- Sales & Marketing: Promoting services to industries and maintaining client relationships.
- Administrative: Salaries, office expenses, and ERP software.
- Other Expenses:
- Regulatory and compliance costs for different industries (ISO certifications).
- Gross Profit: Revenue – COGS.
- EBITDA: Gross Profit – Operating Expenses.
- Net Income: EBITDA – Taxes – Interest.
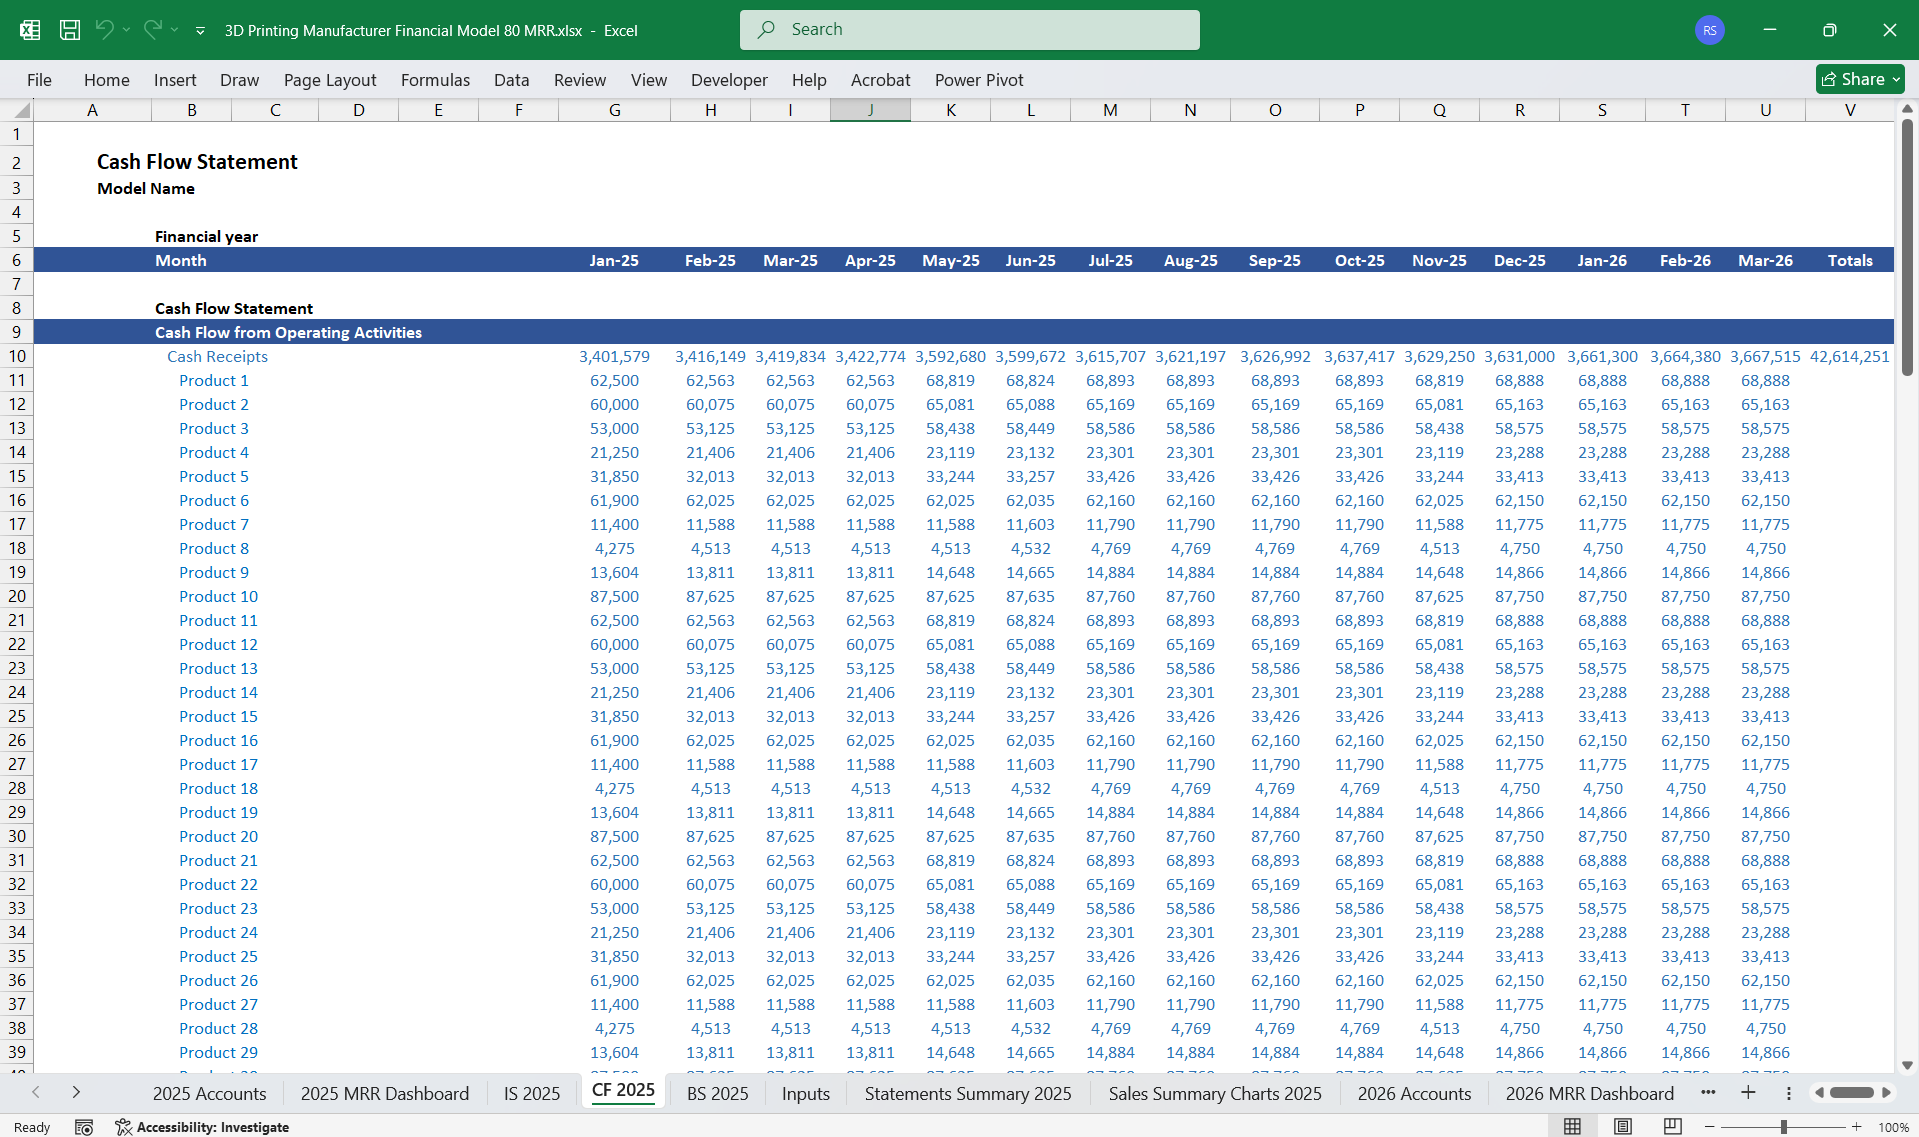
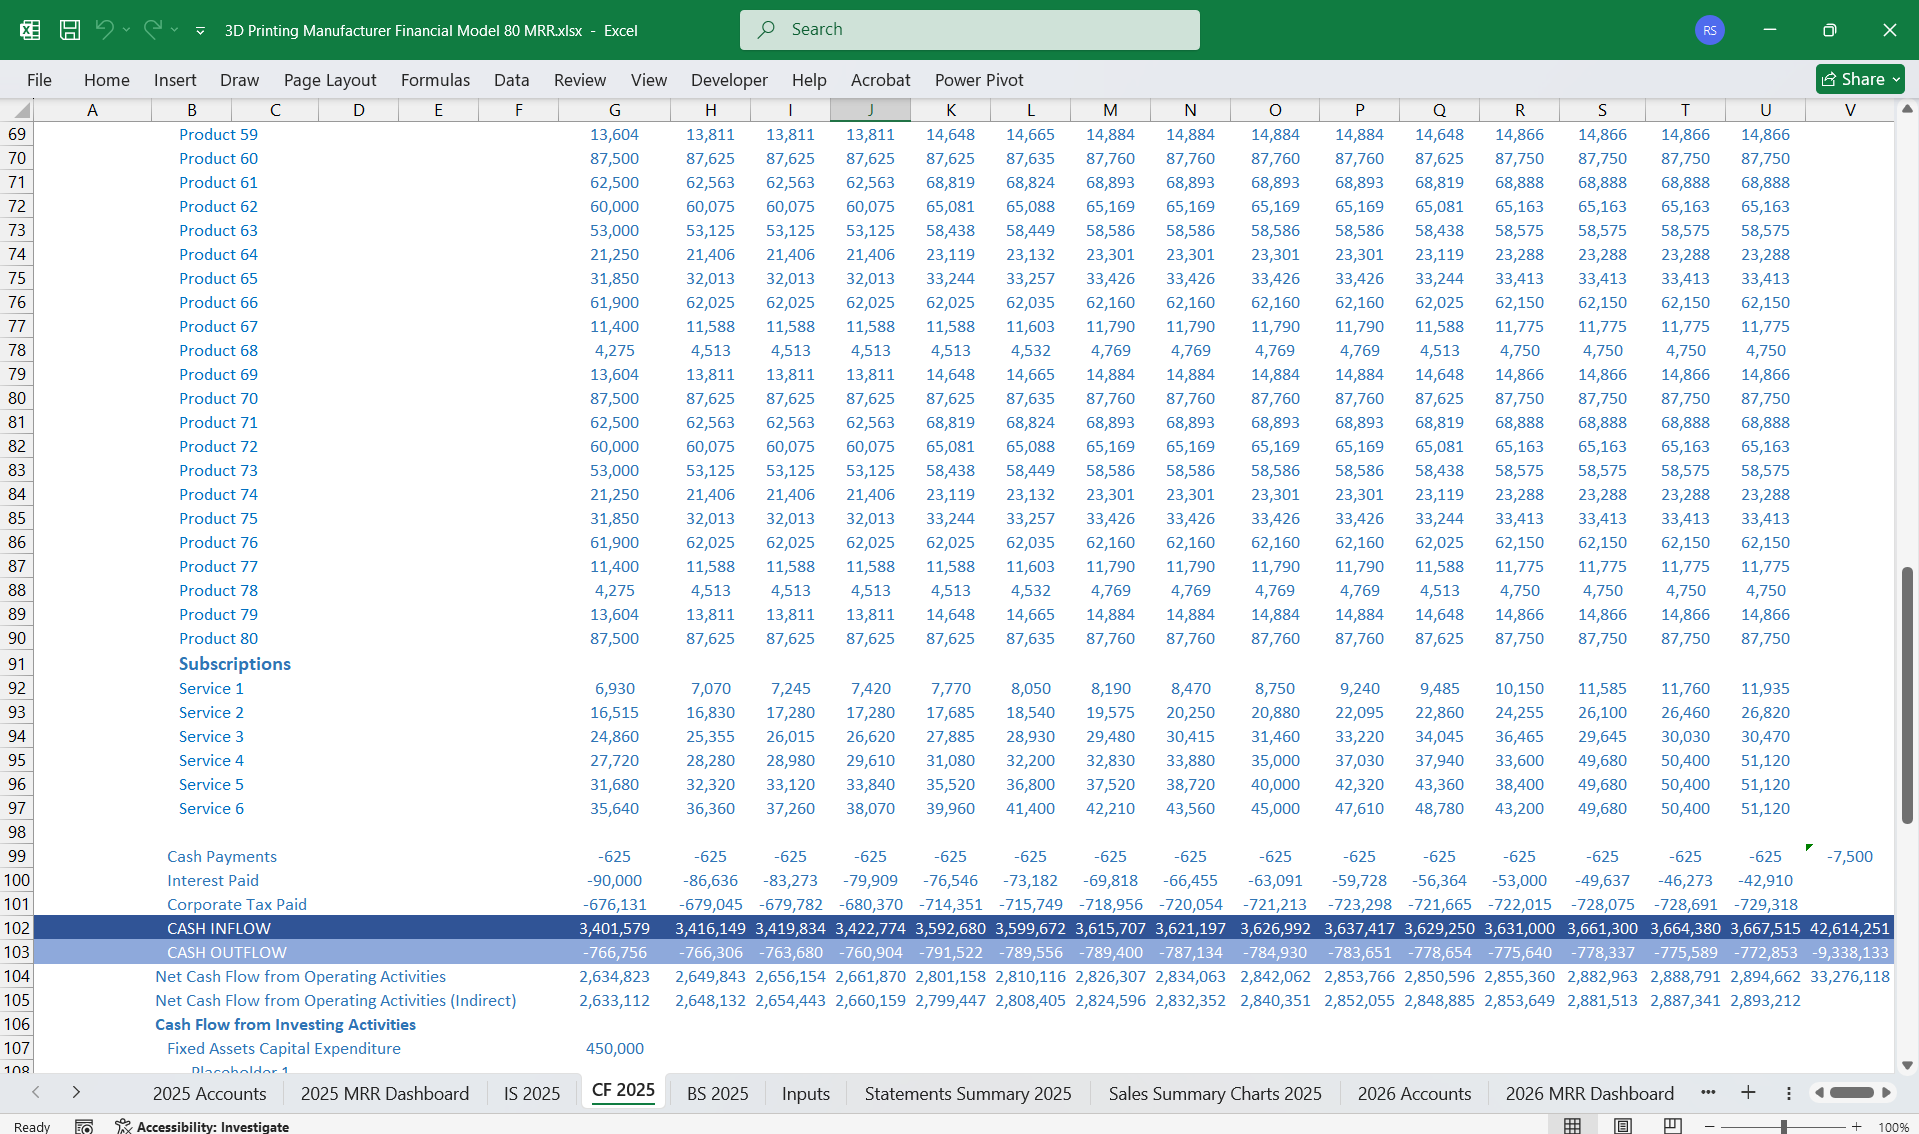
- Inflows:
- Payments received for 3D products and subscription services.
- Advance payments for tooling and custom jobs.
- Regular recurring revenue from Tier 6 subscriptions.
- Outflows:
- Raw material procurement and supplier payments.
- Wages for machinists, designers, and administrative staff.
- Overhead payments (utilities, machine maintenance, and insurance).
- Inflows:
- Disposal of old machinery or surplus raw material inventory.
- Outflows:
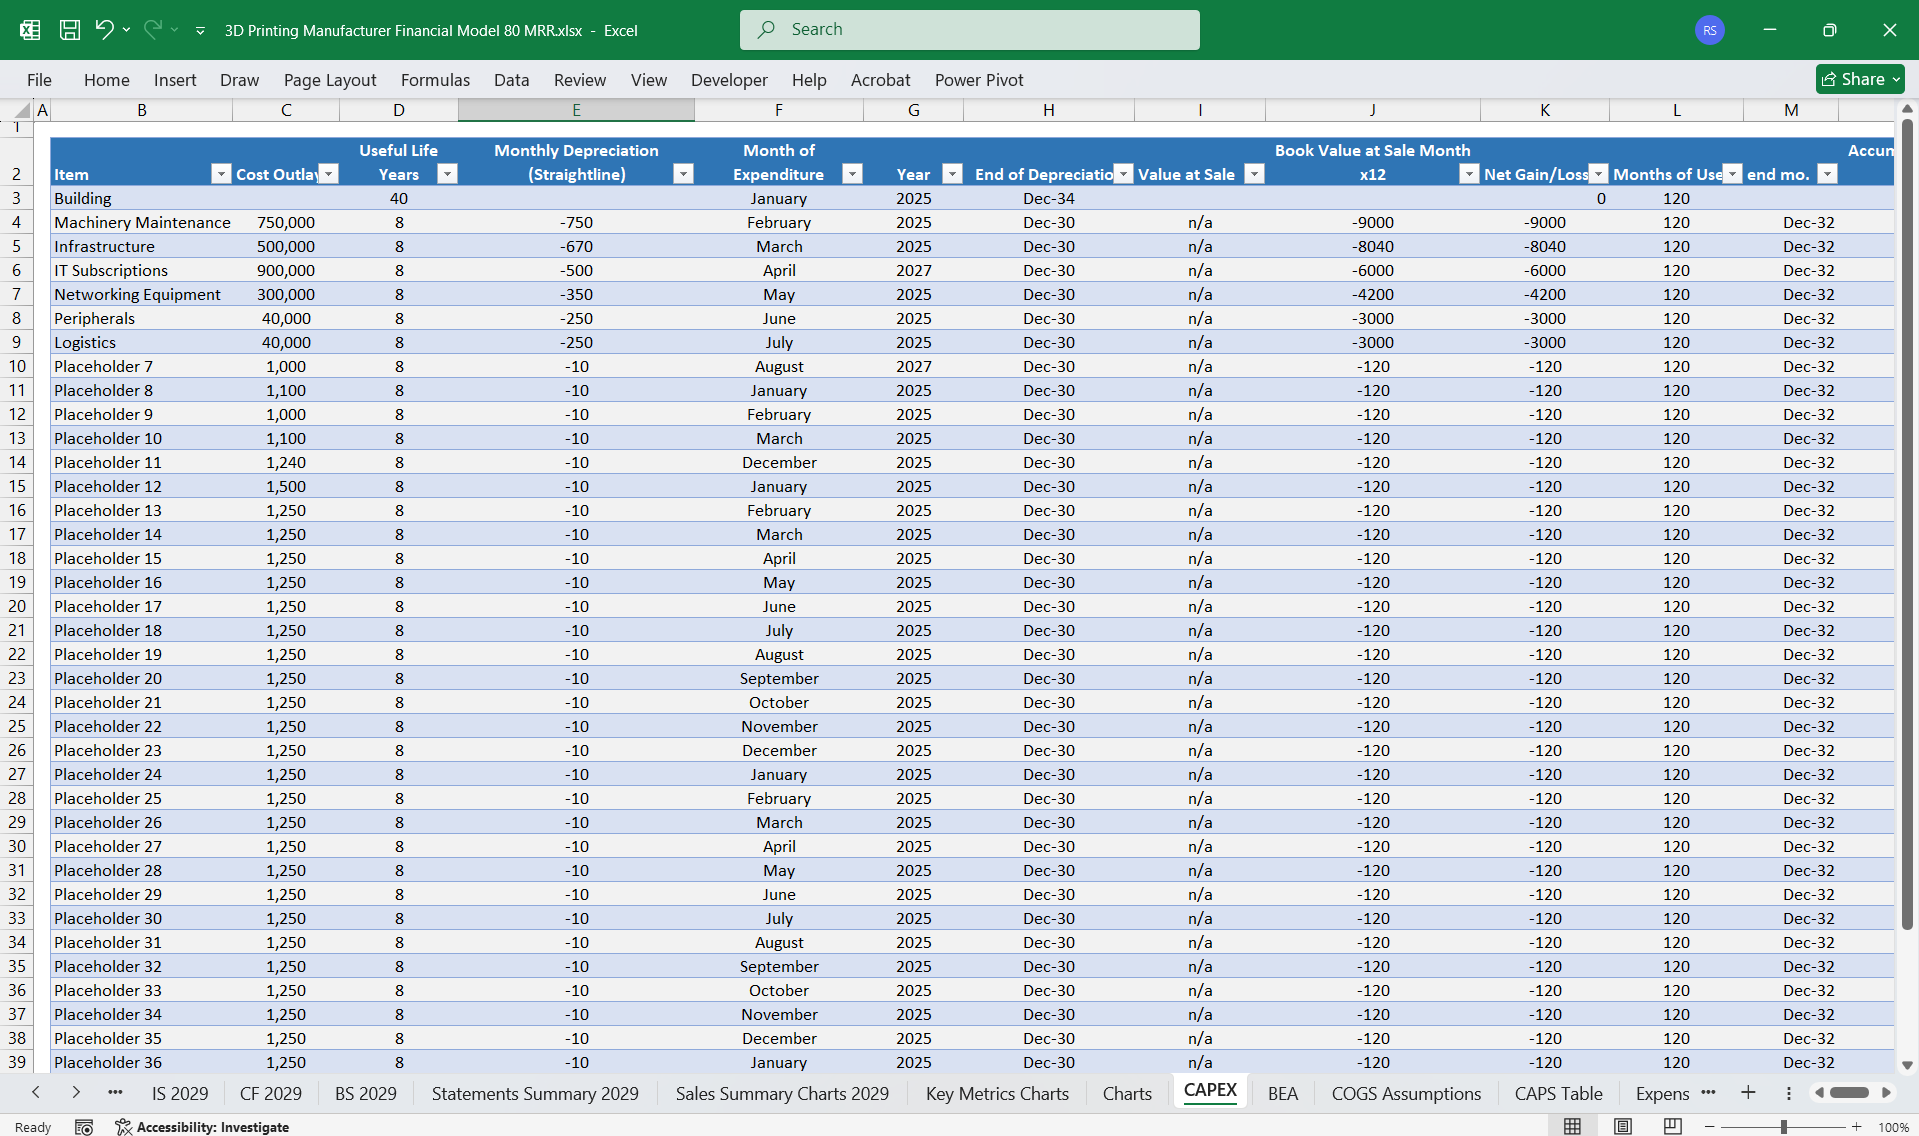
- Purchases of new 3D printing machines for expanded product capacity.
- Development of proprietary 3D software for faster production.
- Inflows:
- Equity injections for capacity expansion.
- Debt financing for printing line upgrades.
- Outflows:
- Loan repayments.
- Dividend payments.
- Free Cash Flow (FCF): Operating Cash Flow – Capital Expenditures.
- Operating Cash Conversion: Measures the efficiency of turning revenue into usable cash.
- Current Assets:
- Cash reserves for operational continuity.
- Accounts receivable from industrial clients.
- Inventory of raw materials, semi-finished goods, and finished products.
- Non-Current Assets:
- 3D Printing machines, molds, and tooling setups.
- Intangible assets like software licenses for programming.
- Current Liabilities:
- Payables to suppliers.
- Accrued expenses for wages, utilities, and deferred subscriptions.
- Non-Current Liabilities:
- Long-term loans for expansion and machine upgrades.
- Retained earnings are reinvested into growth.
- Share capital raised for technology and product diversification.
Focus on diverse industries and offering specialized, high-value components.
- Revenue Generation:
- Broad industry appeal, including aerospace and healthcare, requires precision and innovation.
- High-margin products, e.g., surgical instruments, and aerospace-grade parts.
- Cost Structure:
- Increased R&D and quality control costs to meet regulatory standards.
- Higher inventory management complexity and logistical expenses.
- Target Audience:
- Large-scale industrial manufacturers, export markets, and niche sectors.
- Margin Probability:
- Gross Margin: ~45-55%.
- Net Margin: ~15-20% from economies of scale and premium pricing.
- Tier 1 (Basic):
- Access to printing performance metrics.
- CAD file repository for downloaded templates.
- Tier 2 (Standard):
- Includes Basic features.
- Periodic machine calibration and setup reports.
- Tier 3 (Professional):
- Includes Standard features.
- Advanced production efficiency reports and tooling suggestions.
- Tier 4 (Premium):
- Real-time production monitoring tools for client-specific jobs.
- Custom reports for regulatory compliance tracking.
- Tier 5 (Enterprise):
- Includes Premium features.
- Supply chain integration and bulk discounts on custom designs.
- Tier 6 (Custom):
- Fully bespoke services: Dedicated account manager, R&D collaboration, and machine performance optimization.
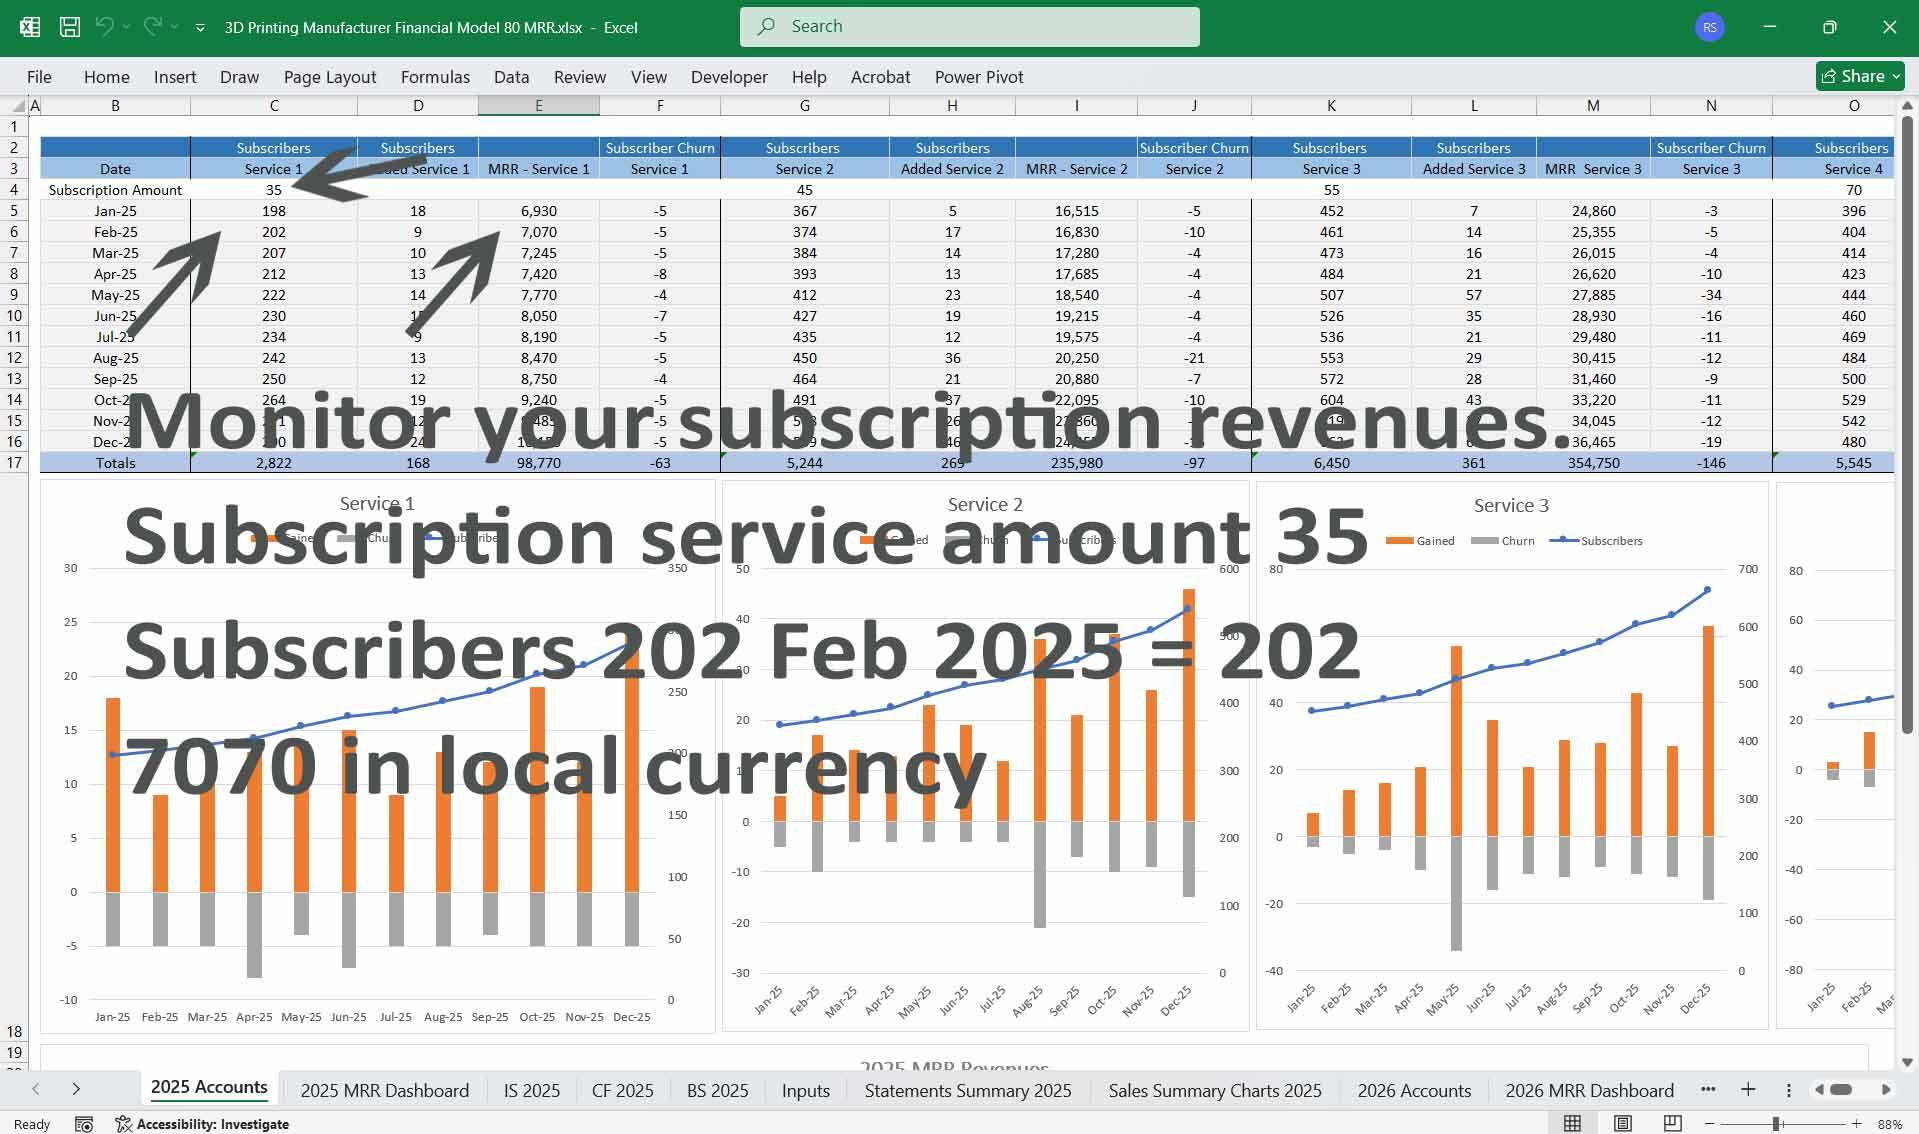
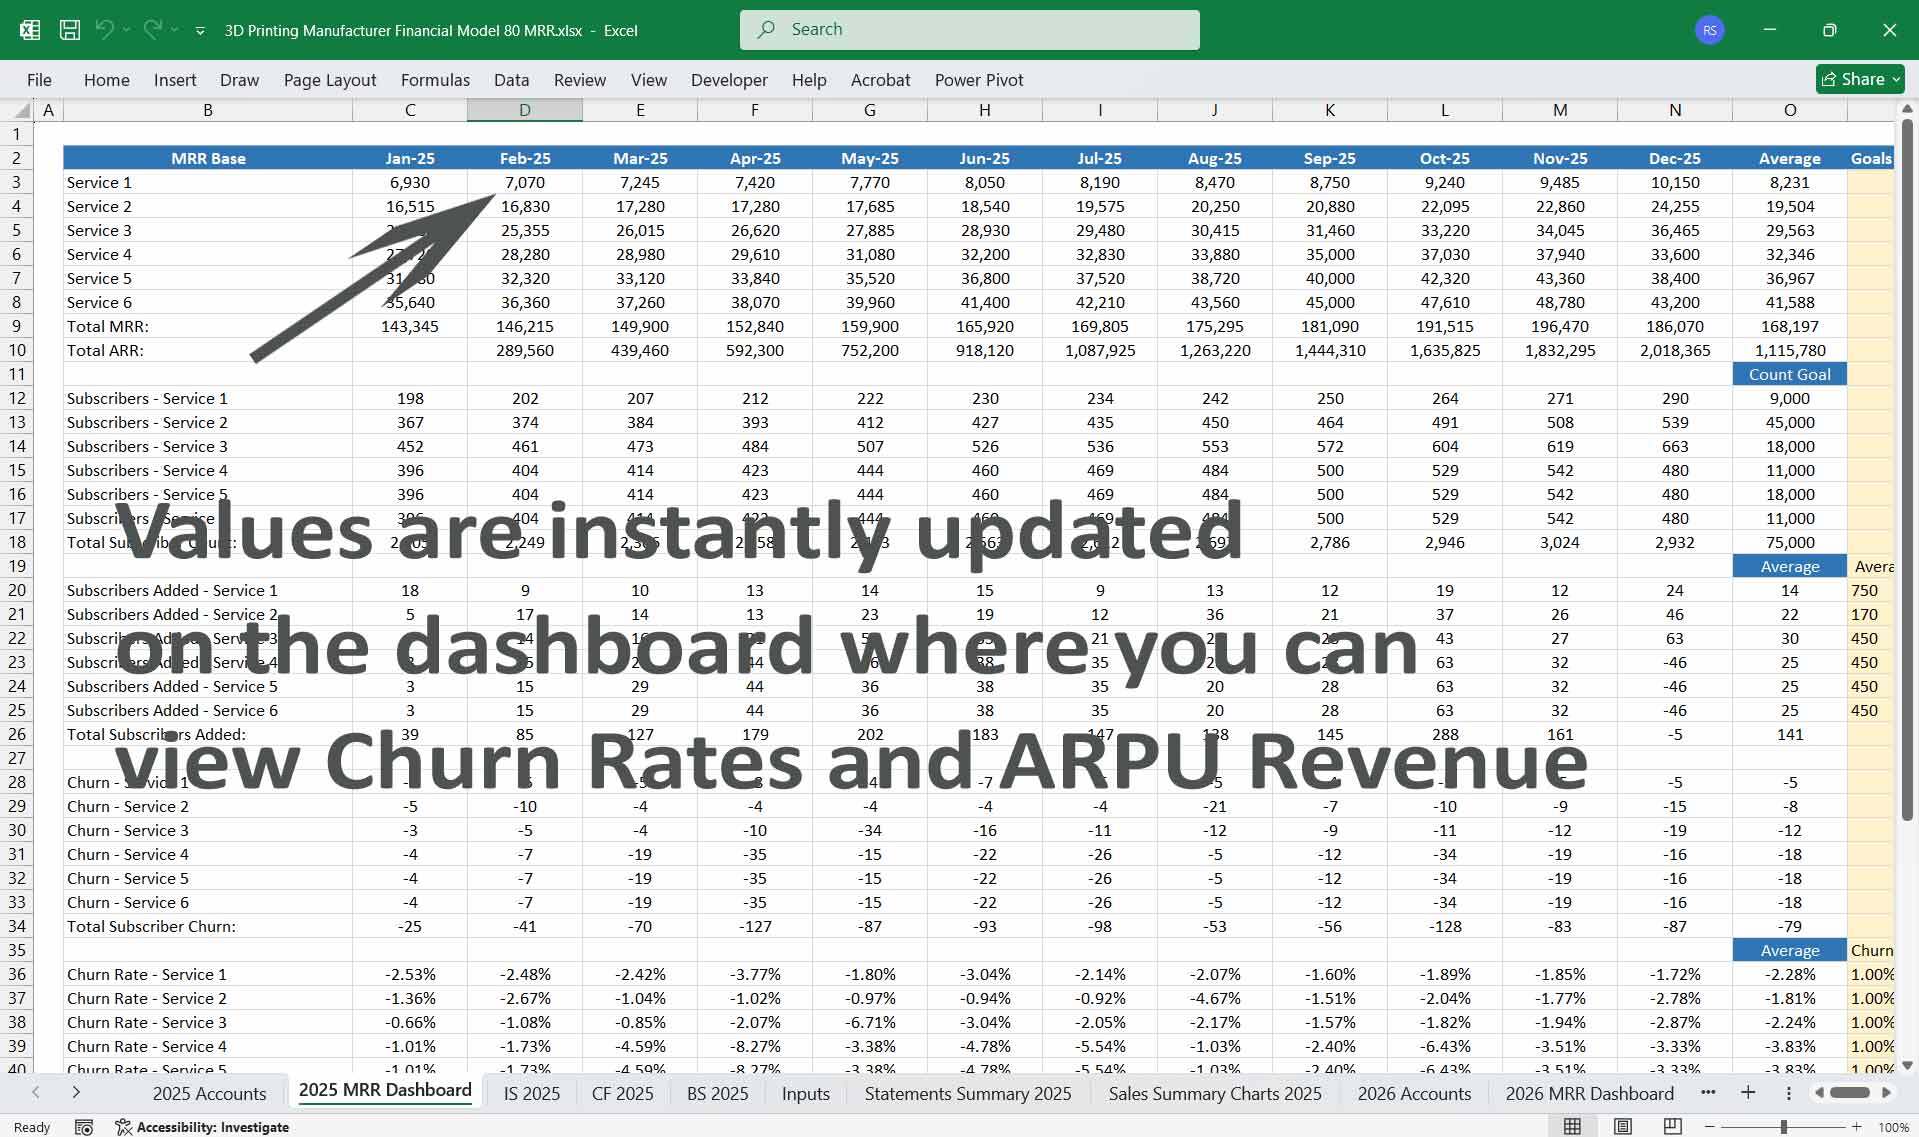
- MRR = Monthly Revenue from Subscriptions.
- ARR = MRR × 12.
- LTV = Average Revenue per User × Customer Lifespan.
- Churn rate analysis by tier.
- Product Metrics:
- Revenue per product line (80-line comparison).
- Average cost-per-unit analysis.
- Subscription Metrics:
- Revenue growth by tier adoption rate.
- Average subscription upgrade frequency.
- Profitability Metrics:
- Contribution margin by subscription tier.
- 3D Additive setup utilization: Jobs completed vs. capacity.
- Operational Metrics:
- On-time delivery rate for parts.
- Inventory turnover ratios.
This Best Practice includes
1 Excel Financial Model
Further information
Provides thorough oversight, tracking, and reporting of 3D Printing Manufacturer finances, including budget utilisation and projections updates.
