Multi Purpose Financial Model
Originally published: 19/10/2024 13:38
Publication number: ELQ-49947-1
View all versions & Certificate
certified

Multi Purpose Financial Model

Multi Purpose Financial Model - an Excel model with a wide range of financial and non financial data.

Description

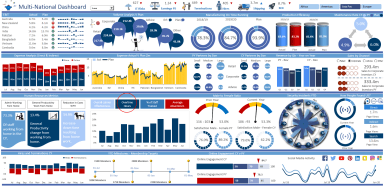
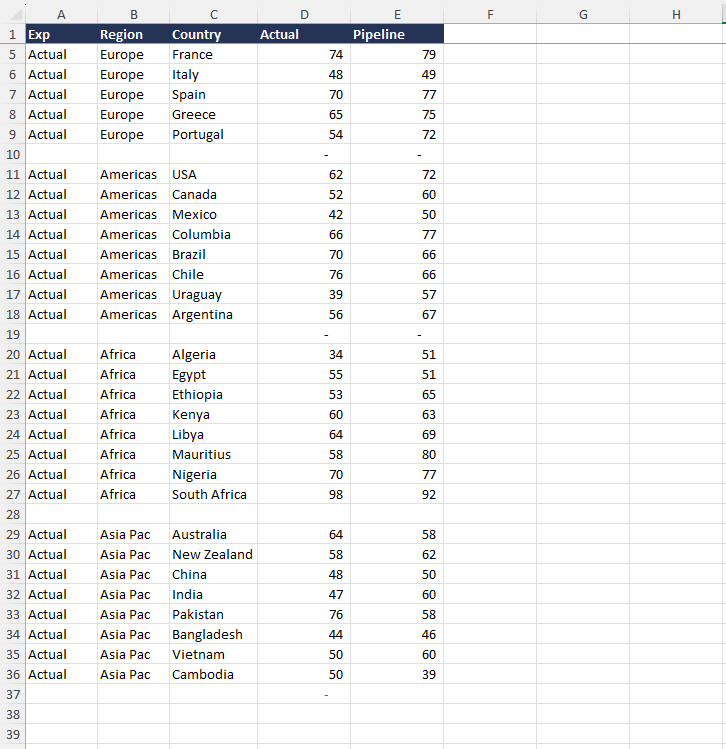
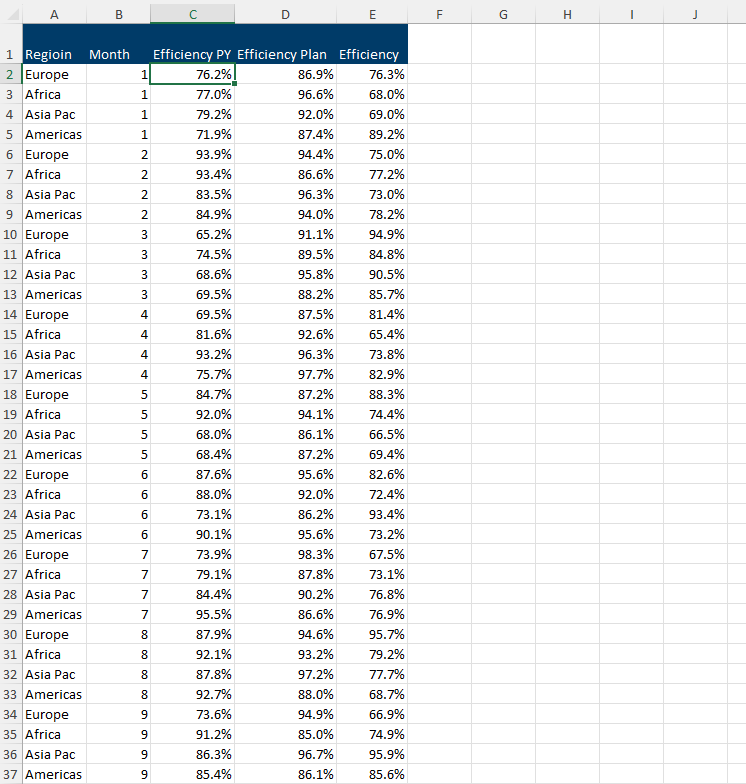
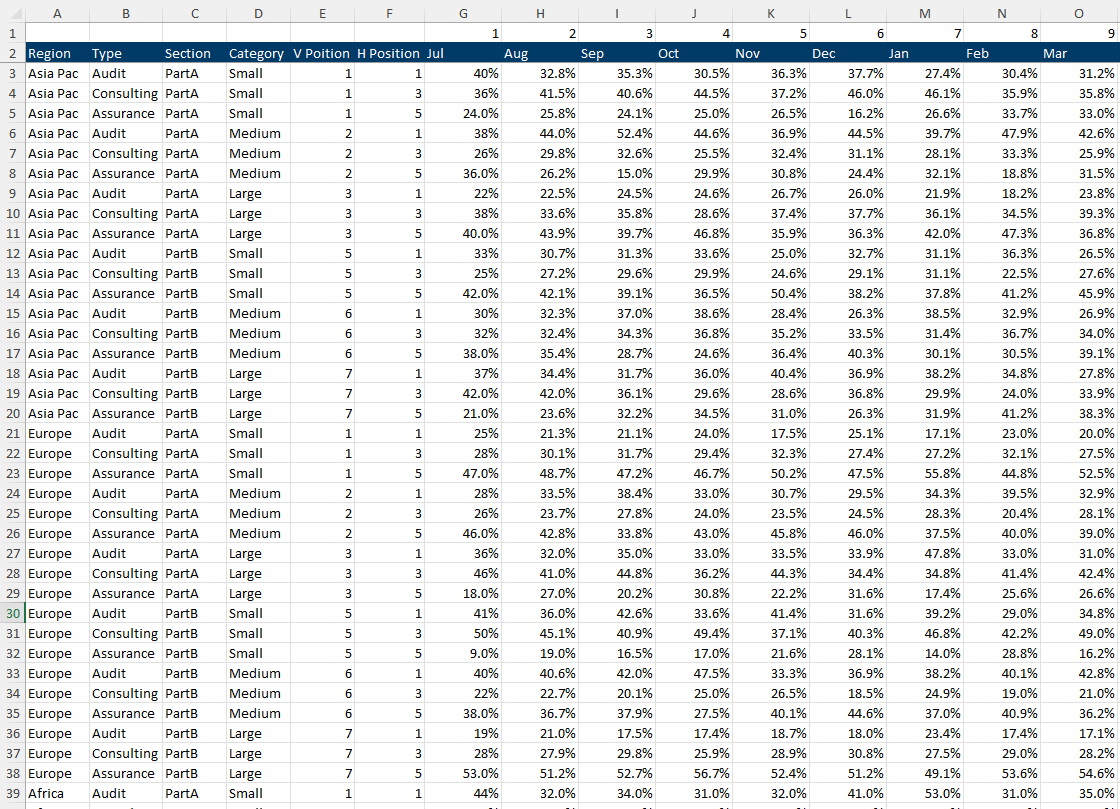
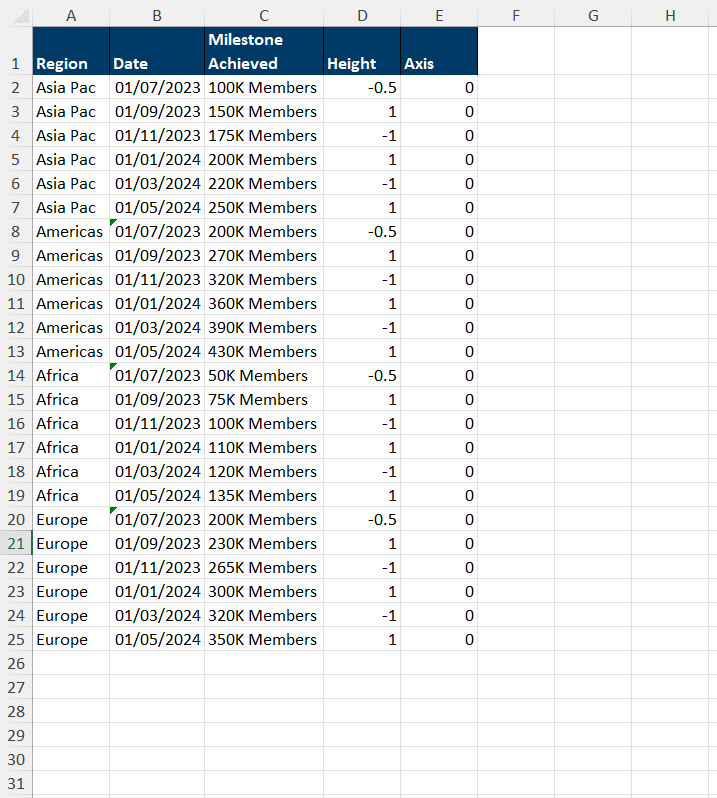
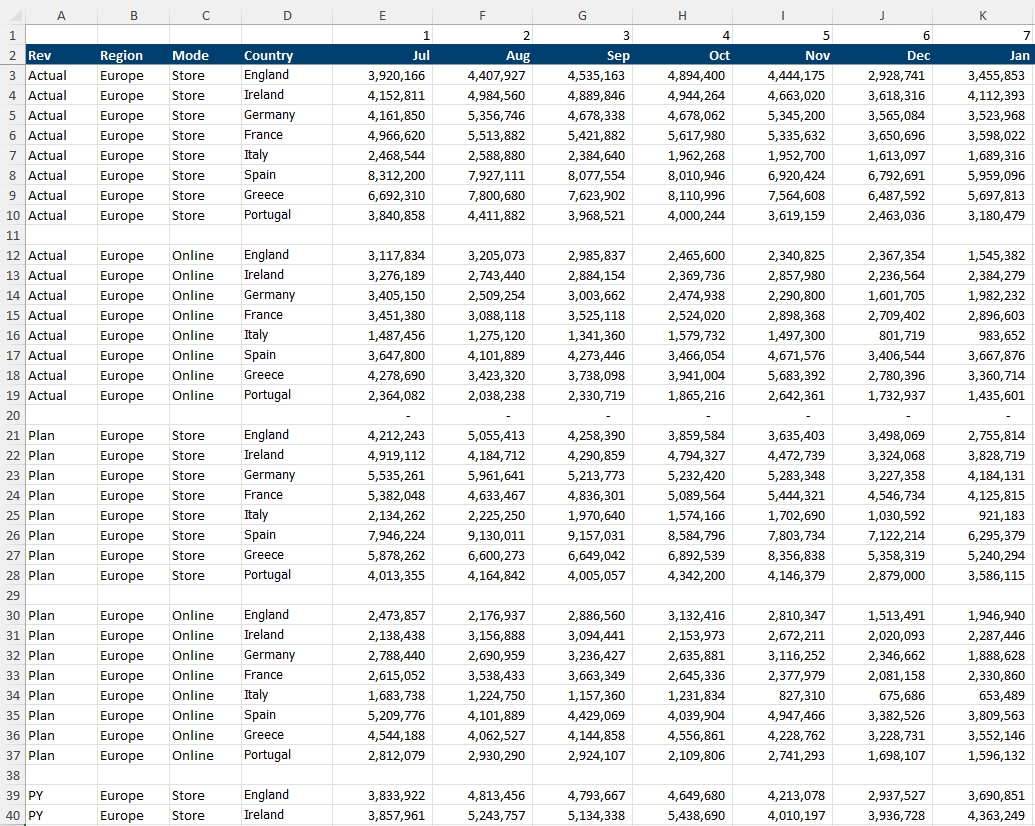
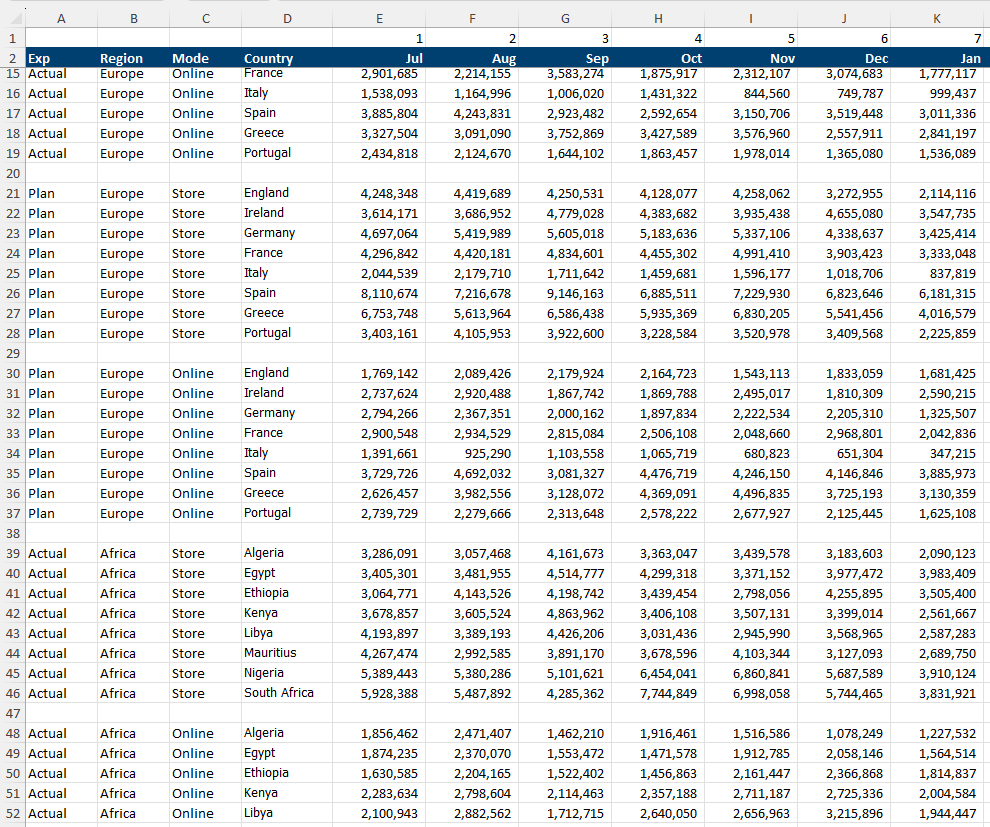
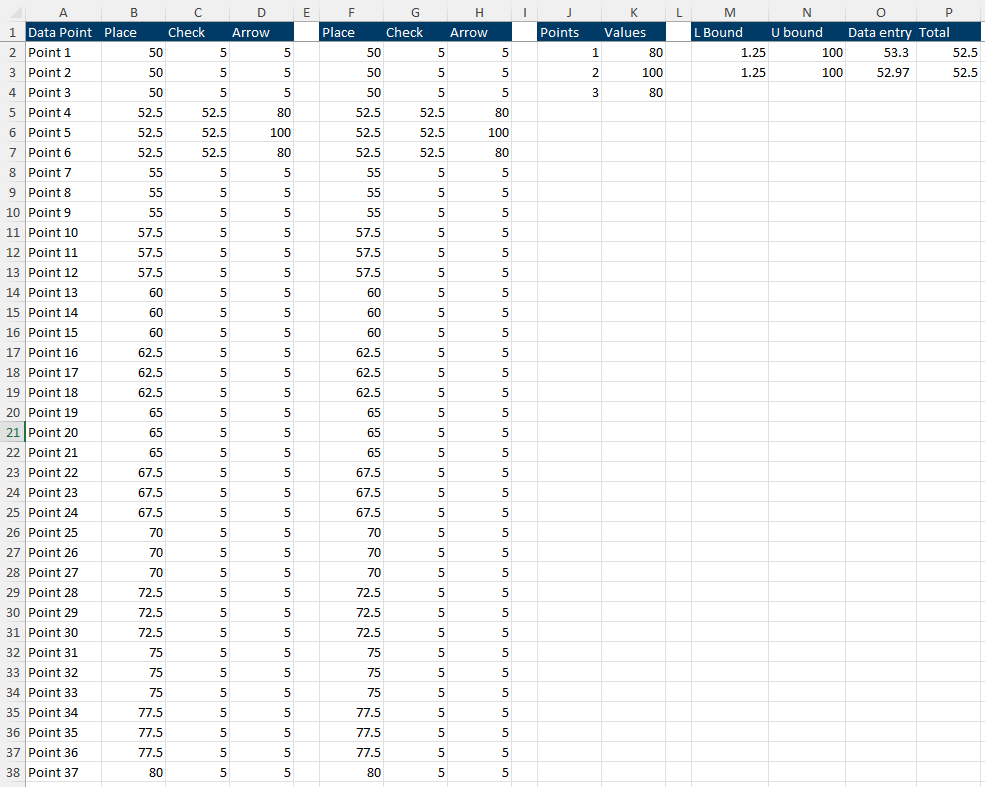
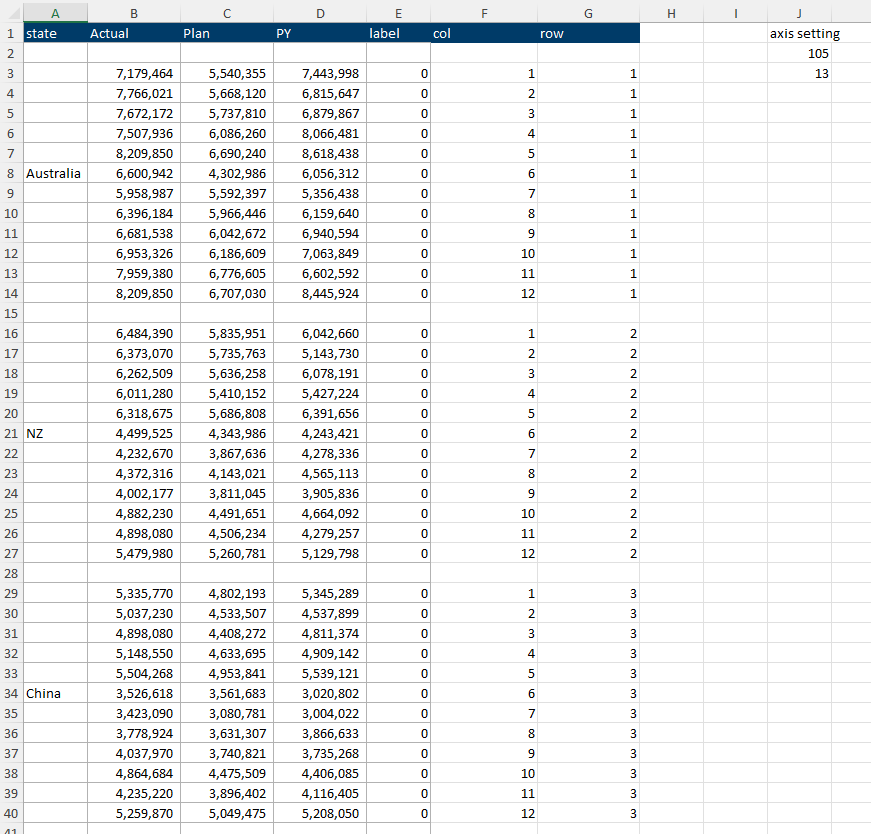
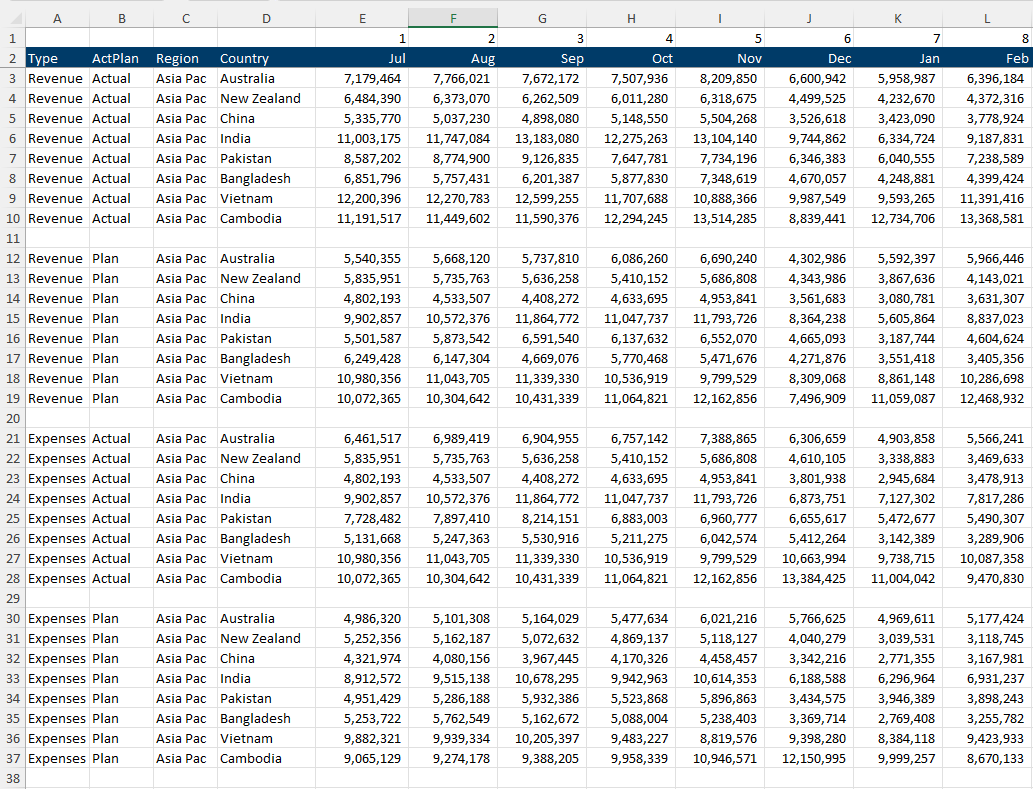
All the charts, fantastic financial modelling layout. Just enter your data into the input pages and the calculations will populate the charts.
Ready-to-use and instantly downloadable, this tool is excellently presented, whilst being clear and easy for the user to manipulate.
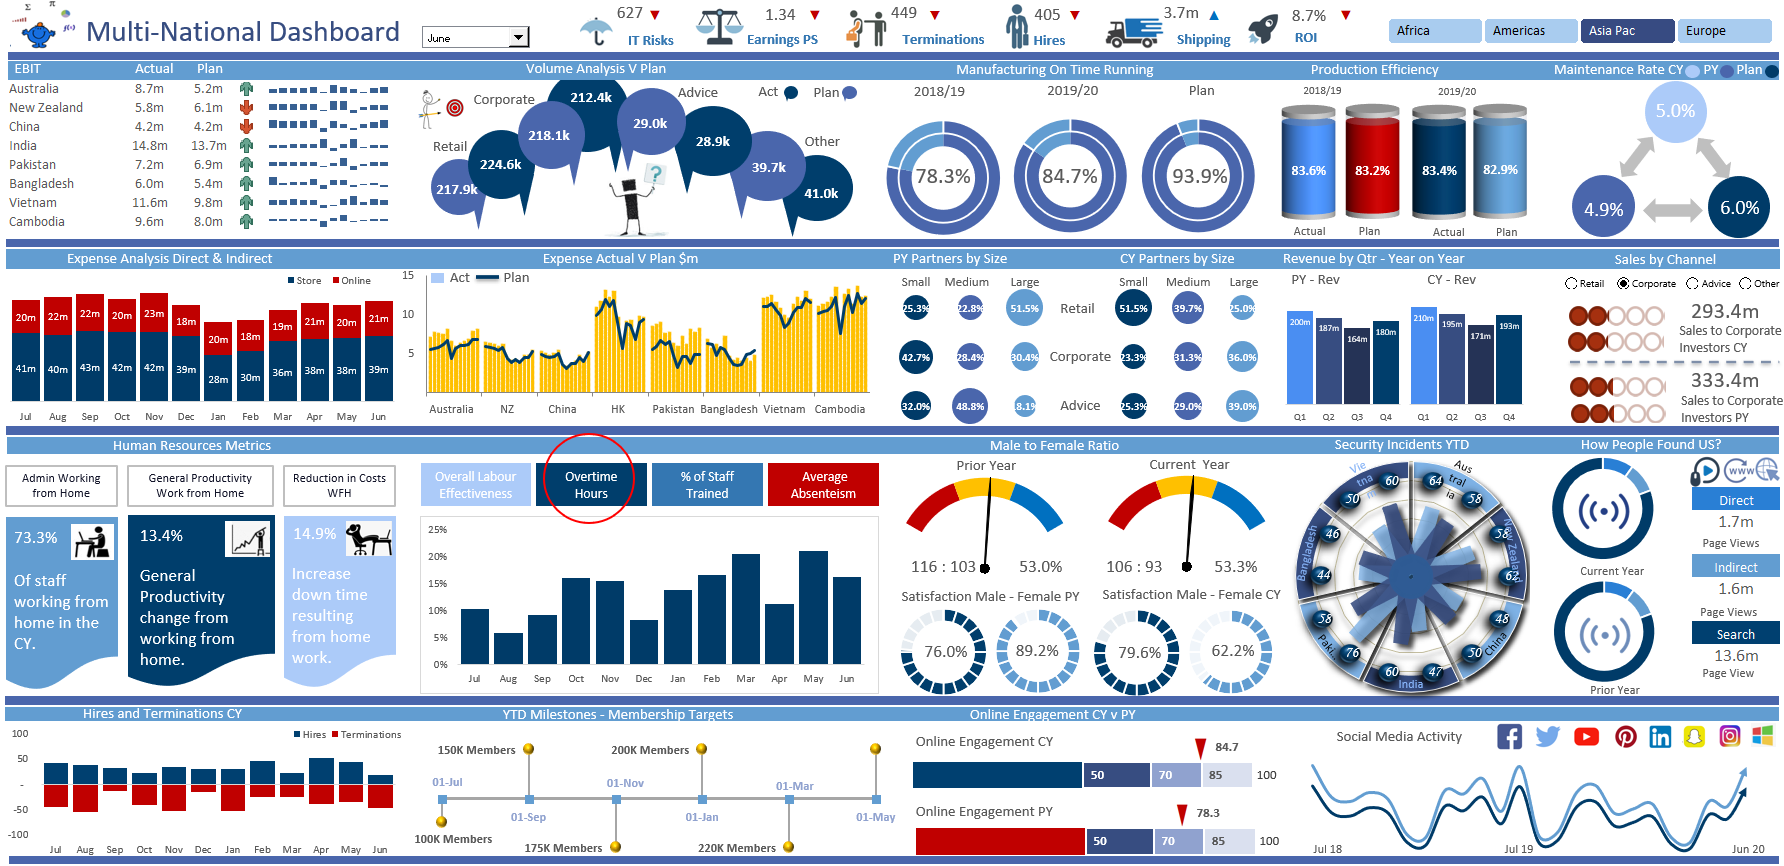
This multi purpose dashboard is an important resource for professionals to monitor and track the strengths and weaknesses of specific department areas, in order to increase performance. Within this tool are a number of key metrics, these include:


- Allocated cost by Department, Actual vs. Plan
- Satisfaction Metrics, including Customer Satisfaction Change Year on Year, and the Staff Satisfaction Change in Time.
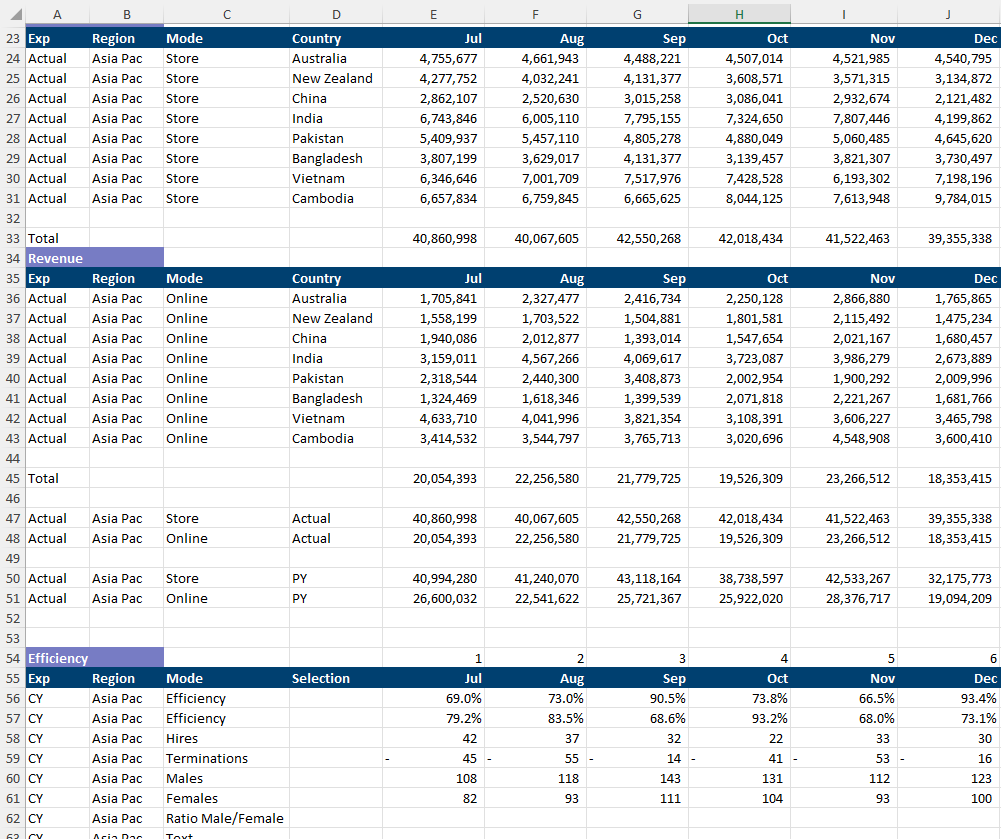
- Hires and Terminations
- Online Engagement
- Cost of Goods Sold (COGS)
- Overtime metrics
- Absenteeism
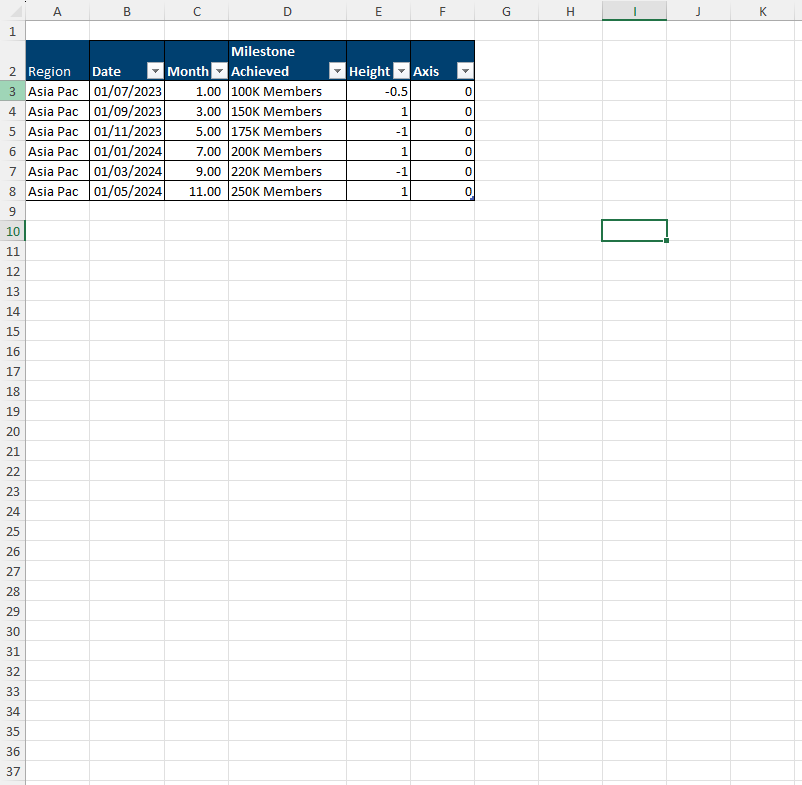
- Other include: Membership targets, Staff Satisfaction, Earnings per share, ROI, IT Risks, Shipping, Staff Productivity, Volume analysis.


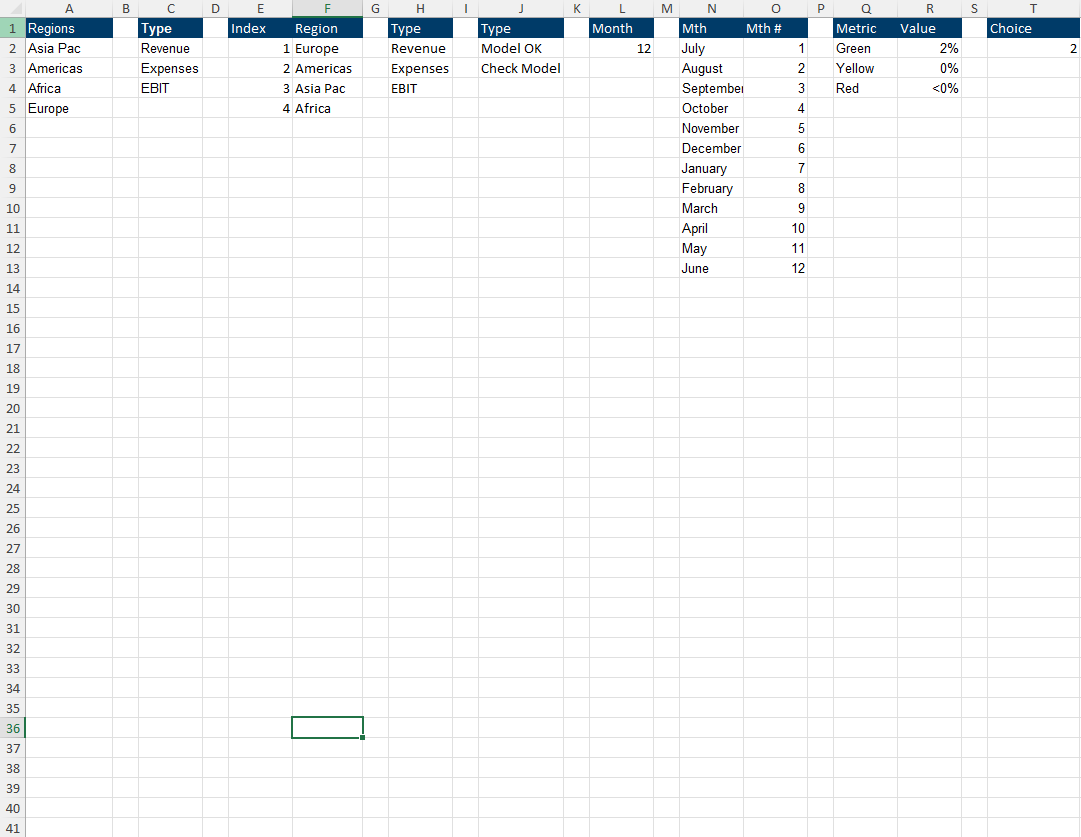
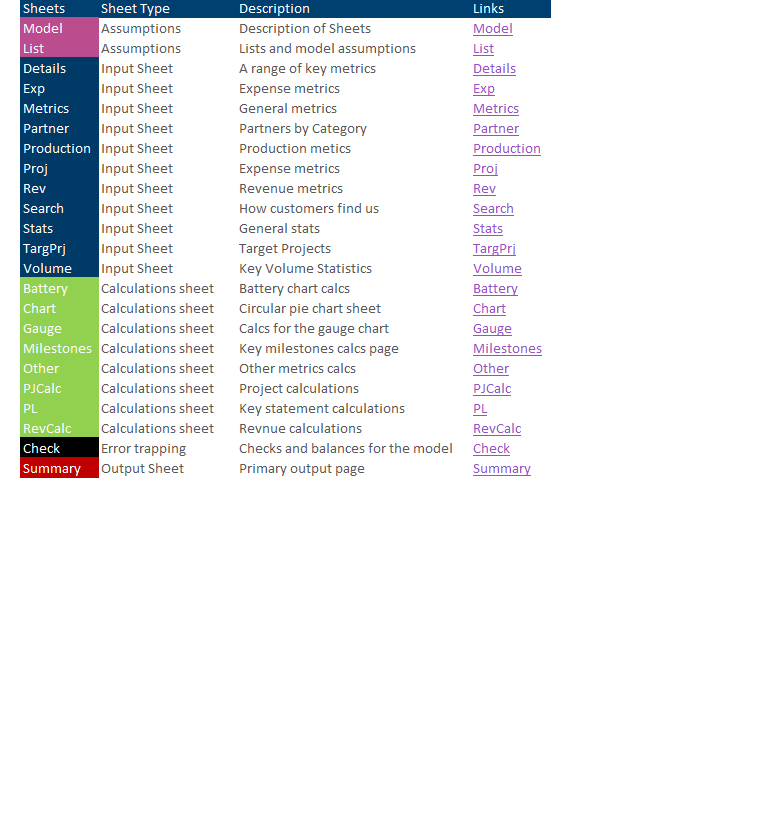
There is a logical progression for the inputting of data in order to best calculate the results of your team. The report is clean and clear with a range of metrics that can be swapped in and out with a range of like or different data to maintain the same look.

If you have any questions regarding this tool, don’t hesitate to reach out by starting a discussion below or private messaging directly through my Eloquens author channel.

This Best Practice includes
1 Excel File, 23 tabs

Acquire business license for $199.00

Add to cart

Add to bookmarks

Discuss

Further information

To give a full service dashboard that is easy to update with multiple metrics

People who are proficient with Excel and know how to update data with fresh data.


0.0 / 5 (0 votes)

please wait...