
Originally published: 29/05/2022 15:29
Last version published: 12/01/2024 16:41
Publication number: ELQ-77498-18
View all versions & Certificate
Last version published: 12/01/2024 16:41
Publication number: ELQ-77498-18
View all versions & Certificate

Project Planning and Portfolio Management Excel Template
It goes beyond being a mere Excel template. It’s A Powerful Tool and Dashboard.
Our online platform provides a wide range of engaging and useful templates that cater to various needs.Follow 38
Description
Project managers are constantly seeking new methods and ideas to enhance the effectiveness of their project management. Their goal is to achieve improved outcomes with less effort and time. In the IT market, there are numerous tools, templates, and software options available for project management, such as the Project Portfolio Dashboard Template Excel.
The Project Portfolio Dashboard Excel Template offers the following features:
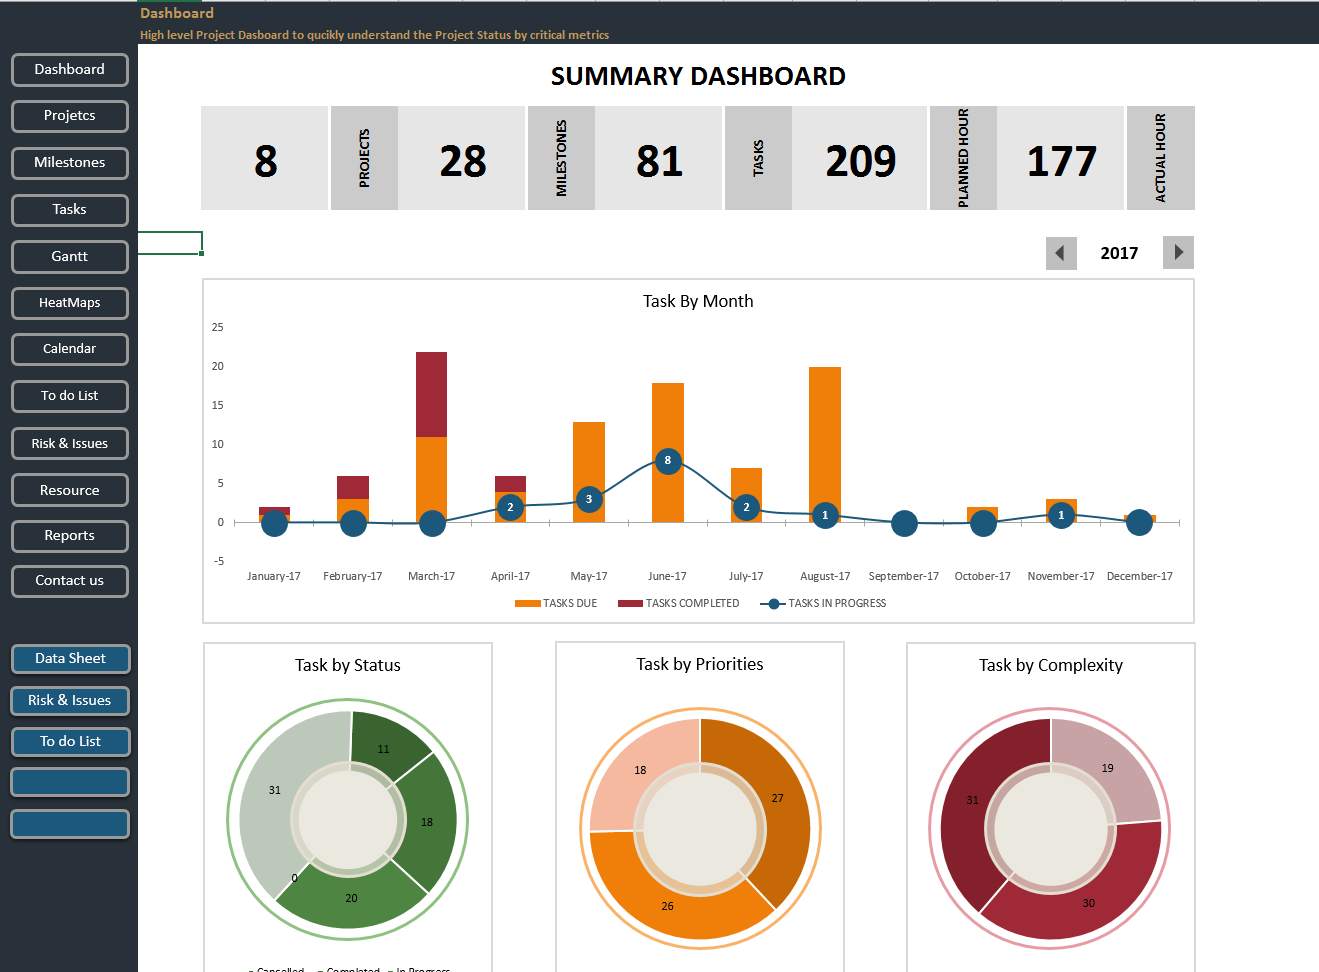
Dashboard:
This section provides a comprehensive overview of multiple projects. It includes the total number of projects, projects currently in progress, and a weekly breakdown of each project's tasks, including due tasks, completed tasks, and tasks in progress. Additionally, it presents milestones, tasks, hours, risks, and graphical representations of project data in charts.
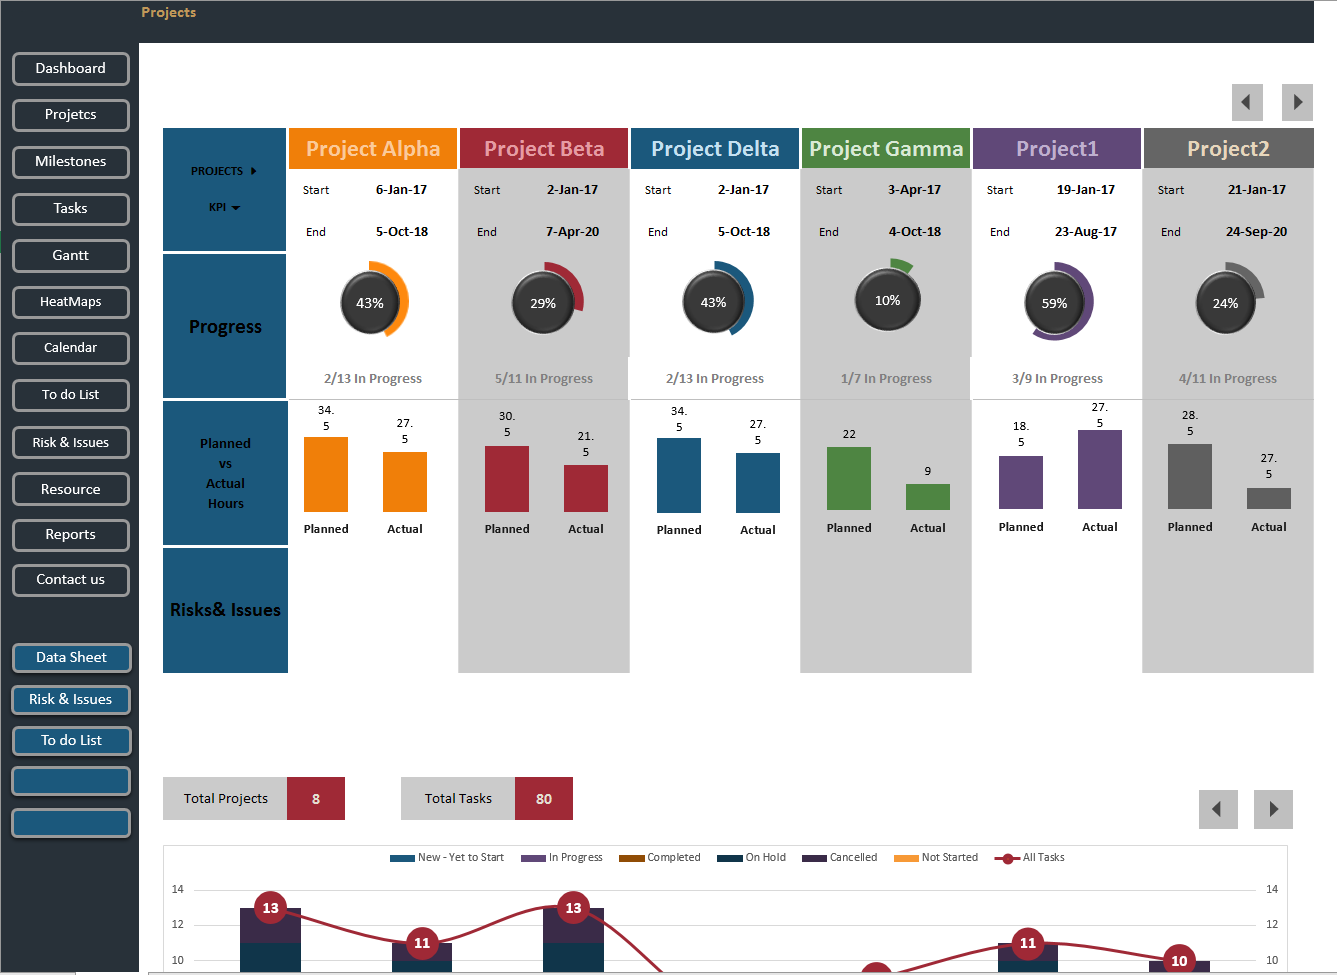
Projects:
In this section, users can monitor the progress of individual projects on a single page, accompanied by key performance indicators (KPIs) for each project. The menu includes sections for problem definition, planning, project development, testing, and project deployment. Users can also access information regarding project start and end dates, planned versus actual hours, risks and issues with their priorities, and graphical charts.
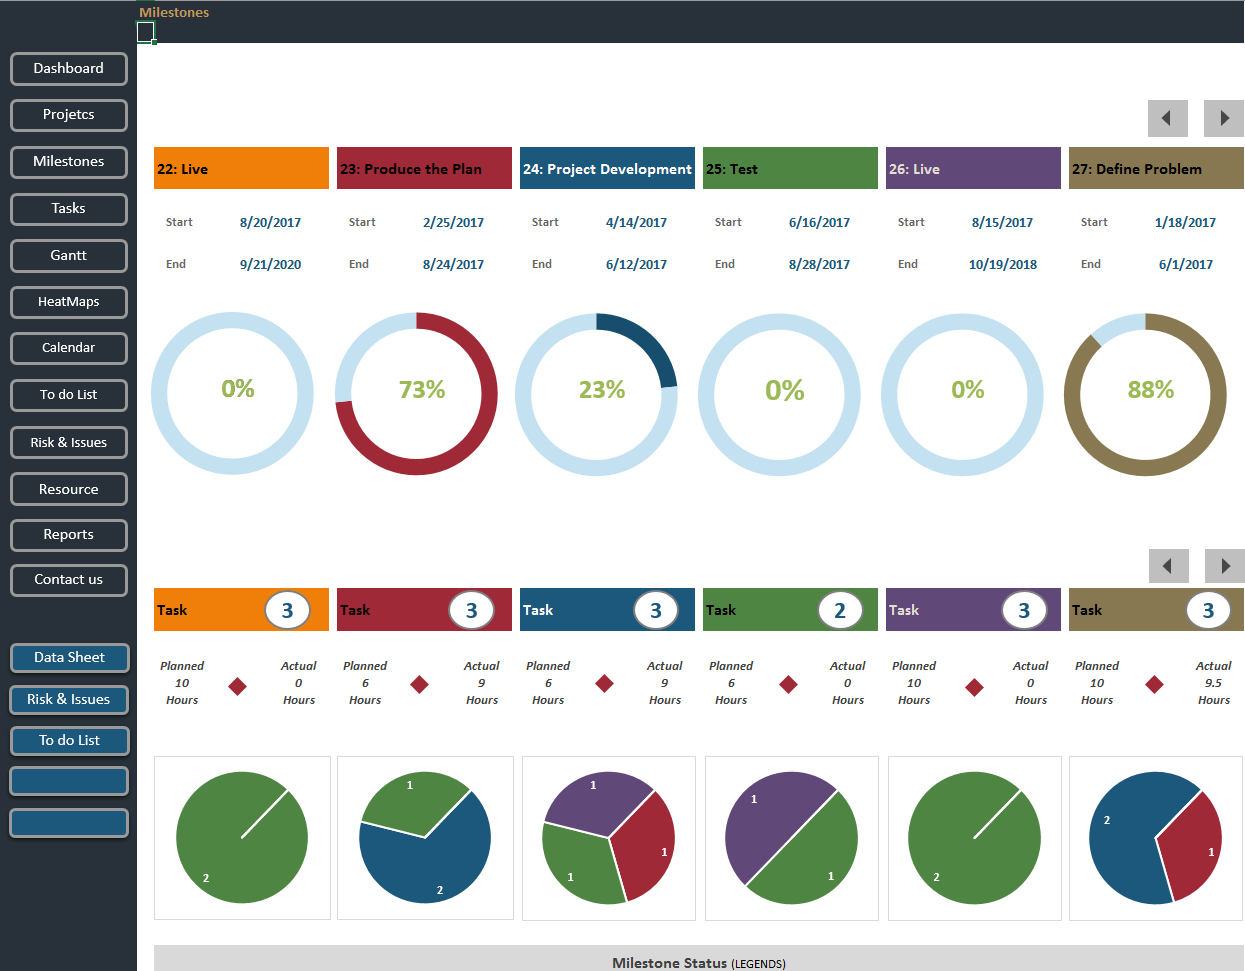
Milestones:
This section allows users to select a specific project and view sub-details such as start and end dates for milestones, total defined hours, and actual hours utilized.
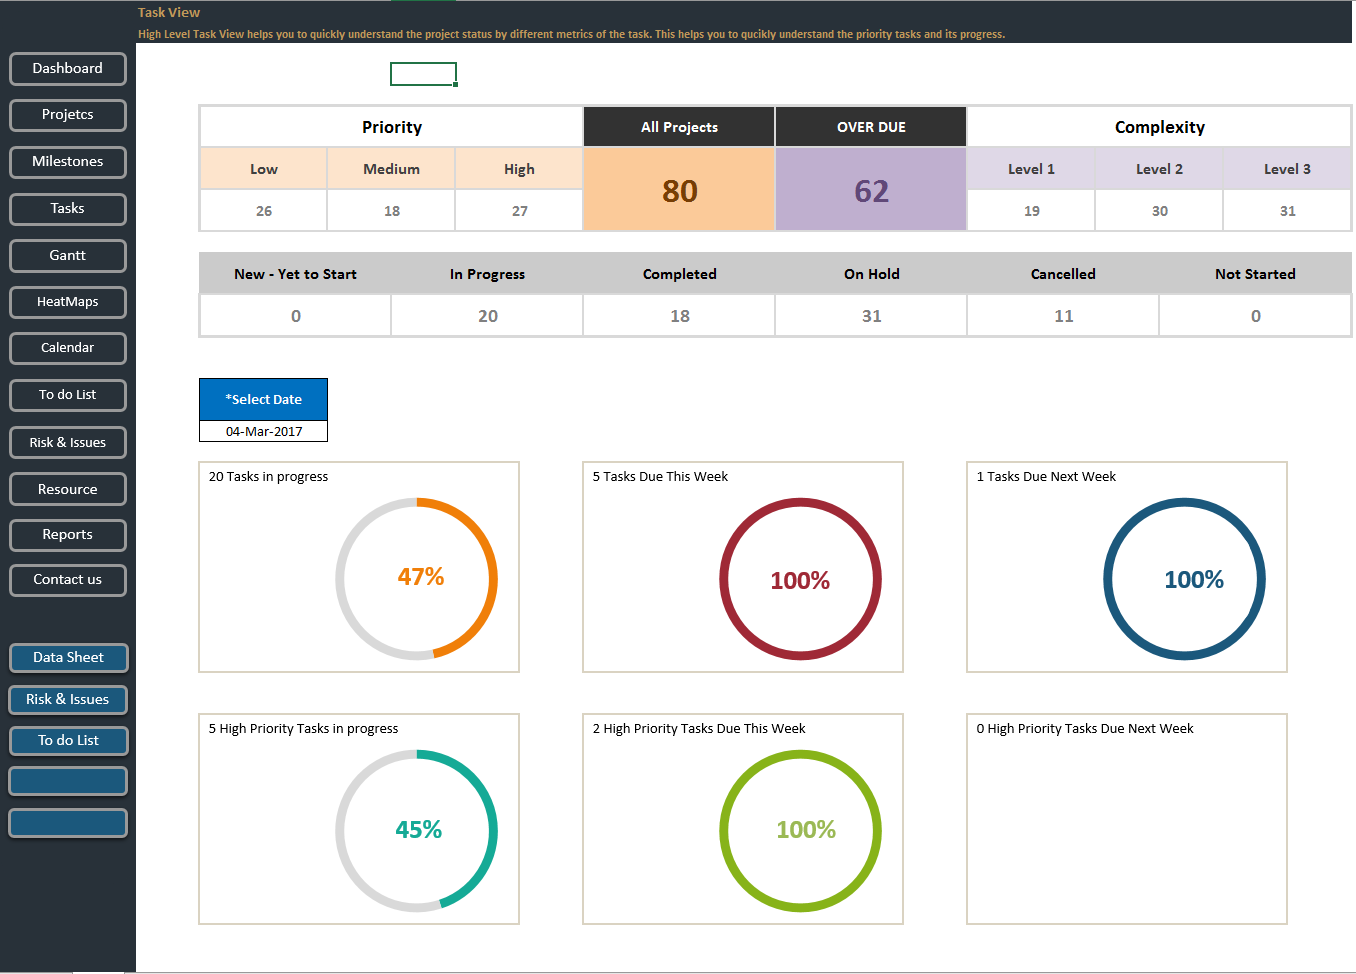
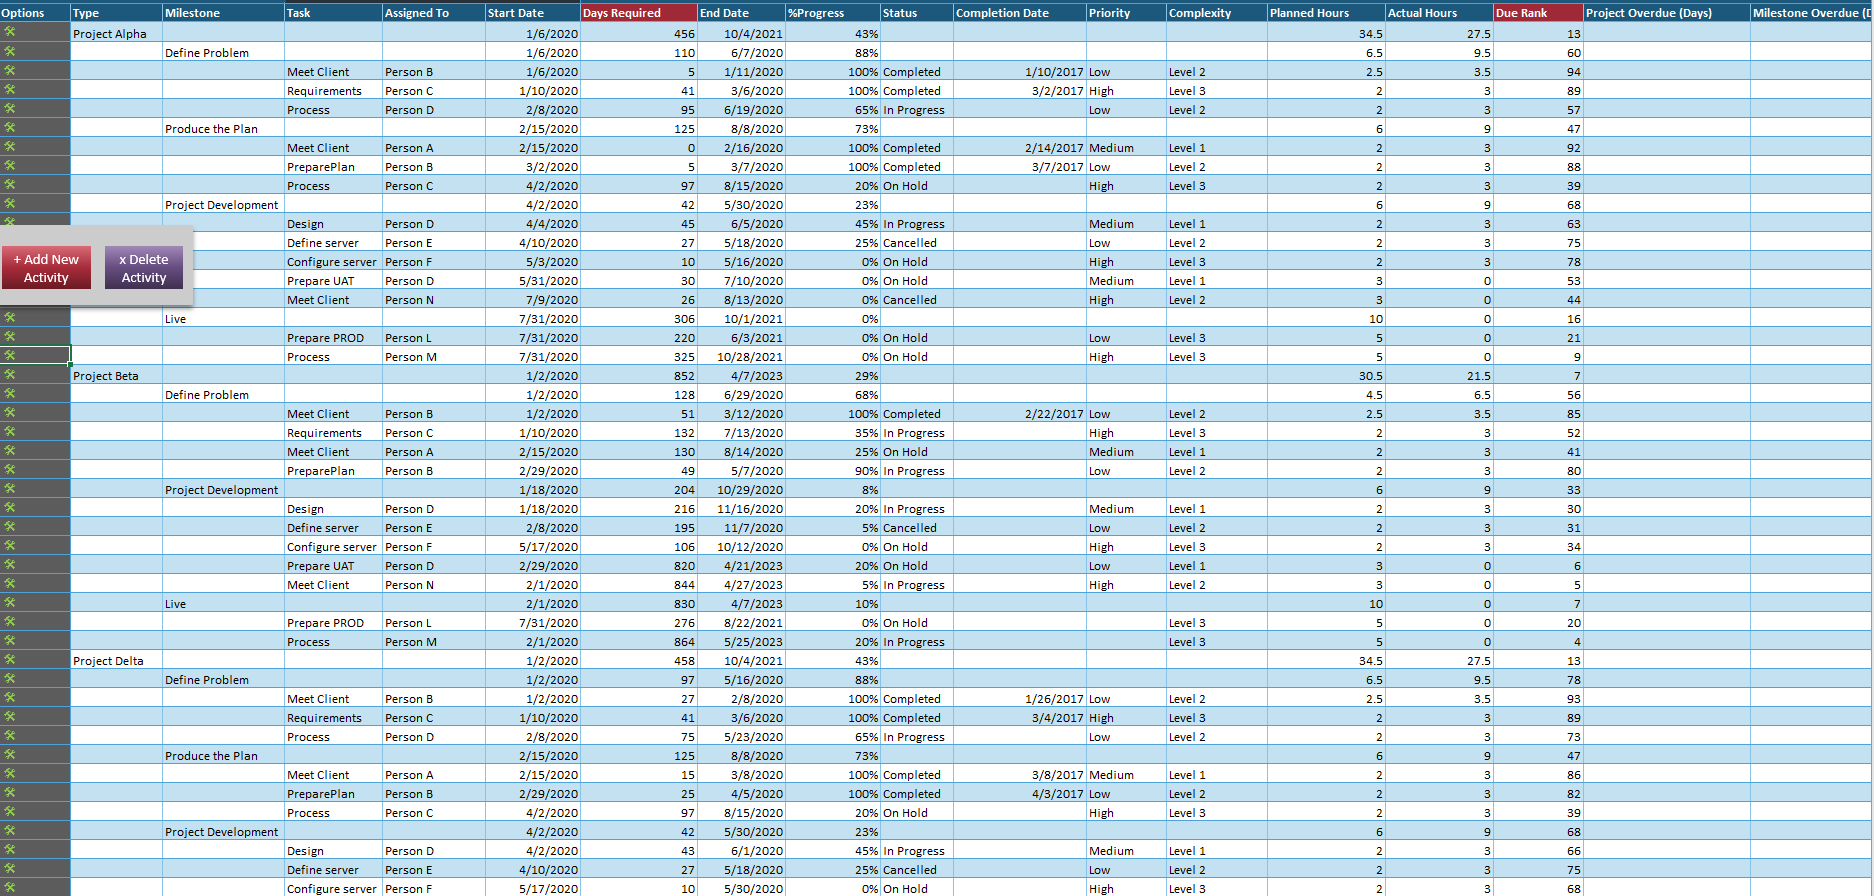
Tasks:
Within this menu, users can access information about tasks within different categories, including:
- All tasks and overdue tasks
- Tasks sorted by priority (low, medium, high)
- Tasks categorized by complexity (Level1, Level2, Level3)
- Total task counts, such as new, completed, in progress, on-hold, canceled, and unplanned tasks.
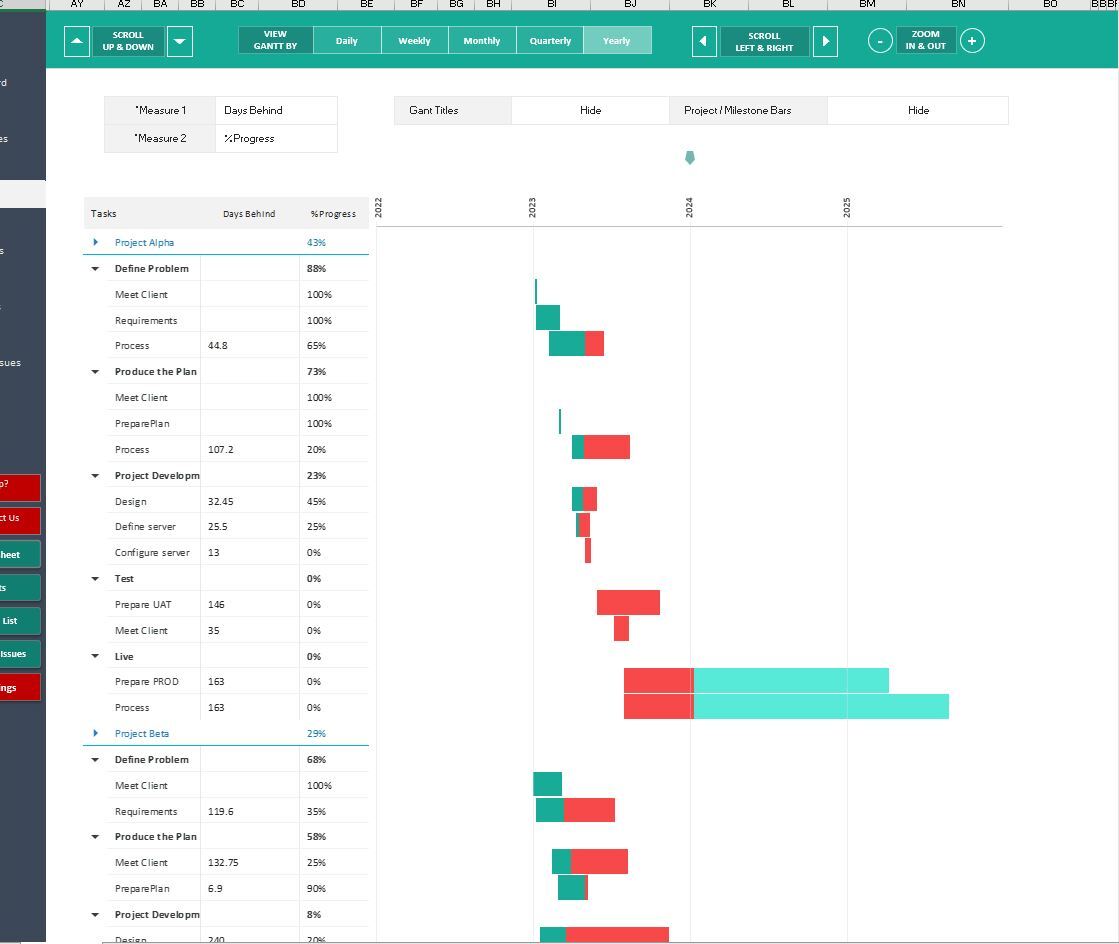
Gantt:
The Gantt Chart provides a visual representation of daily, weekly, monthly, quarterly, and yearly project data. It is an effective tool for tracking progress and setting project goals.
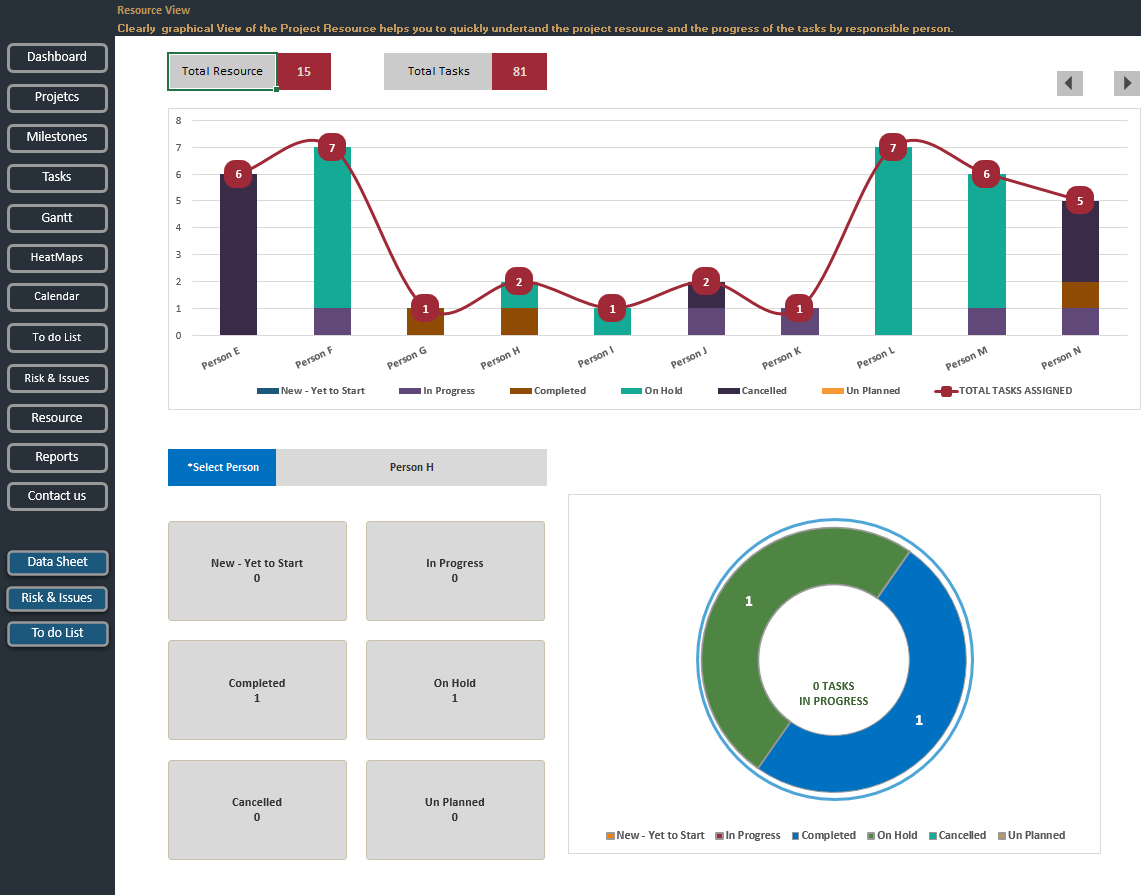
Resource:
This section displays available resources and task-related information, including tasks assigned to and completed by individual stakeholders. It also presents due tasks on a weekly, monthly, and yearly basis.
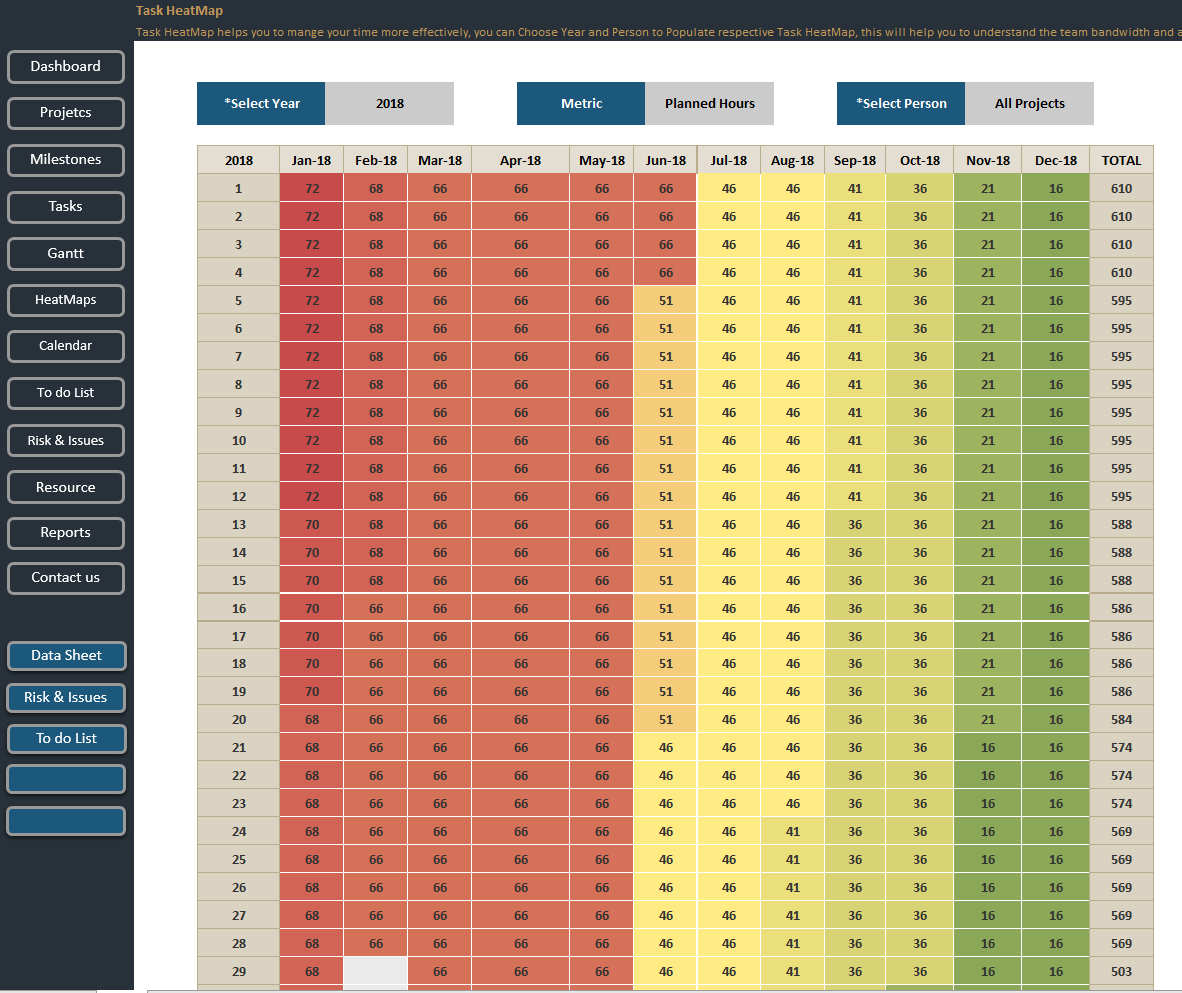
Heatmap:
Project managers can utilize the heatmap feature to assign tasks to staff based on time slots.
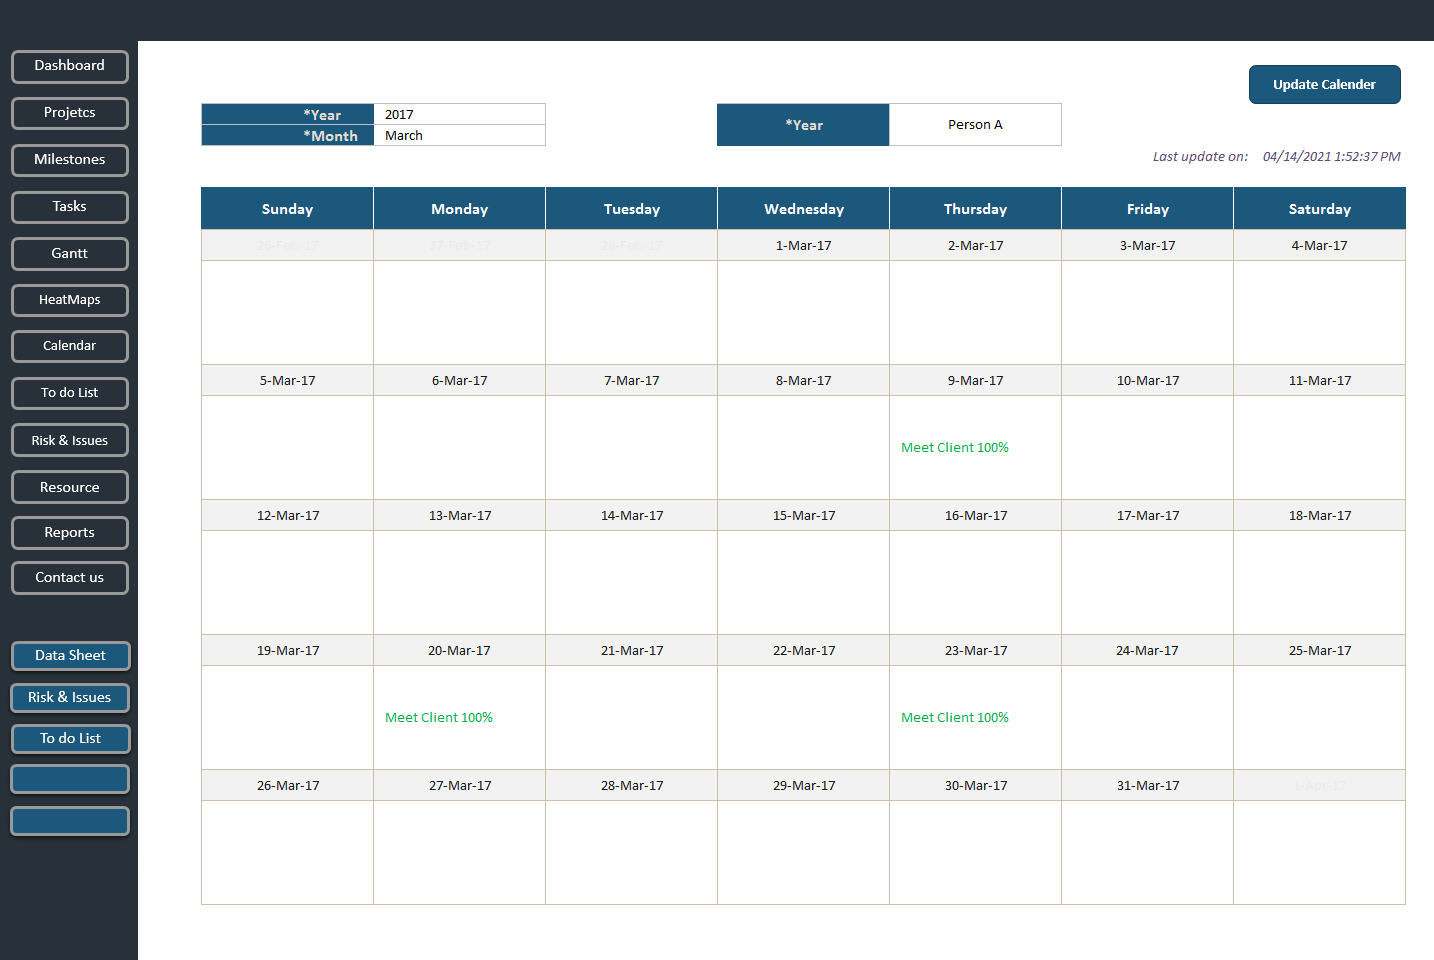
Calendar:
The monthly calendar assists in efficient task management and is populated with data from the Resource menu. It provides a brief overview of tasks and stakeholder activities.
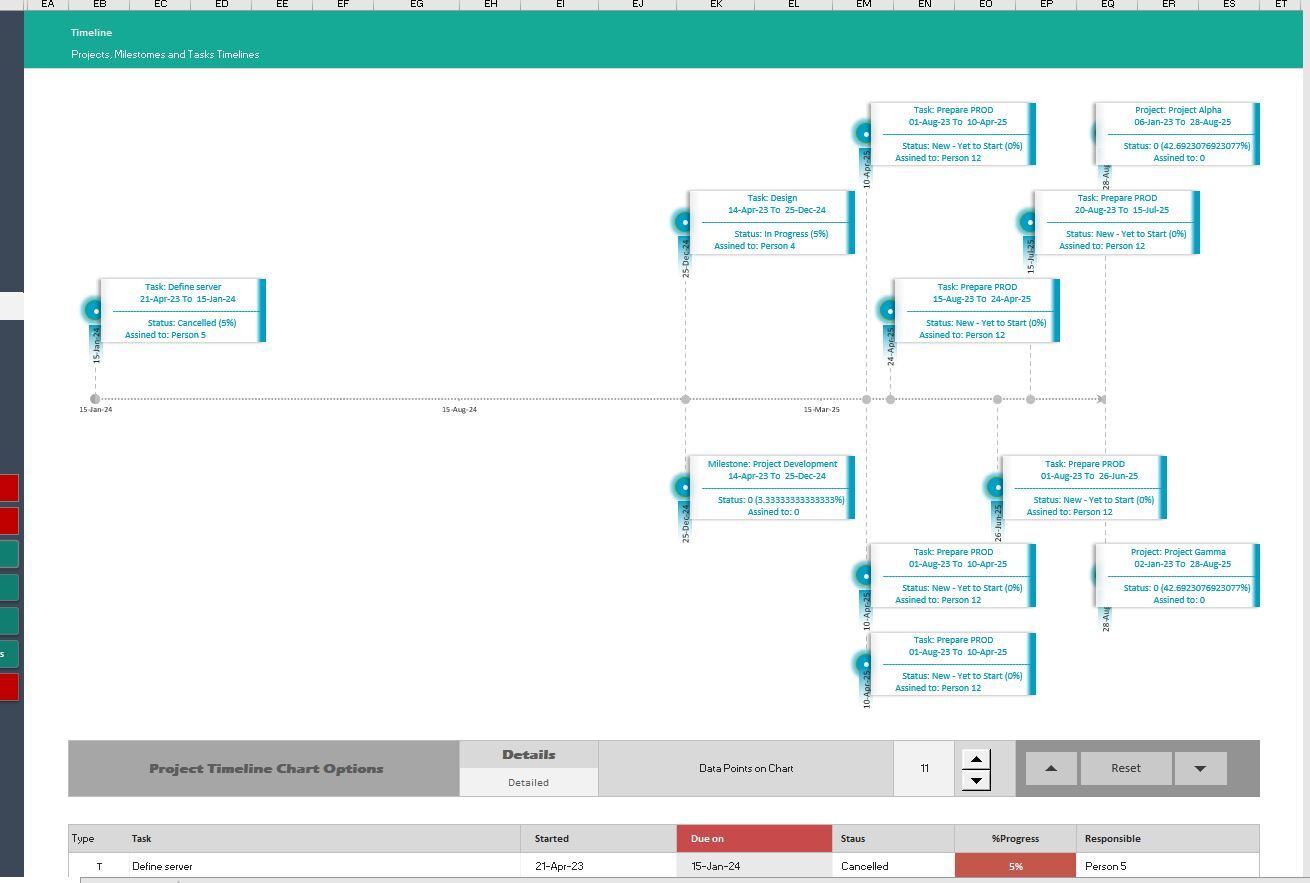
Timelines:
This section presents tasks and activities in chronological order using a bar chart format, while also displaying start and end dates.
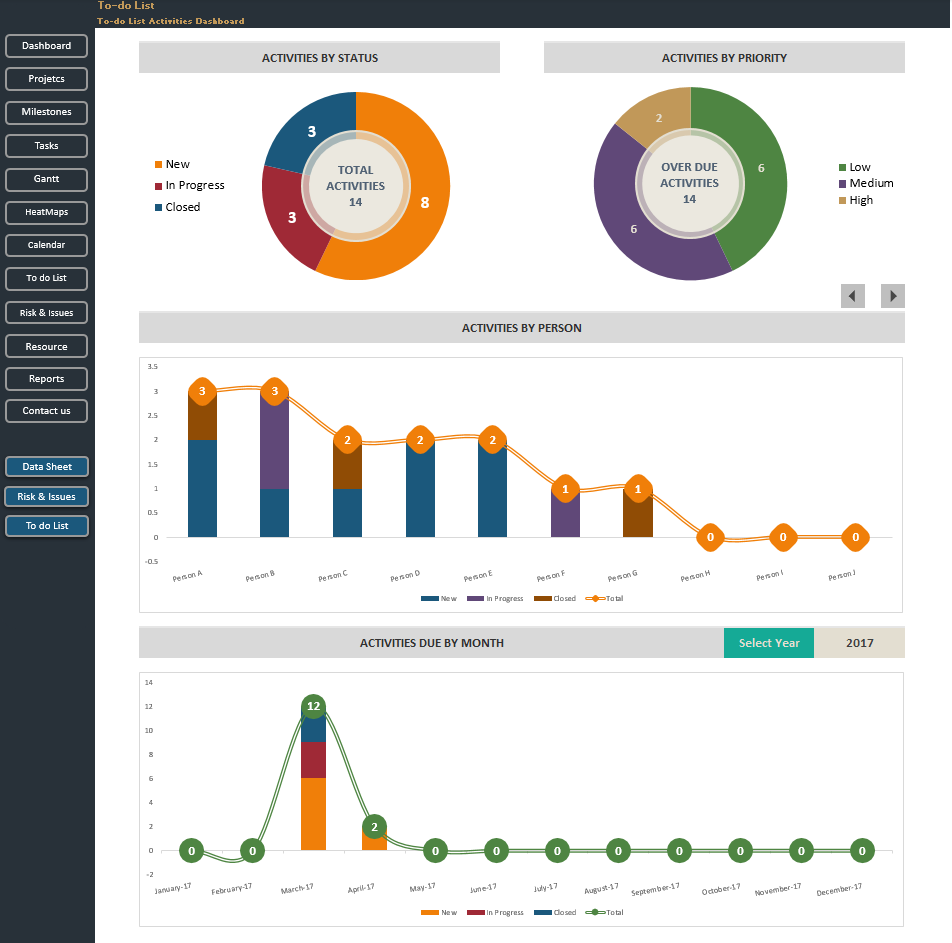
To-do List:
The To-do list organizes project activities into two categories: Activities by Status and Activities by Priority. It also showcases progress and monthly activities.
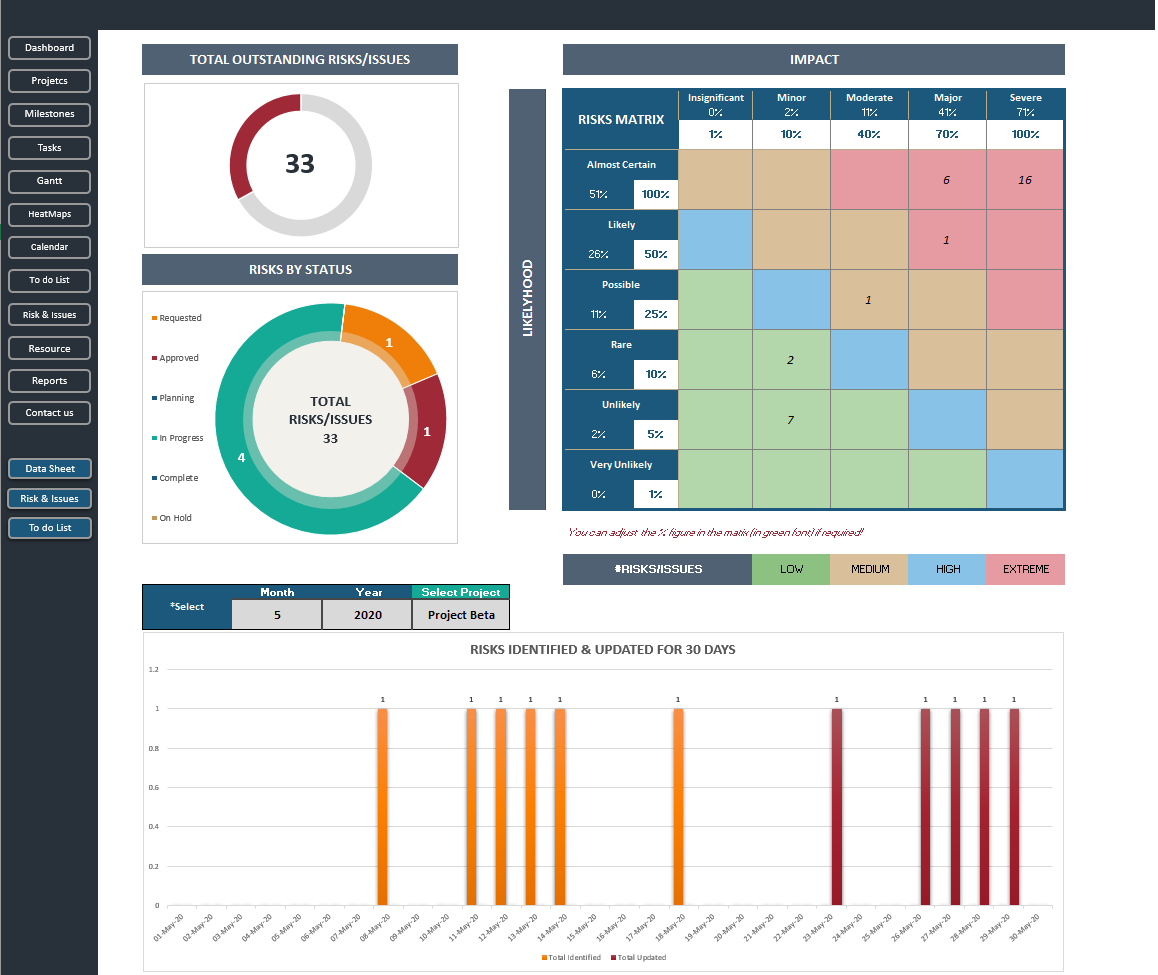
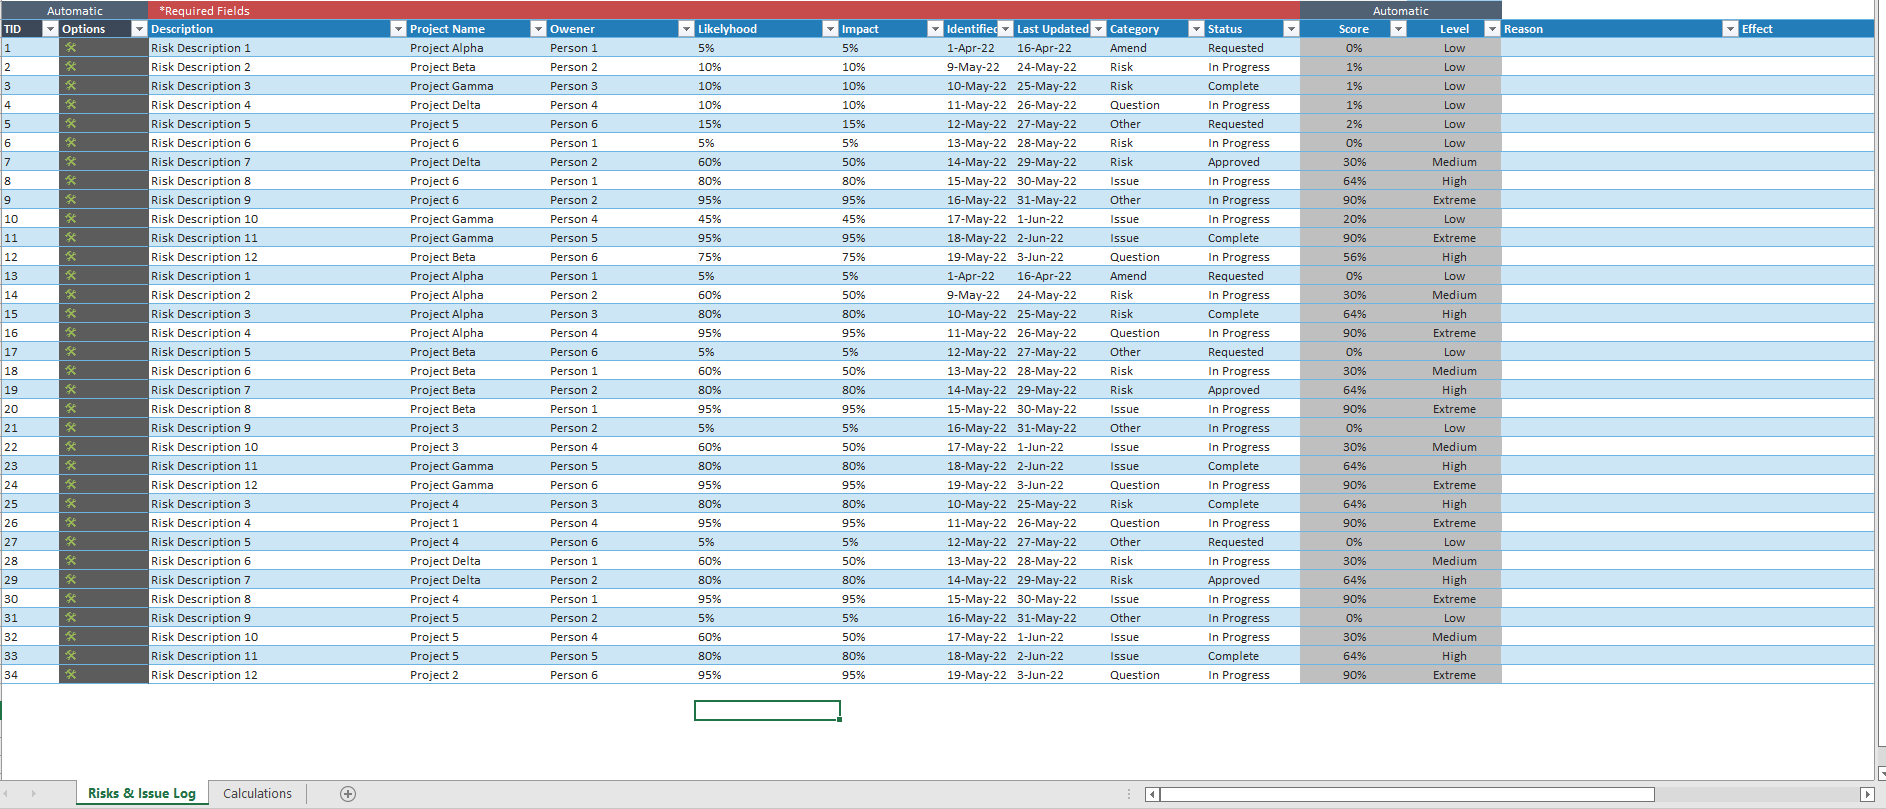
Risk & Issues:
This dashboard presents risks and their impacts, including status, approval, and likelihood.
Reports:
Users can choose different views, export them to Excel or PowerPoint, and easily share them with colleagues or clients.
By utilizing this template, project managers can effectively organize and monitor their projects, maximizing the utilization of available tools and methodologies.
Youtube Video: https://www.youtube.com/watch?v=e8g3SnER8Z4
Download PPT: https://docs.google.com/document/d/1cxH93StjkSPqszInk28ltDE4lvG-qEuRvDZUKcsc_2E/edit?usp=sharing
Project managers are constantly seeking new methods and ideas to enhance the effectiveness of their project management. Their goal is to achieve improved outcomes with less effort and time. In the IT market, there are numerous tools, templates, and software options available for project management, such as the Project Portfolio Dashboard Template Excel.
The Project Portfolio Dashboard Excel Template offers the following features:
Dashboard:
This section provides a comprehensive overview of multiple projects. It includes the total number of projects, projects currently in progress, and a weekly breakdown of each project's tasks, including due tasks, completed tasks, and tasks in progress. Additionally, it presents milestones, tasks, hours, risks, and graphical representations of project data in charts.
Projects:
In this section, users can monitor the progress of individual projects on a single page, accompanied by key performance indicators (KPIs) for each project. The menu includes sections for problem definition, planning, project development, testing, and project deployment. Users can also access information regarding project start and end dates, planned versus actual hours, risks and issues with their priorities, and graphical charts.
Milestones:
This section allows users to select a specific project and view sub-details such as start and end dates for milestones, total defined hours, and actual hours utilized.
Tasks:
Within this menu, users can access information about tasks within different categories, including:
- All tasks and overdue tasks
- Tasks sorted by priority (low, medium, high)
- Tasks categorized by complexity (Level1, Level2, Level3)
- Total task counts, such as new, completed, in progress, on-hold, canceled, and unplanned tasks.
Gantt:
The Gantt Chart provides a visual representation of daily, weekly, monthly, quarterly, and yearly project data. It is an effective tool for tracking progress and setting project goals.
Resource:
This section displays available resources and task-related information, including tasks assigned to and completed by individual stakeholders. It also presents due tasks on a weekly, monthly, and yearly basis.
Heatmap:
Project managers can utilize the heatmap feature to assign tasks to staff based on time slots.
Calendar:
The monthly calendar assists in efficient task management and is populated with data from the Resource menu. It provides a brief overview of tasks and stakeholder activities.
Timelines:
This section presents tasks and activities in chronological order using a bar chart format, while also displaying start and end dates.
To-do List:
The To-do list organizes project activities into two categories: Activities by Status and Activities by Priority. It also showcases progress and monthly activities.
Risk & Issues:
This dashboard presents risks and their impacts, including status, approval, and likelihood.
Reports:
Users can choose different views, export them to Excel or PowerPoint, and easily share them with colleagues or clients.
By utilizing this template, project managers can effectively organize and monitor their projects, maximizing the utilization of available tools and methodologies.
Youtube Video: https://www.youtube.com/watch?v=e8g3SnER8Z4
Download PPT: https://docs.google.com/document/d/1cxH93StjkSPqszInk28ltDE4lvG-qEuRvDZUKcsc_2E/edit?usp=sharing
This Best Practice includes
Excel
