

Originally published: 24/01/2022 09:41
Publication number: ELQ-68966-1
View all versions & Certificate
Publication number: ELQ-68966-1
View all versions & Certificate

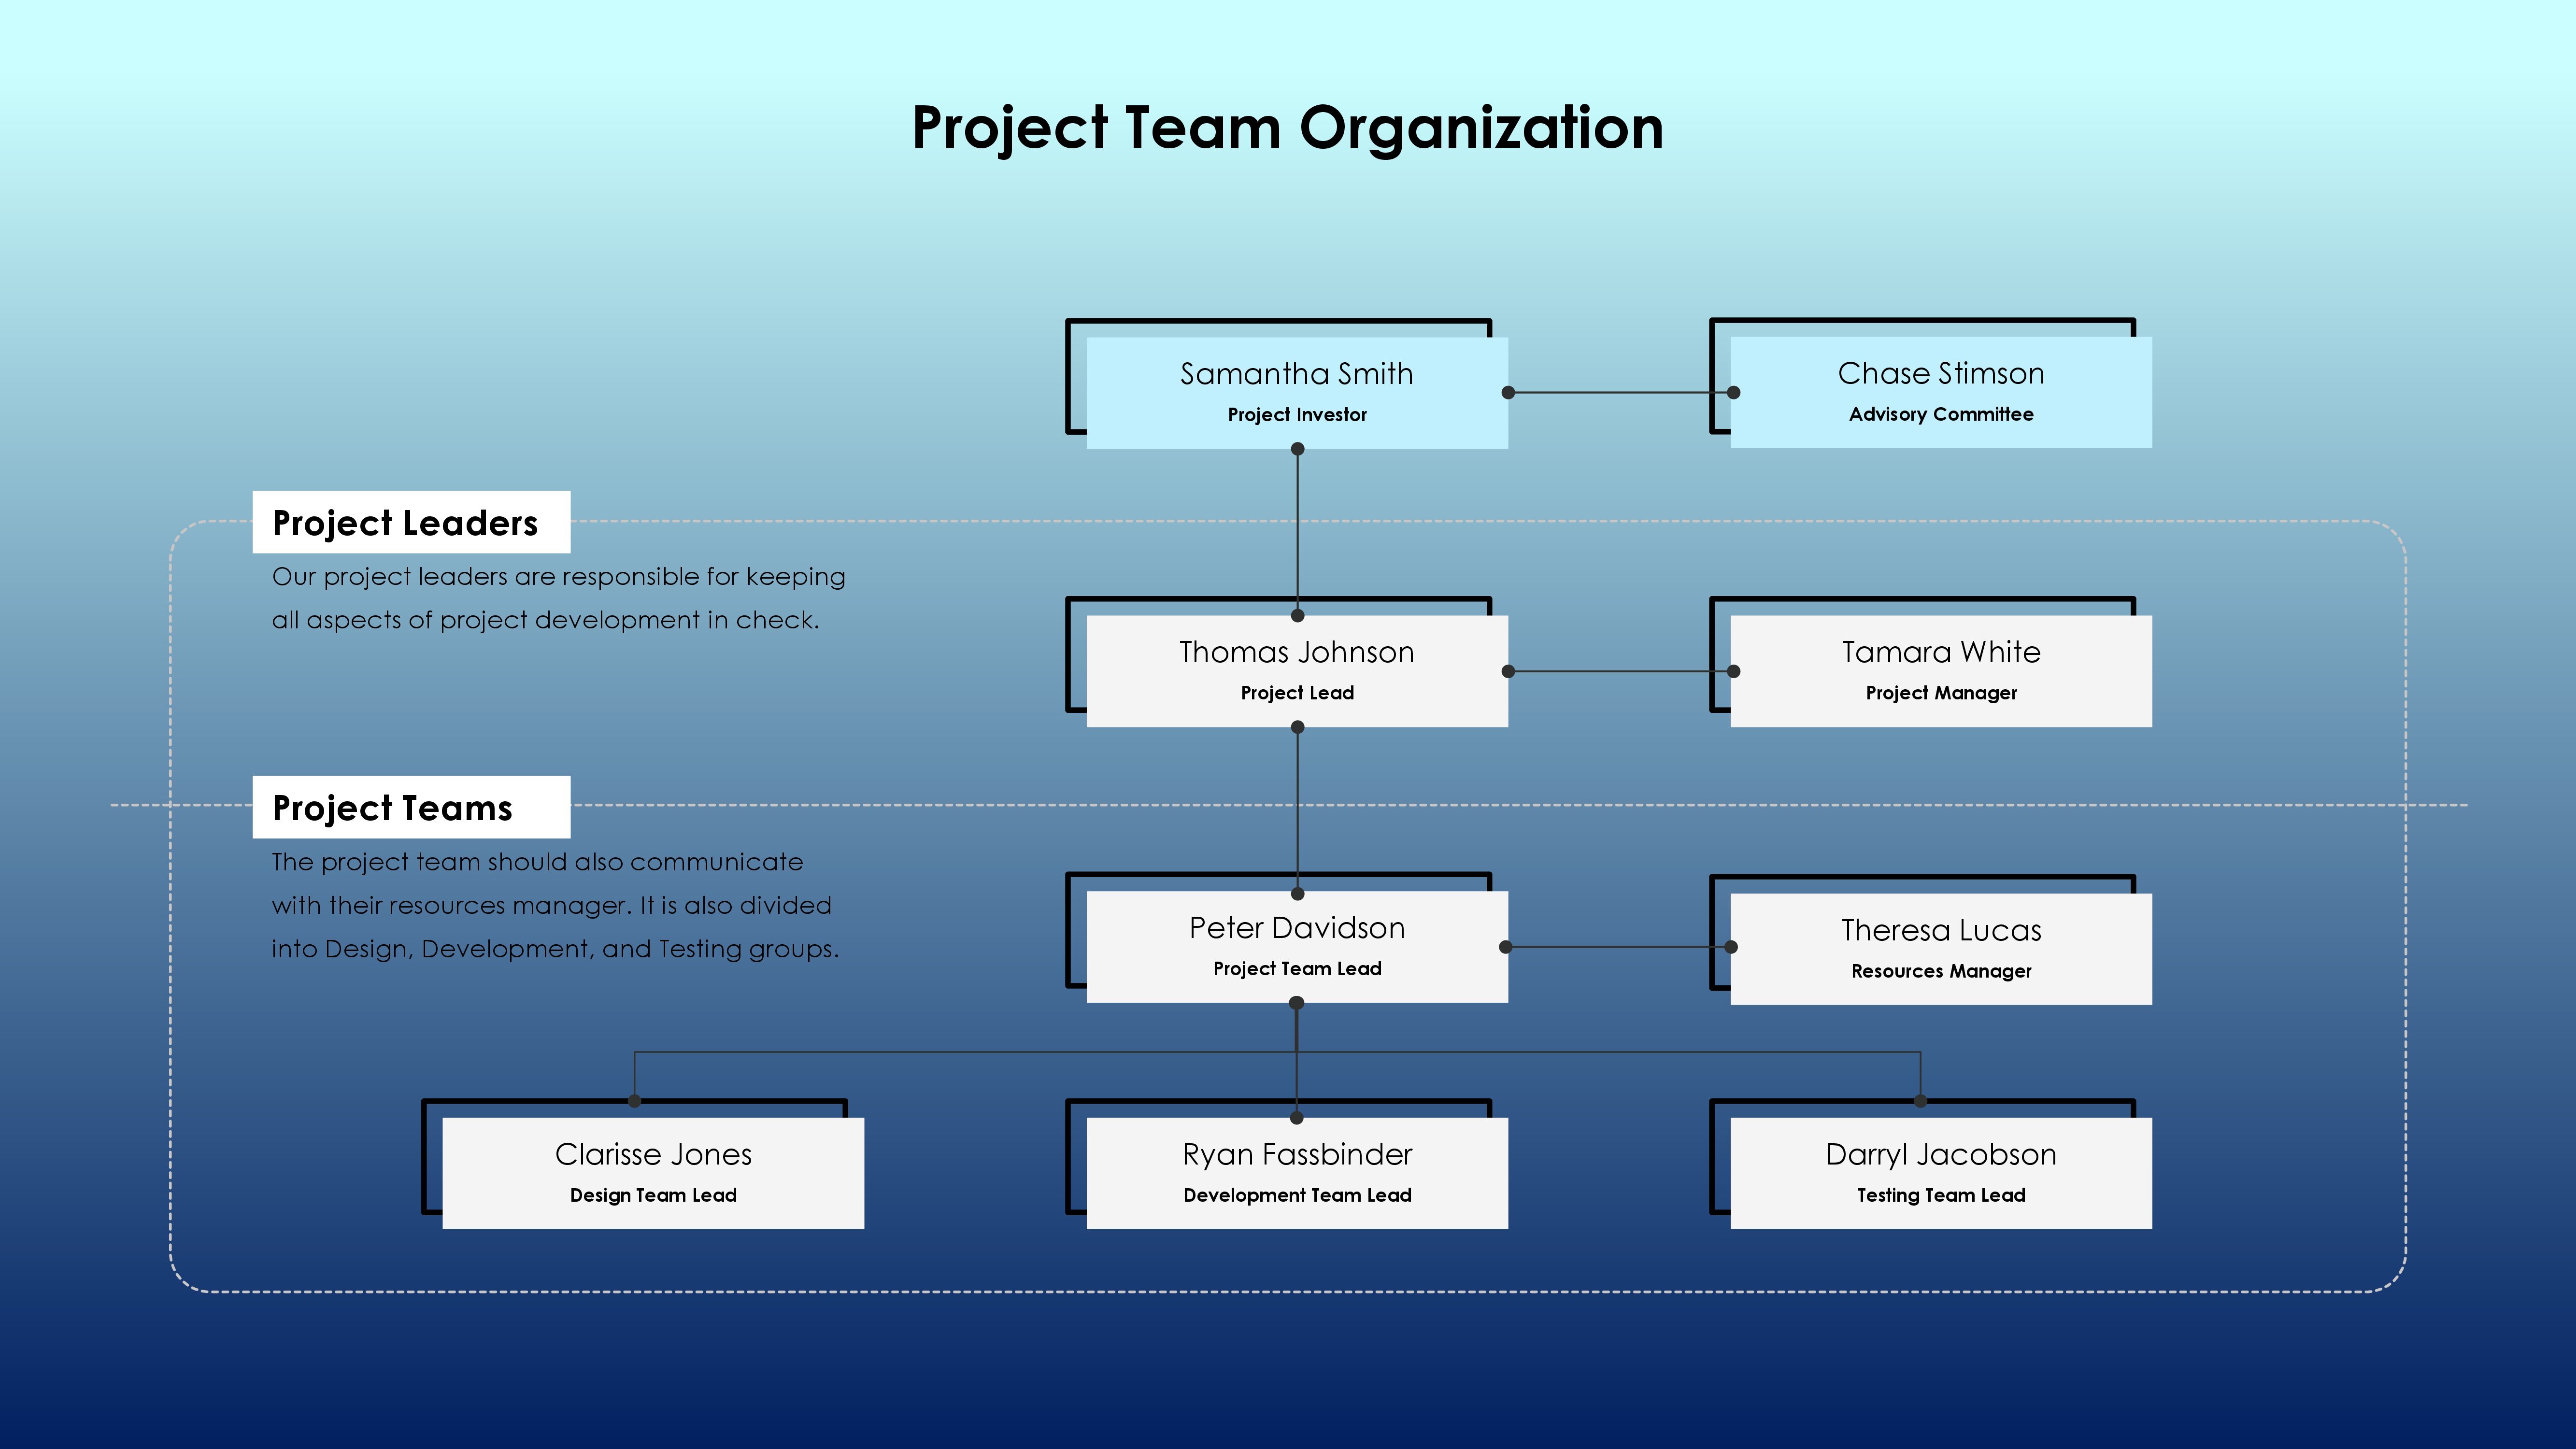
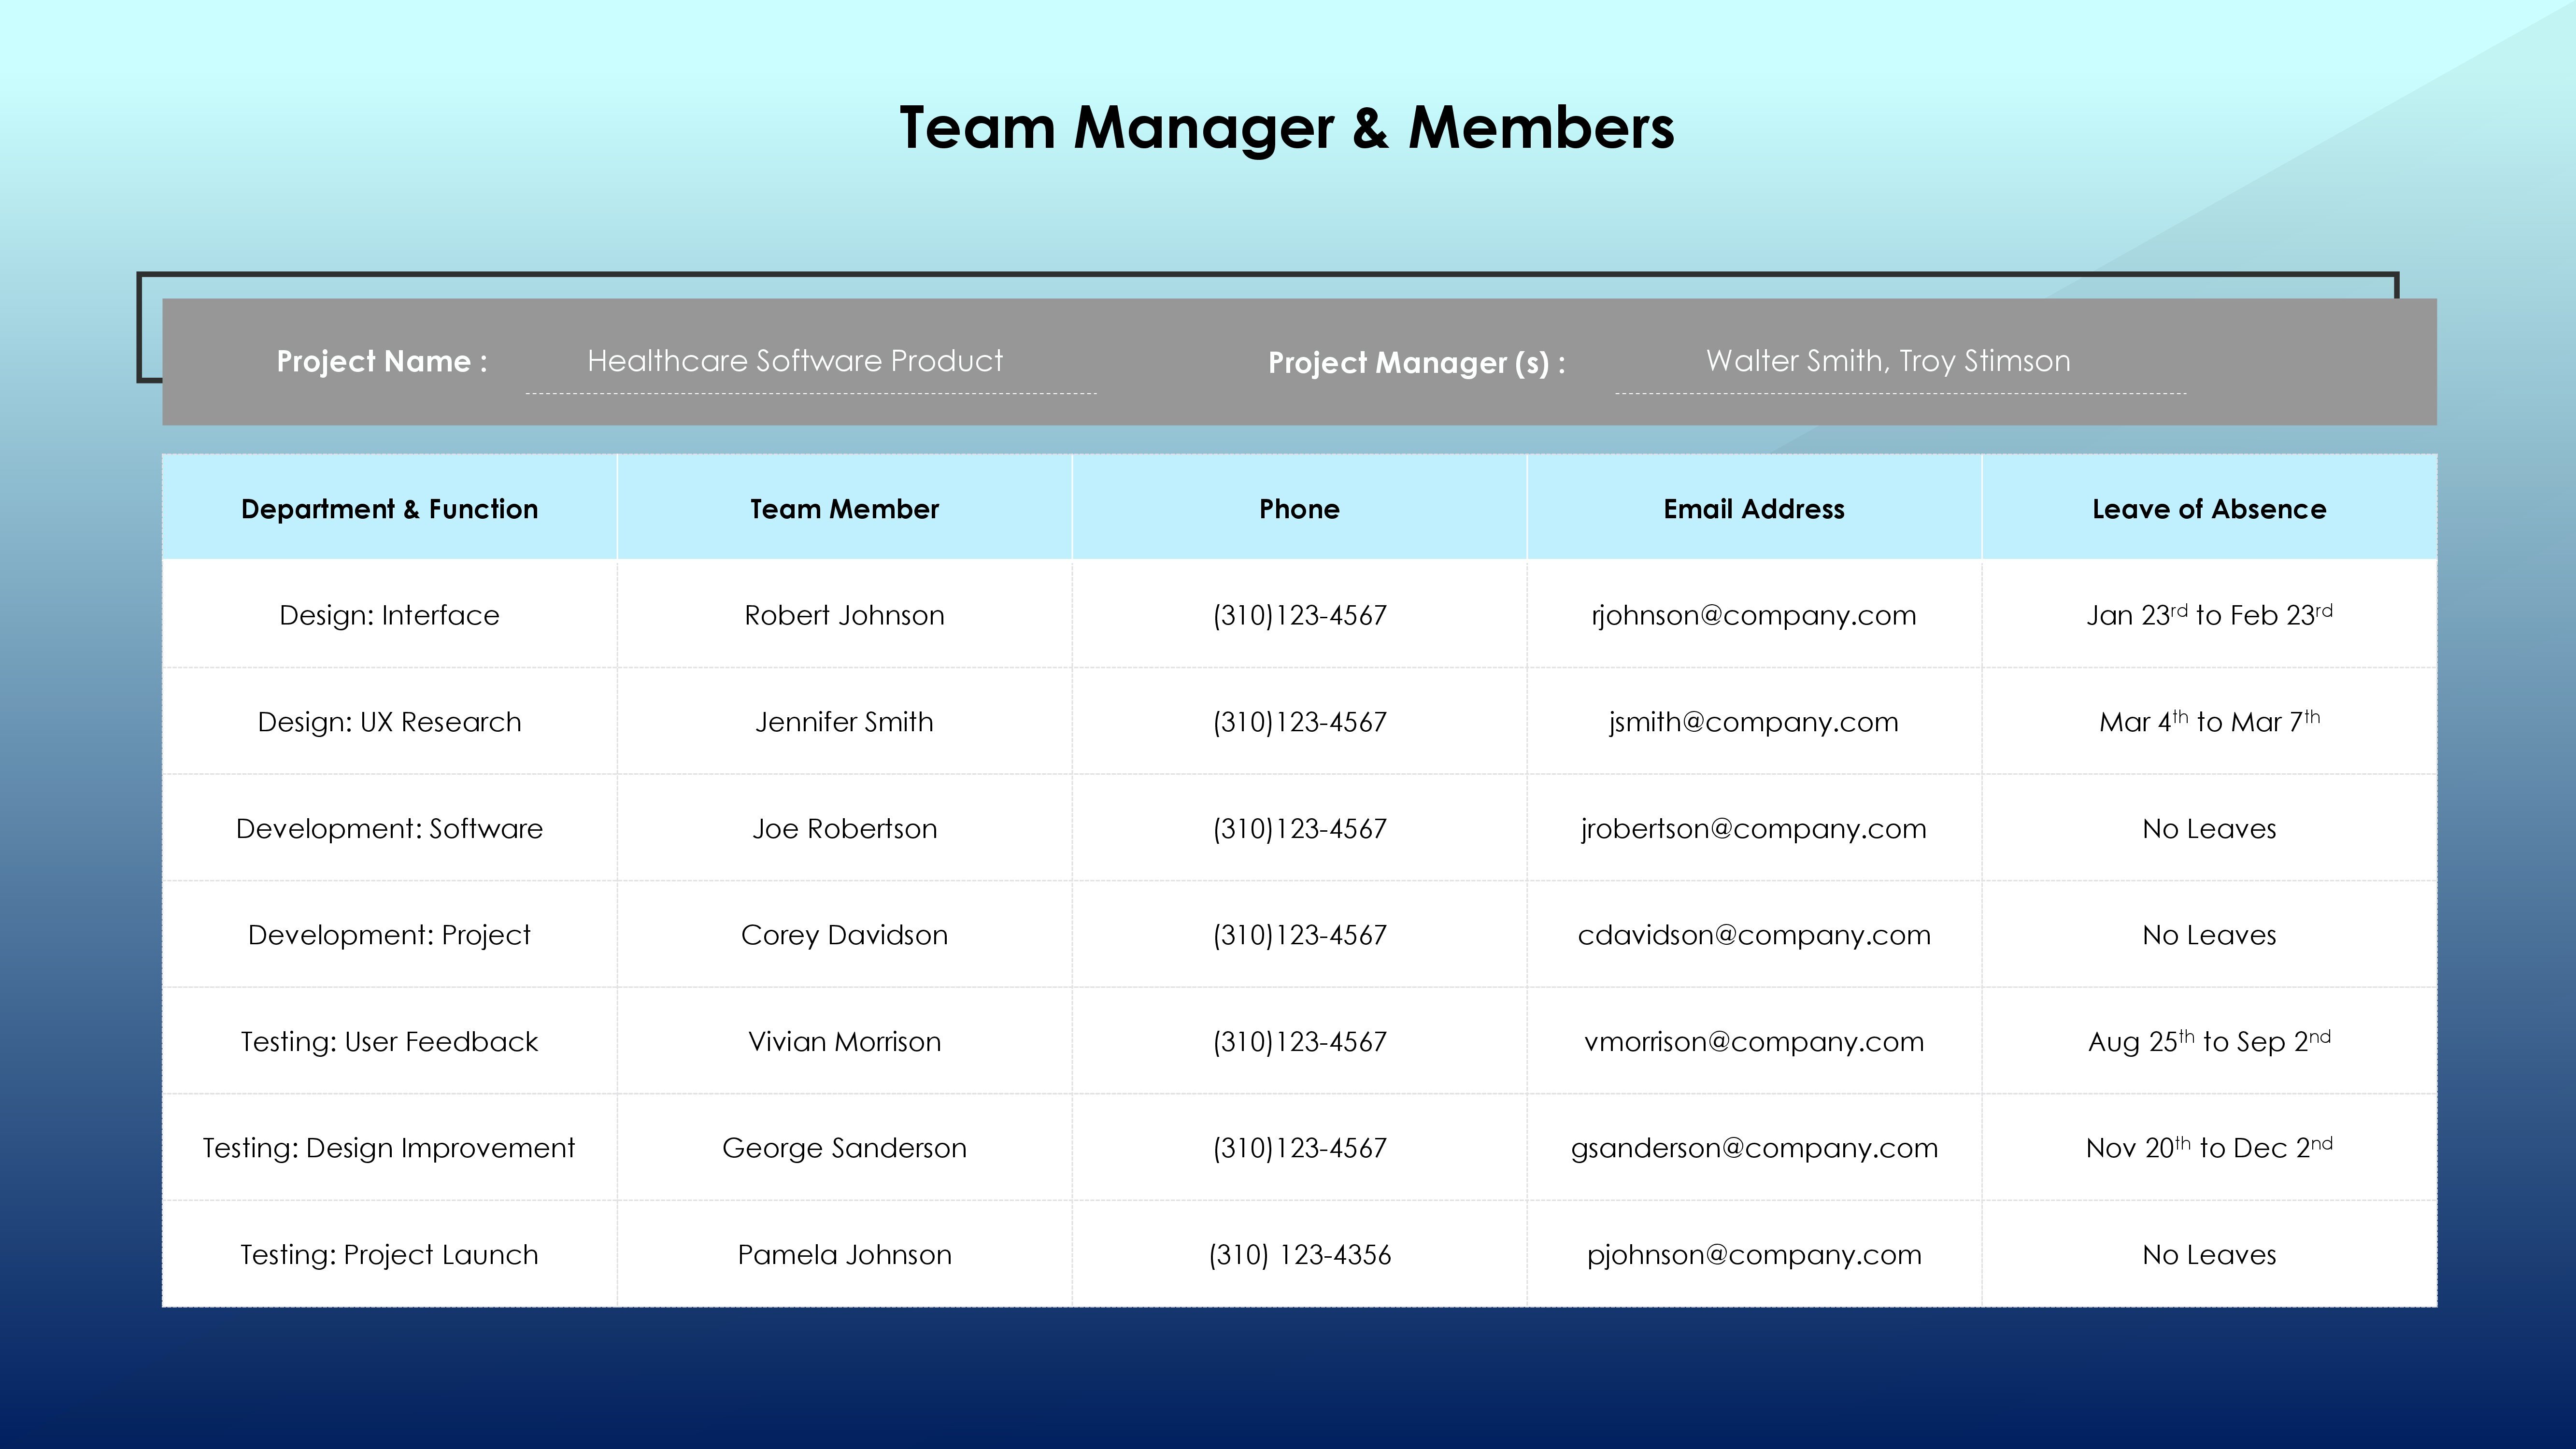
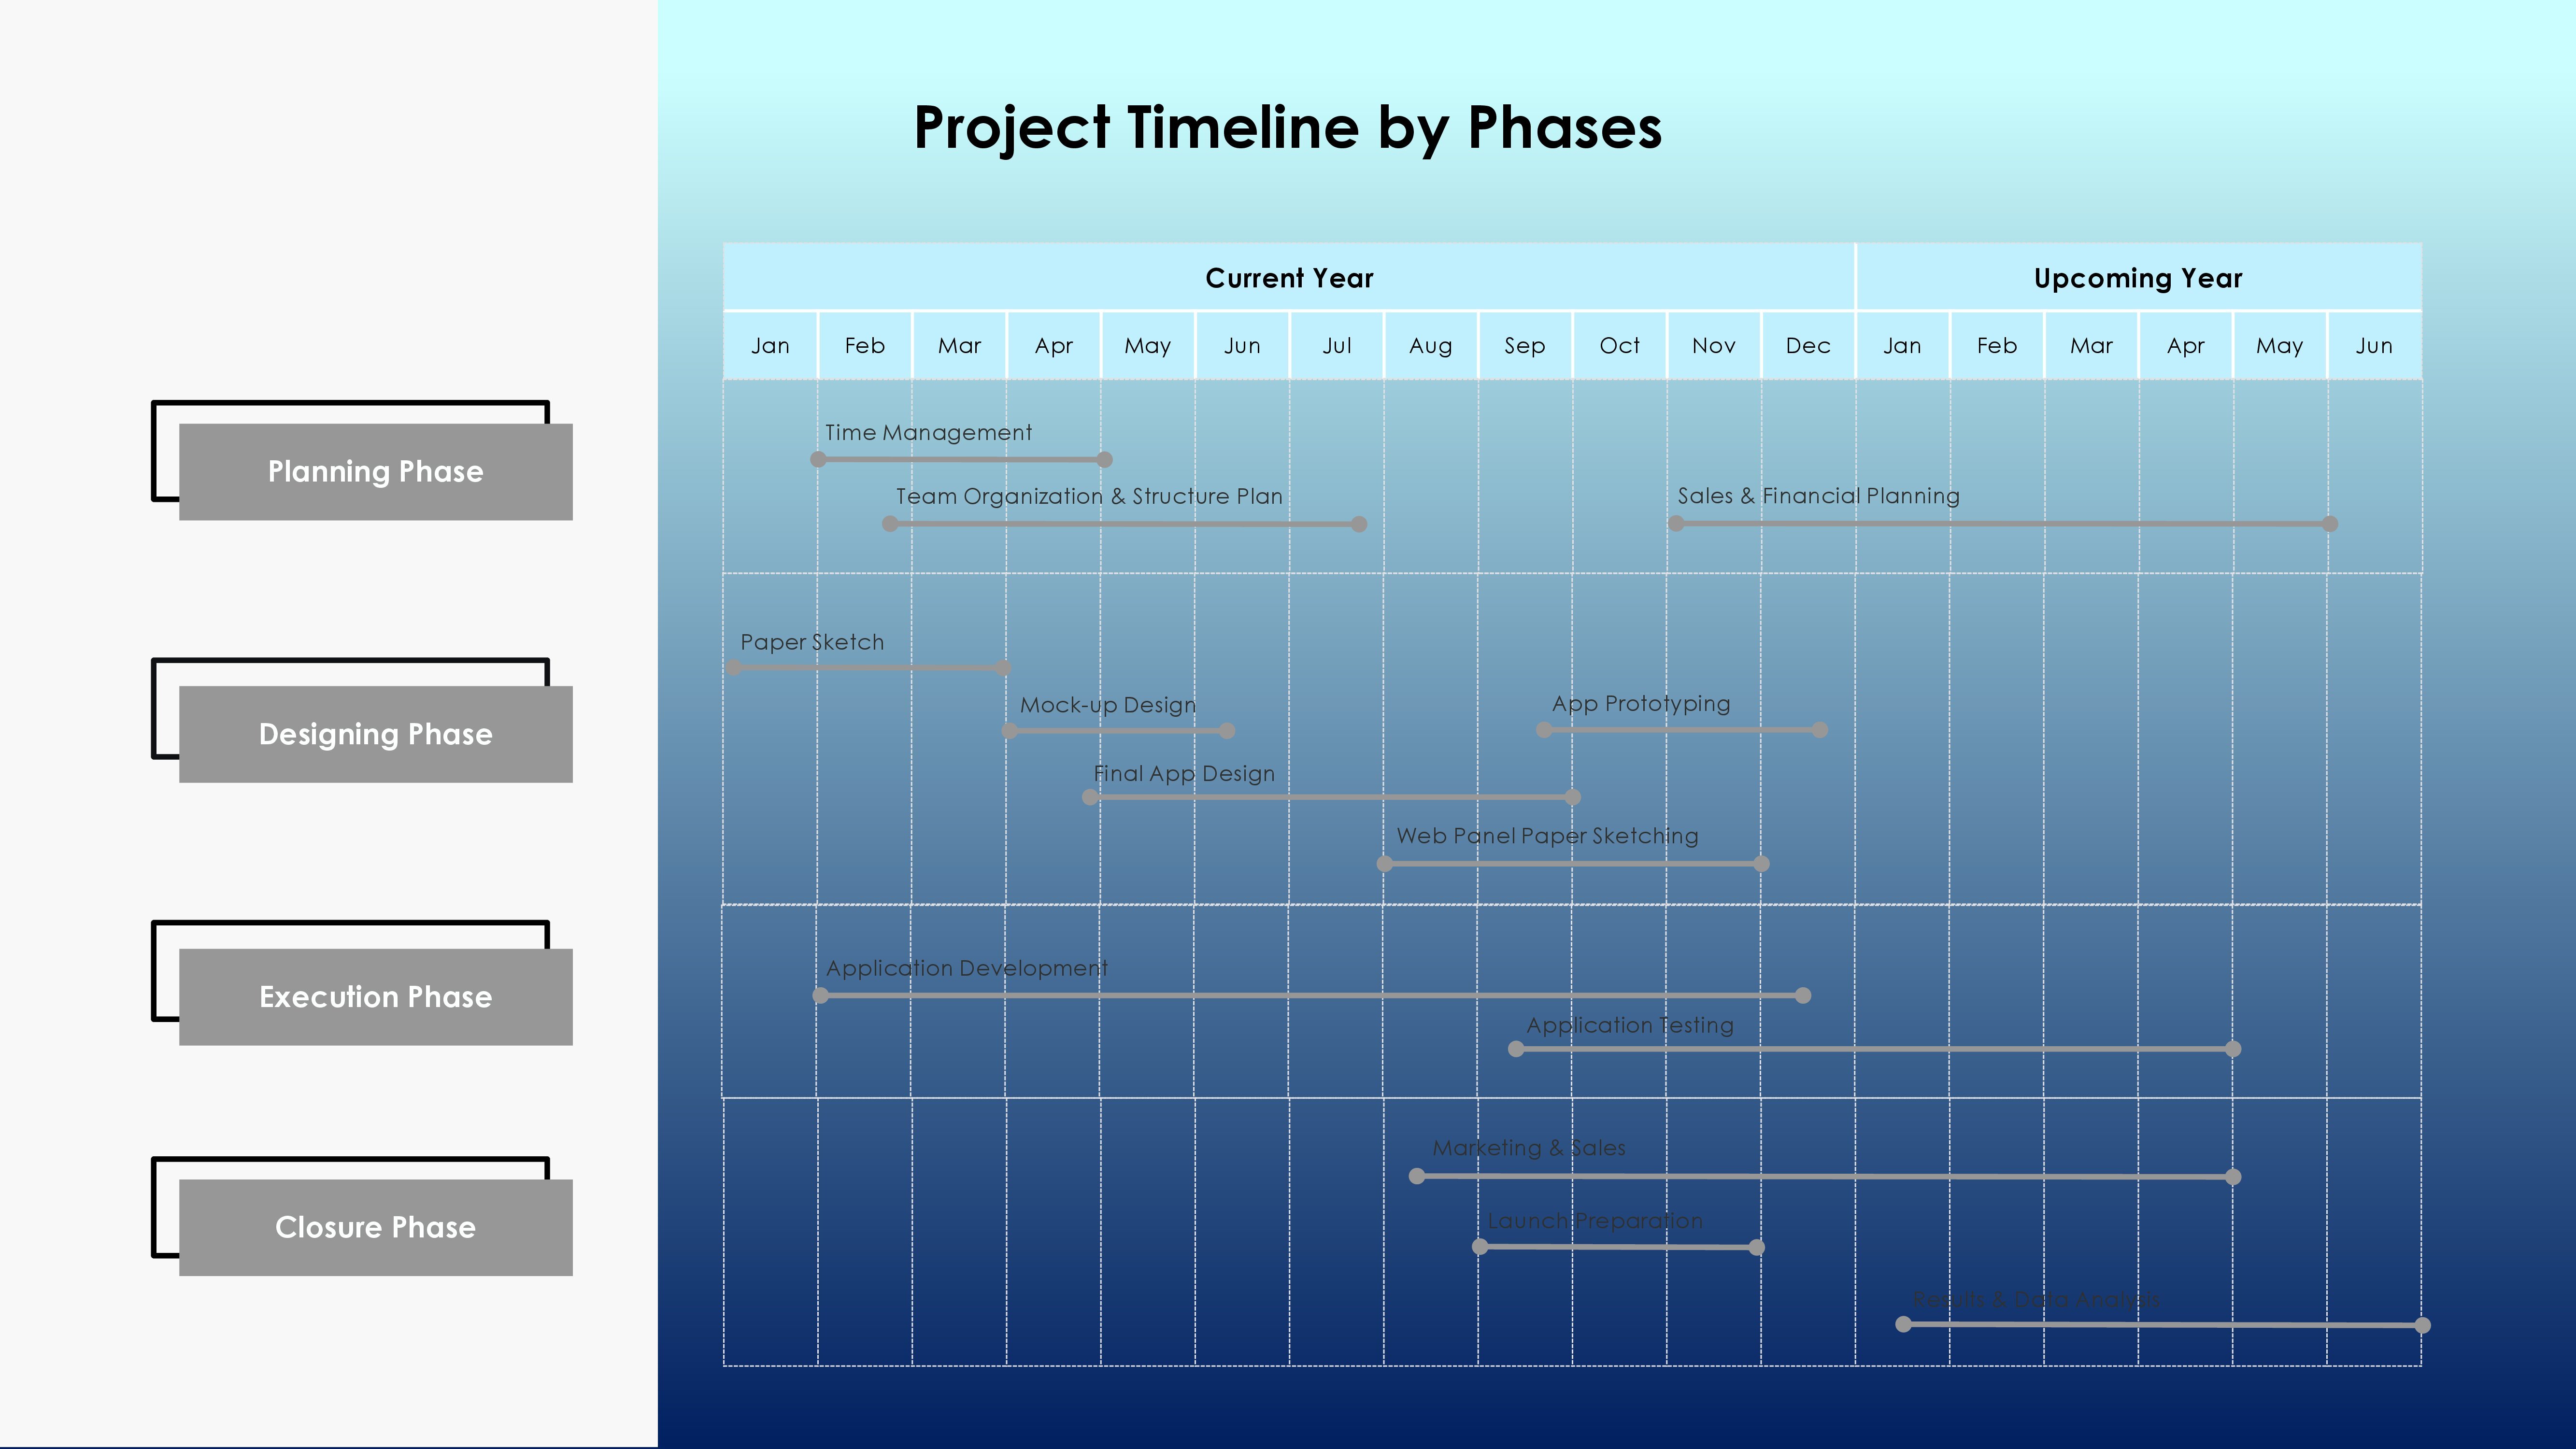
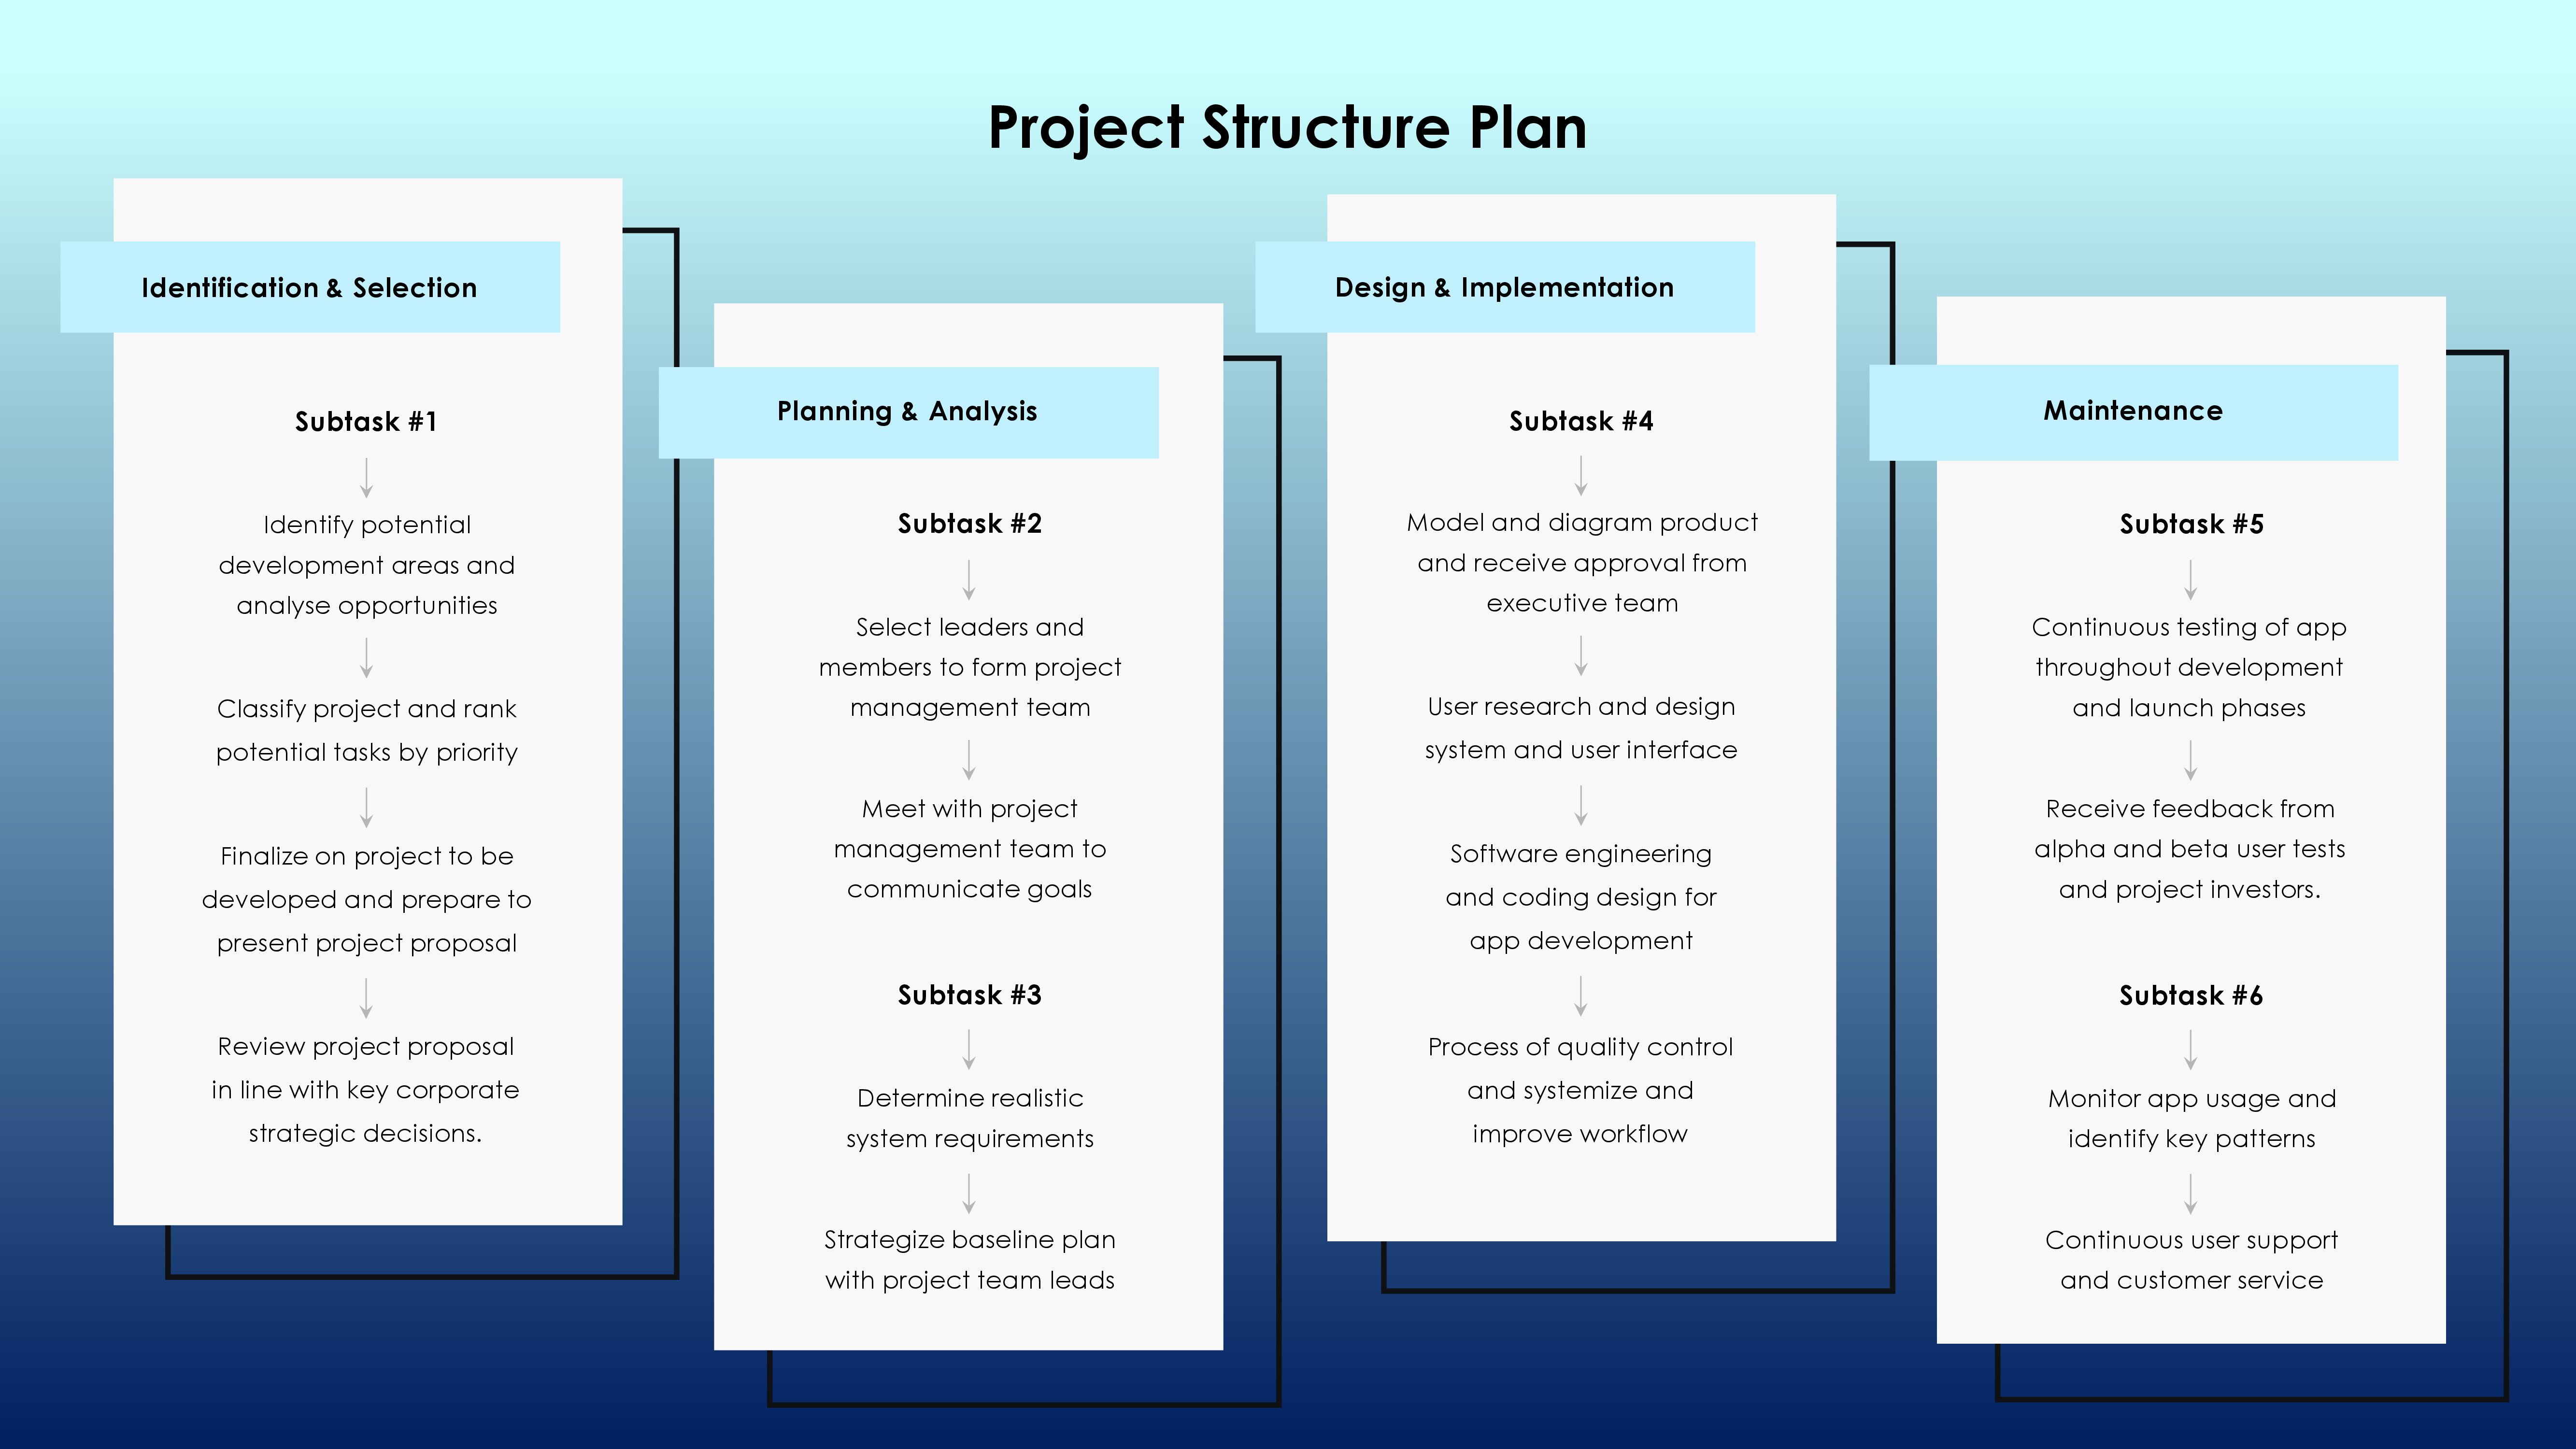
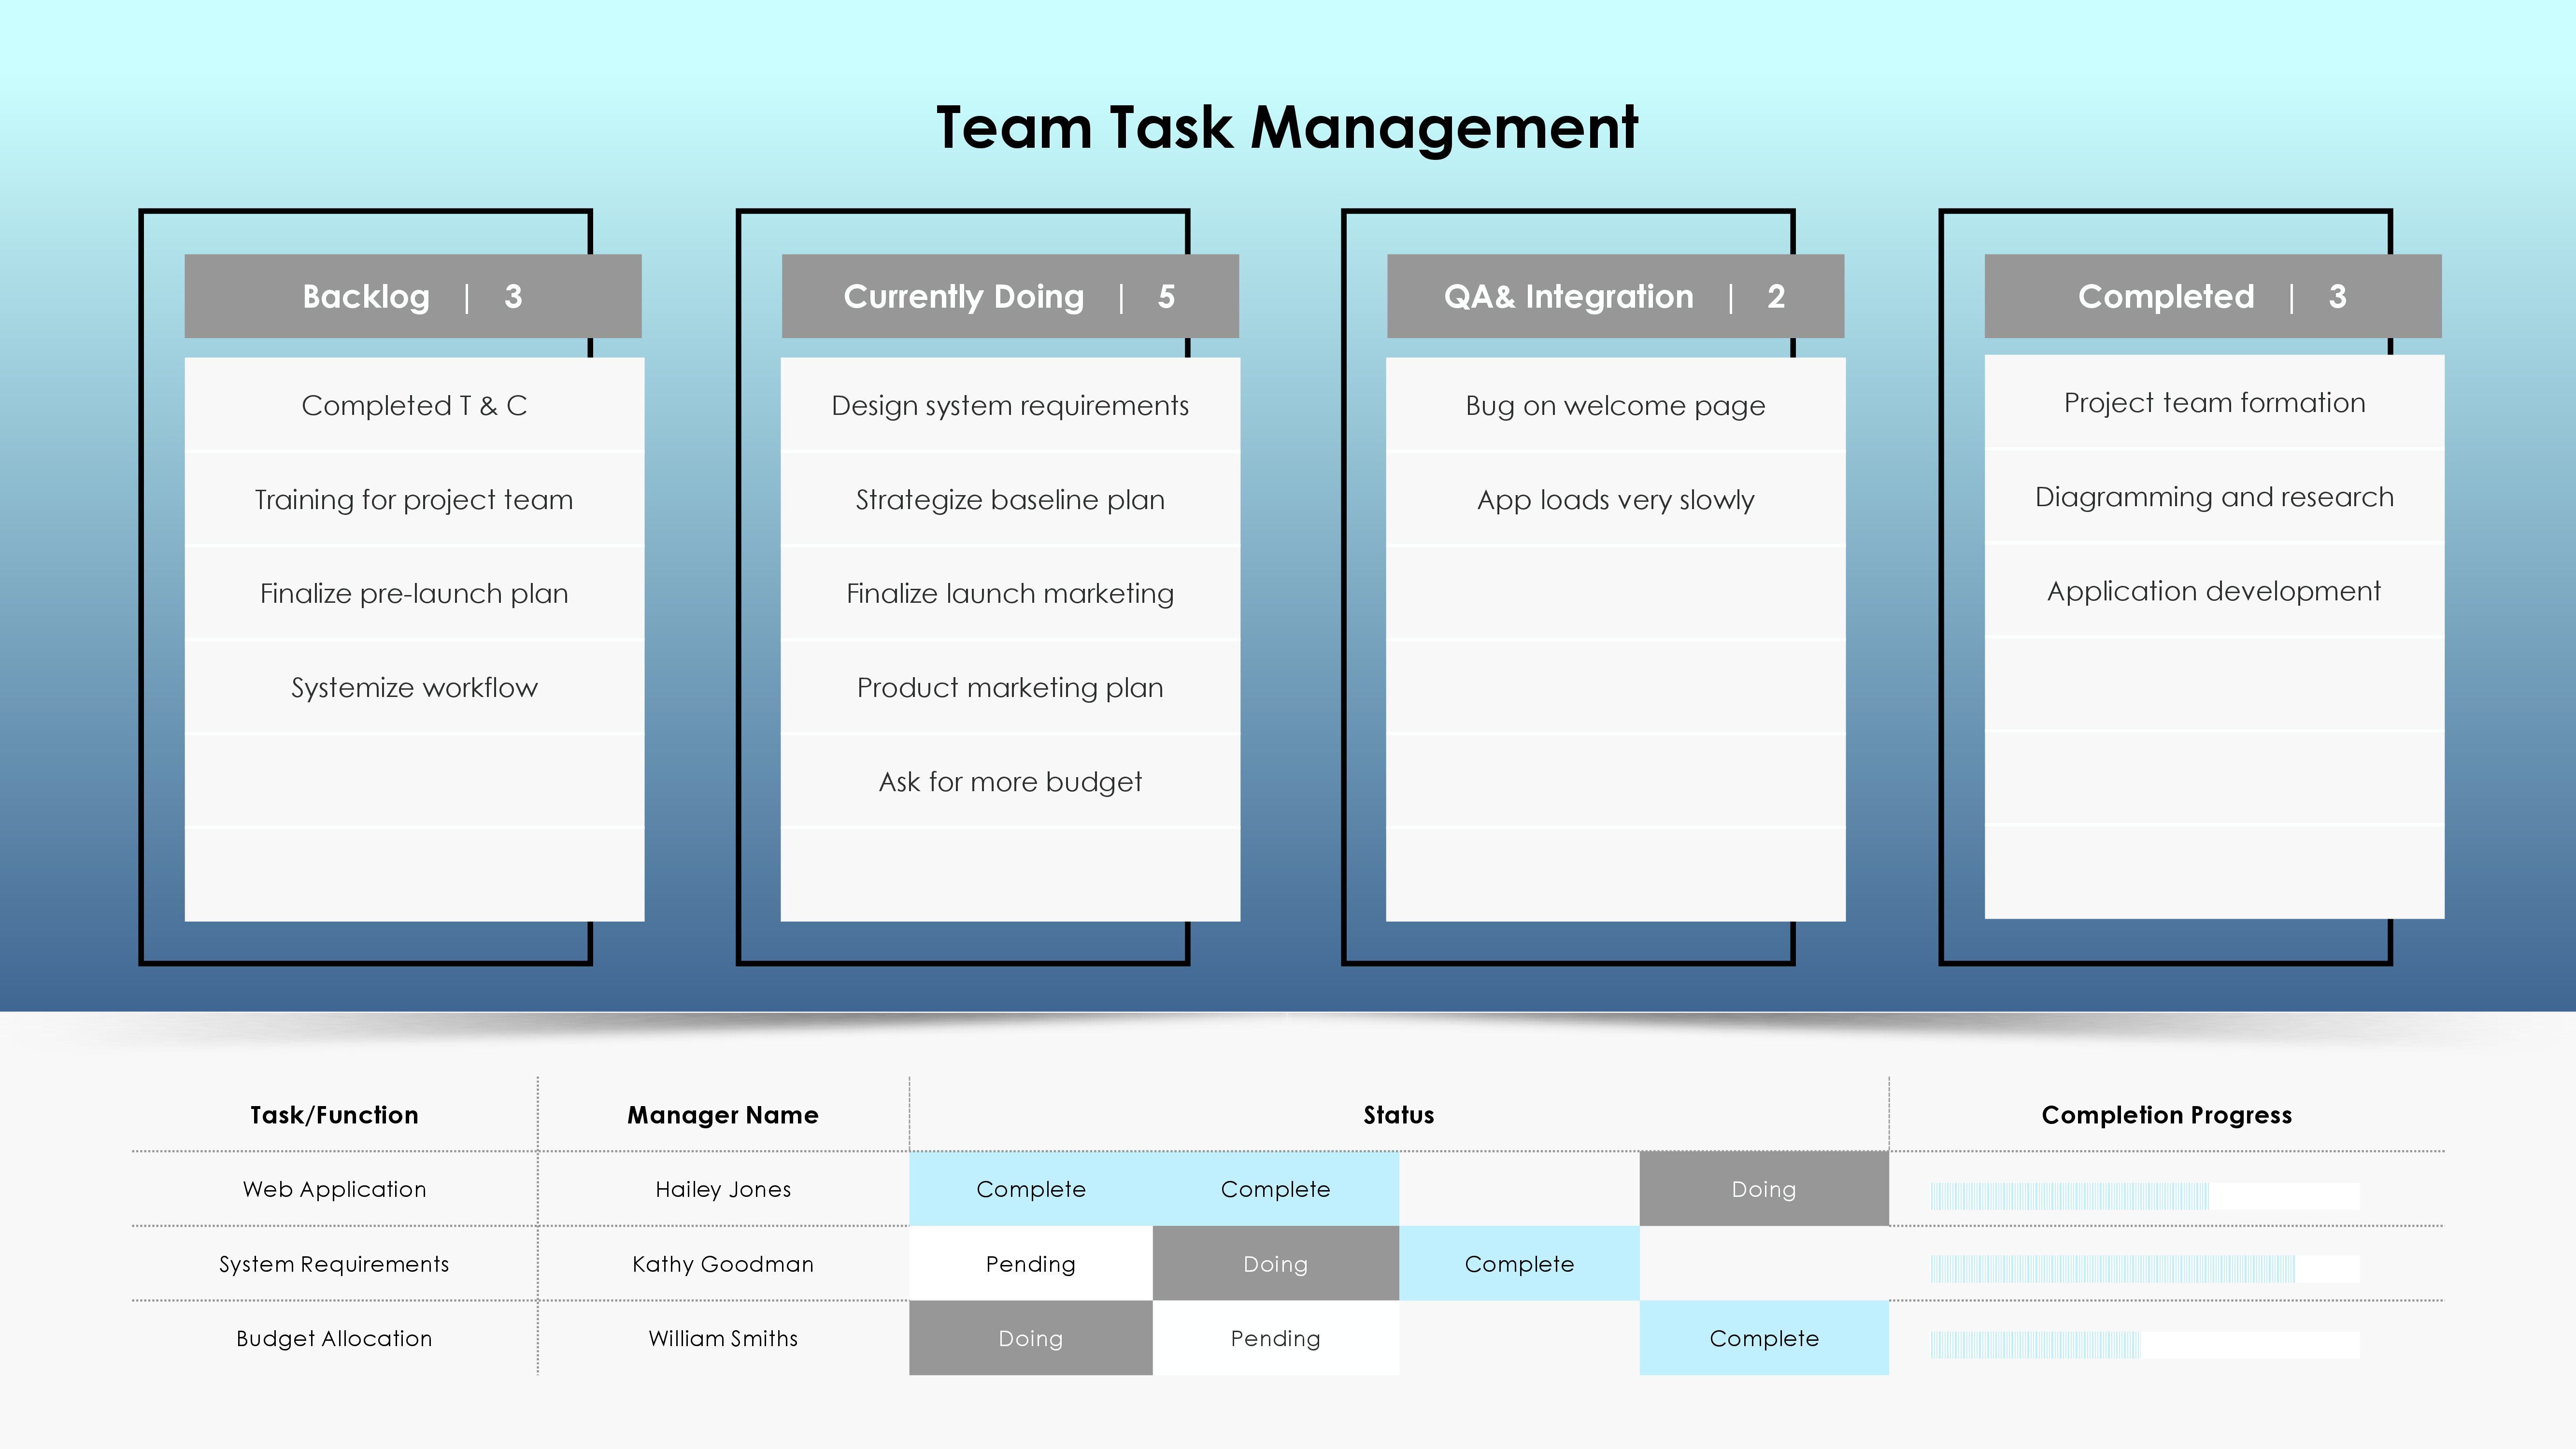
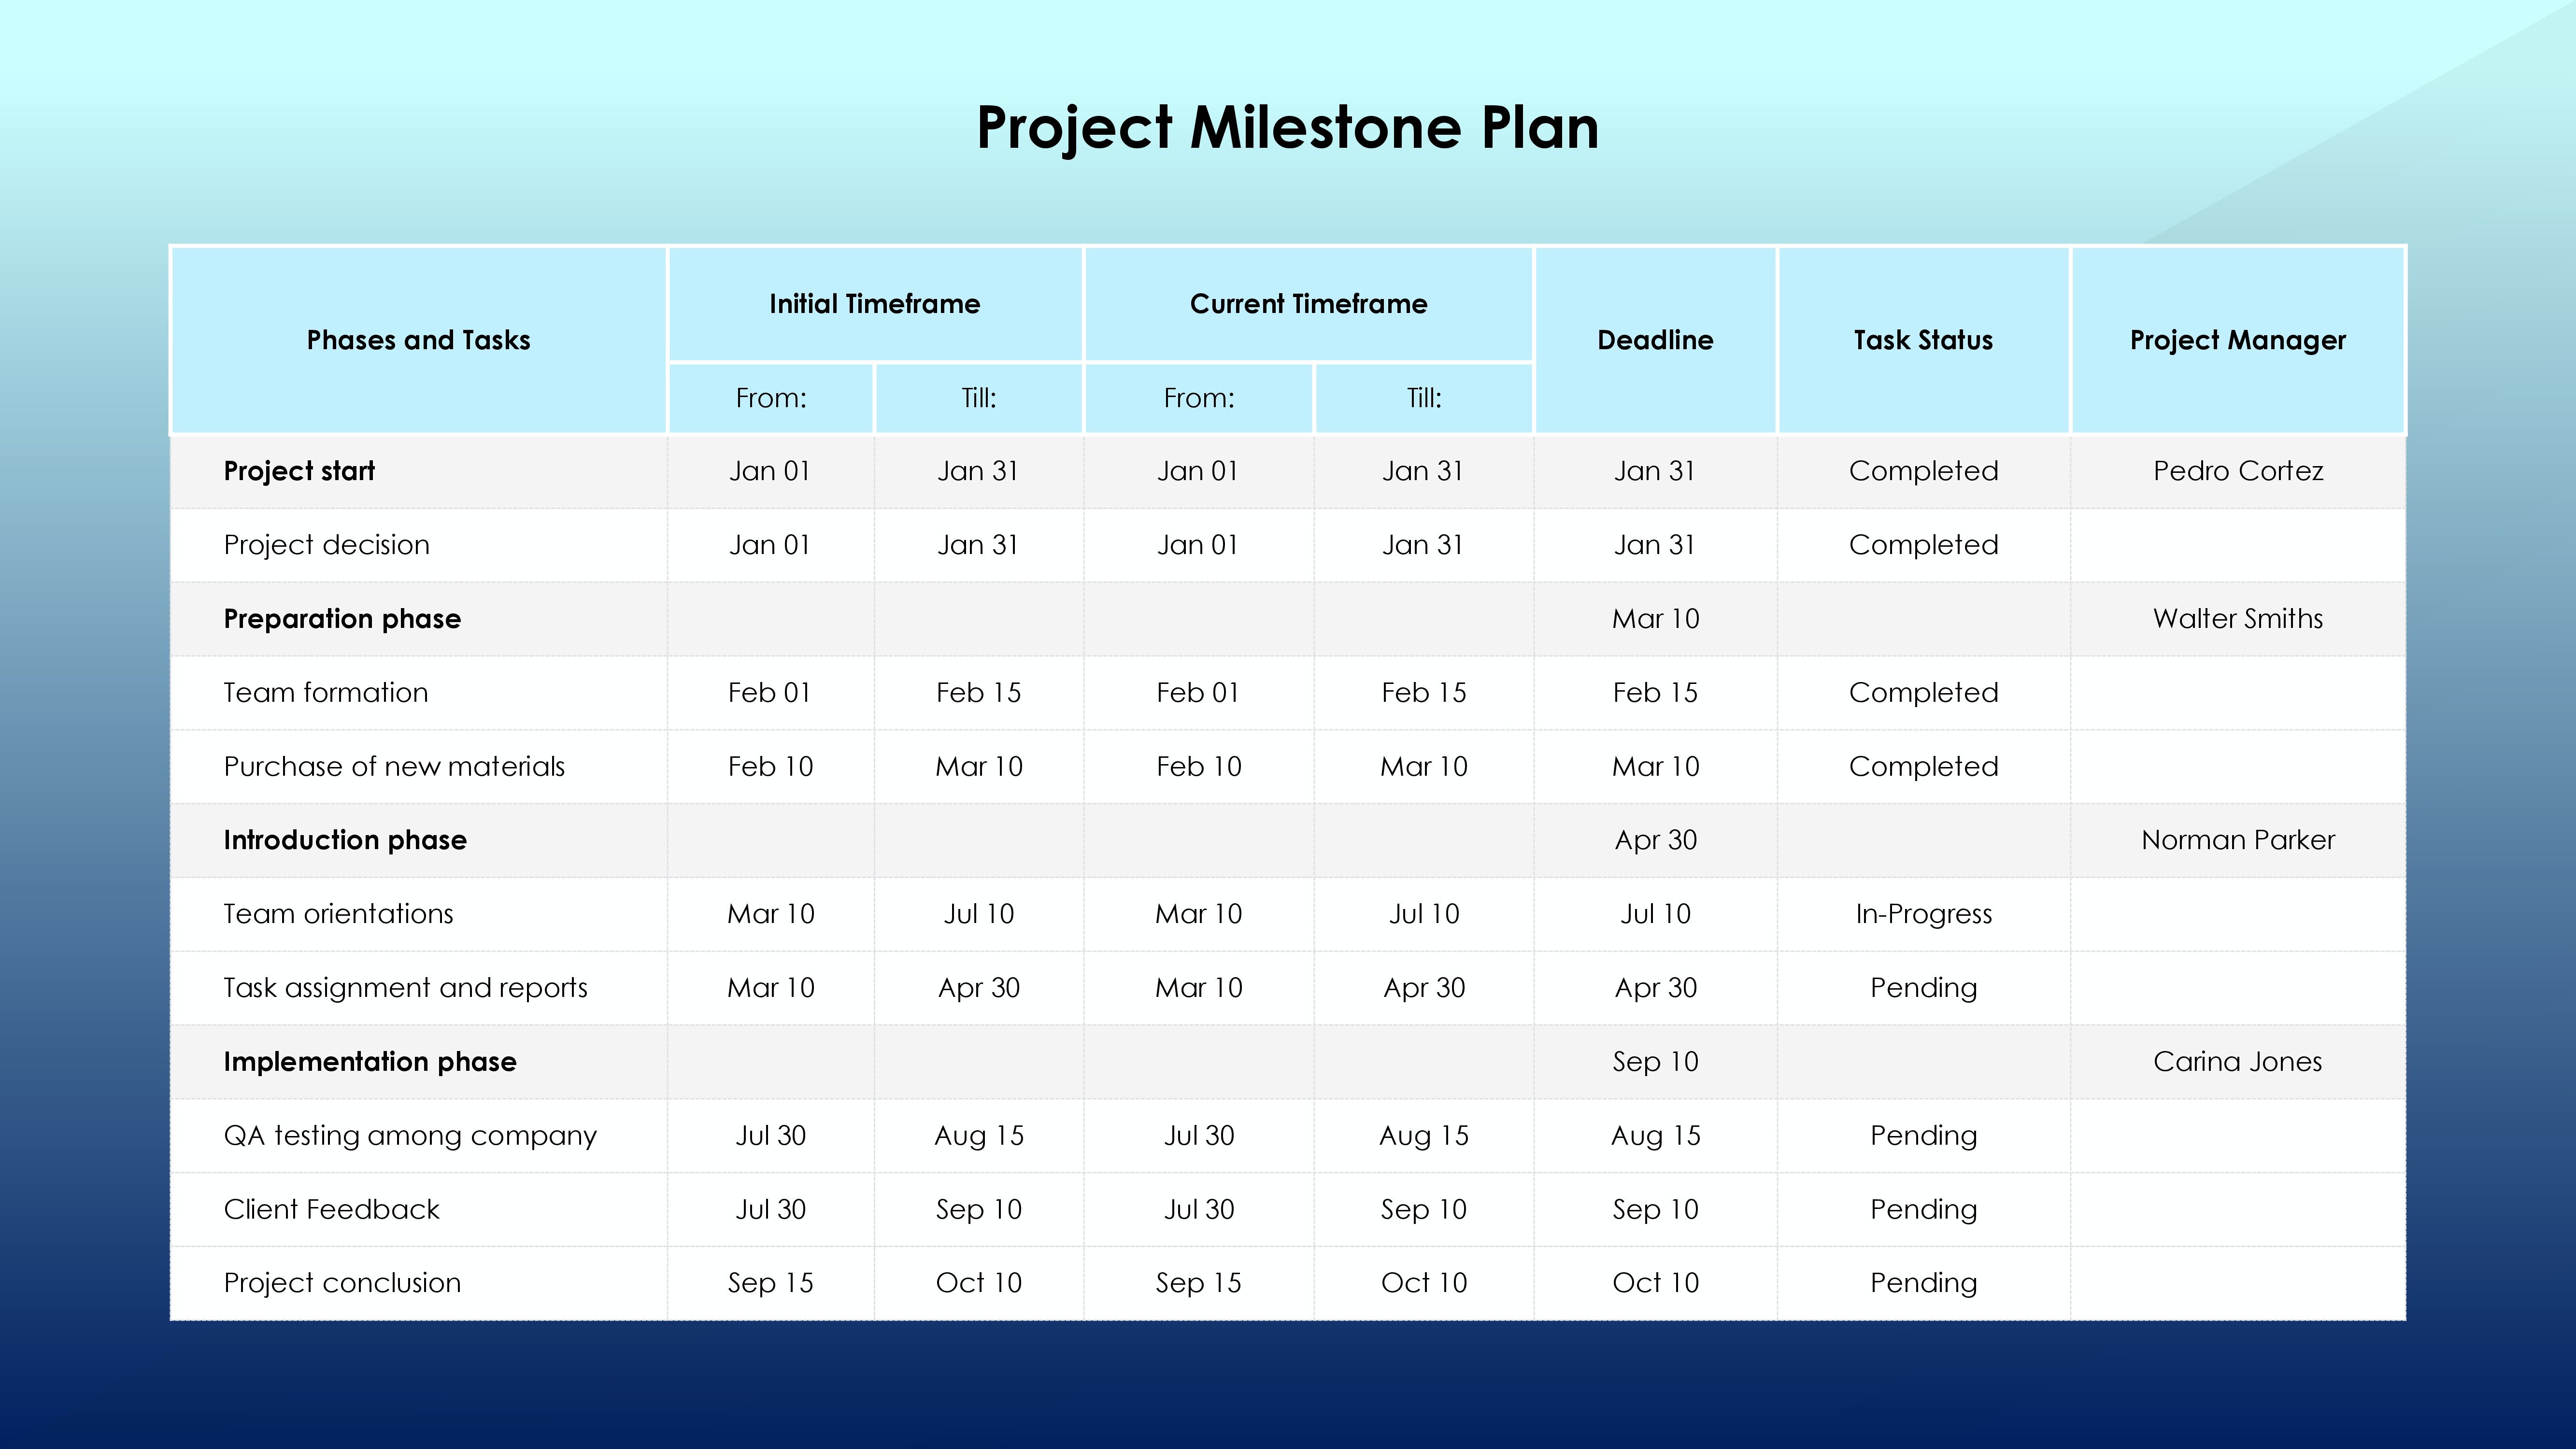
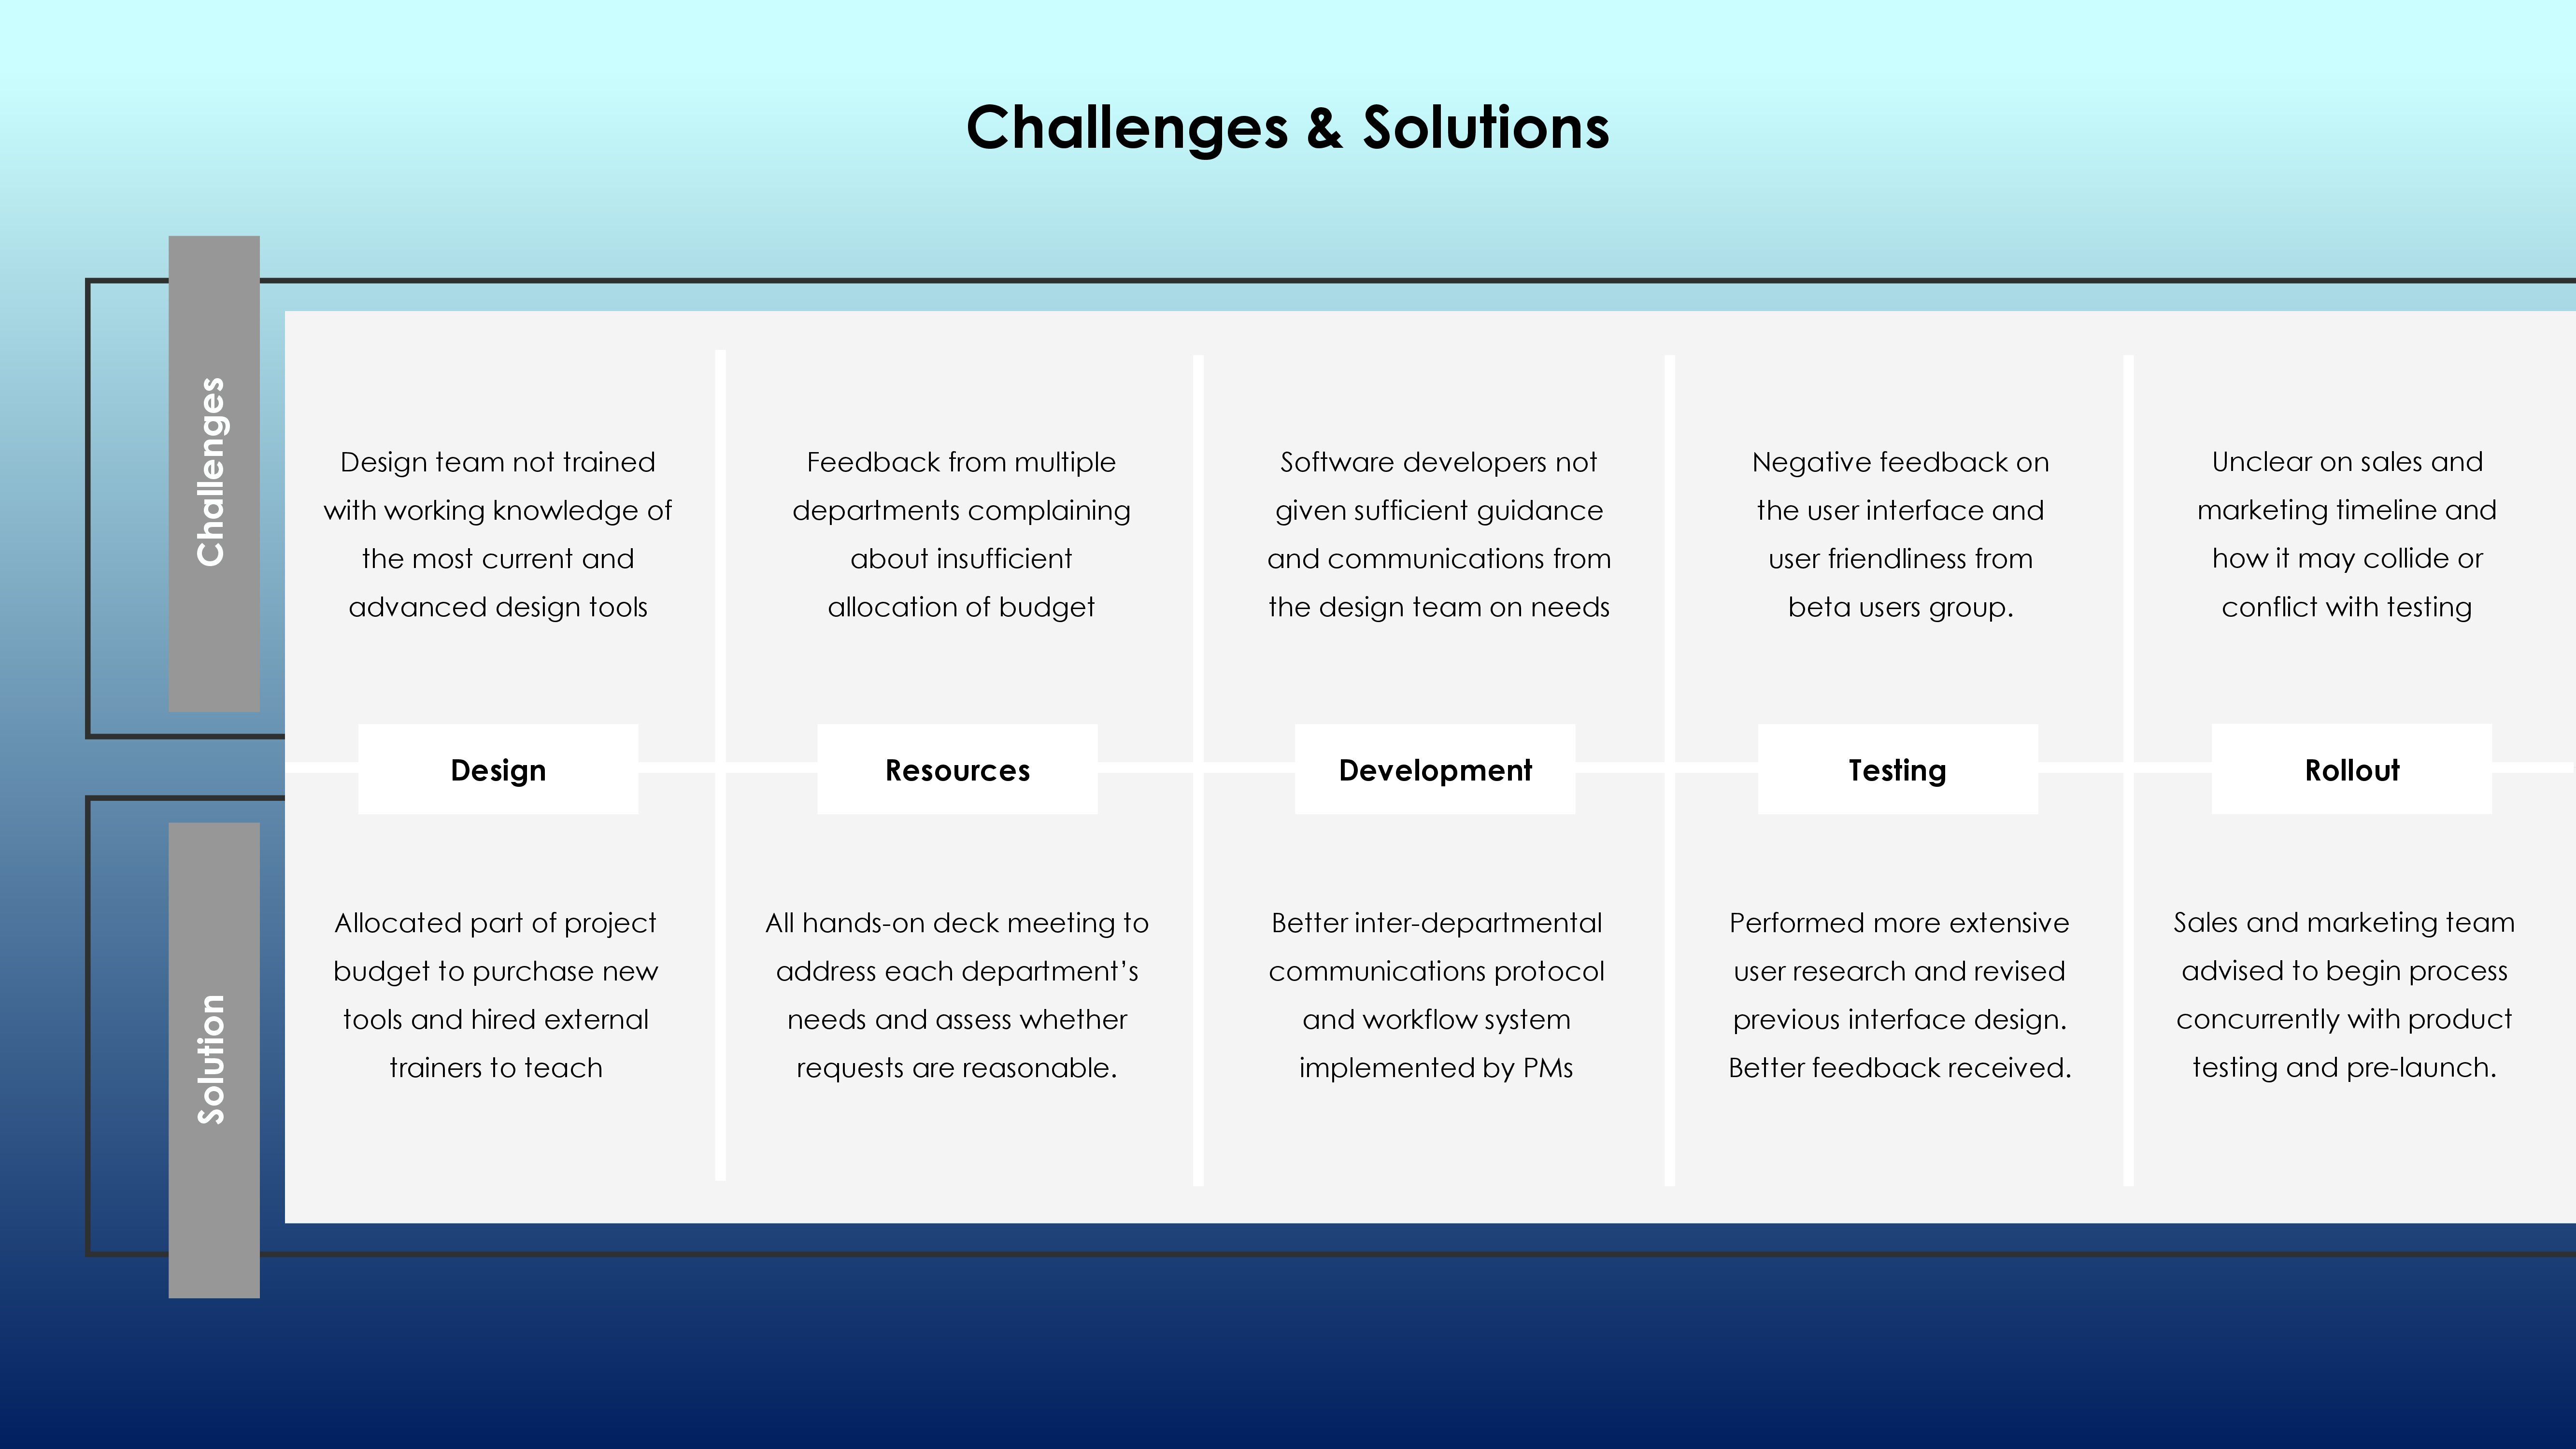
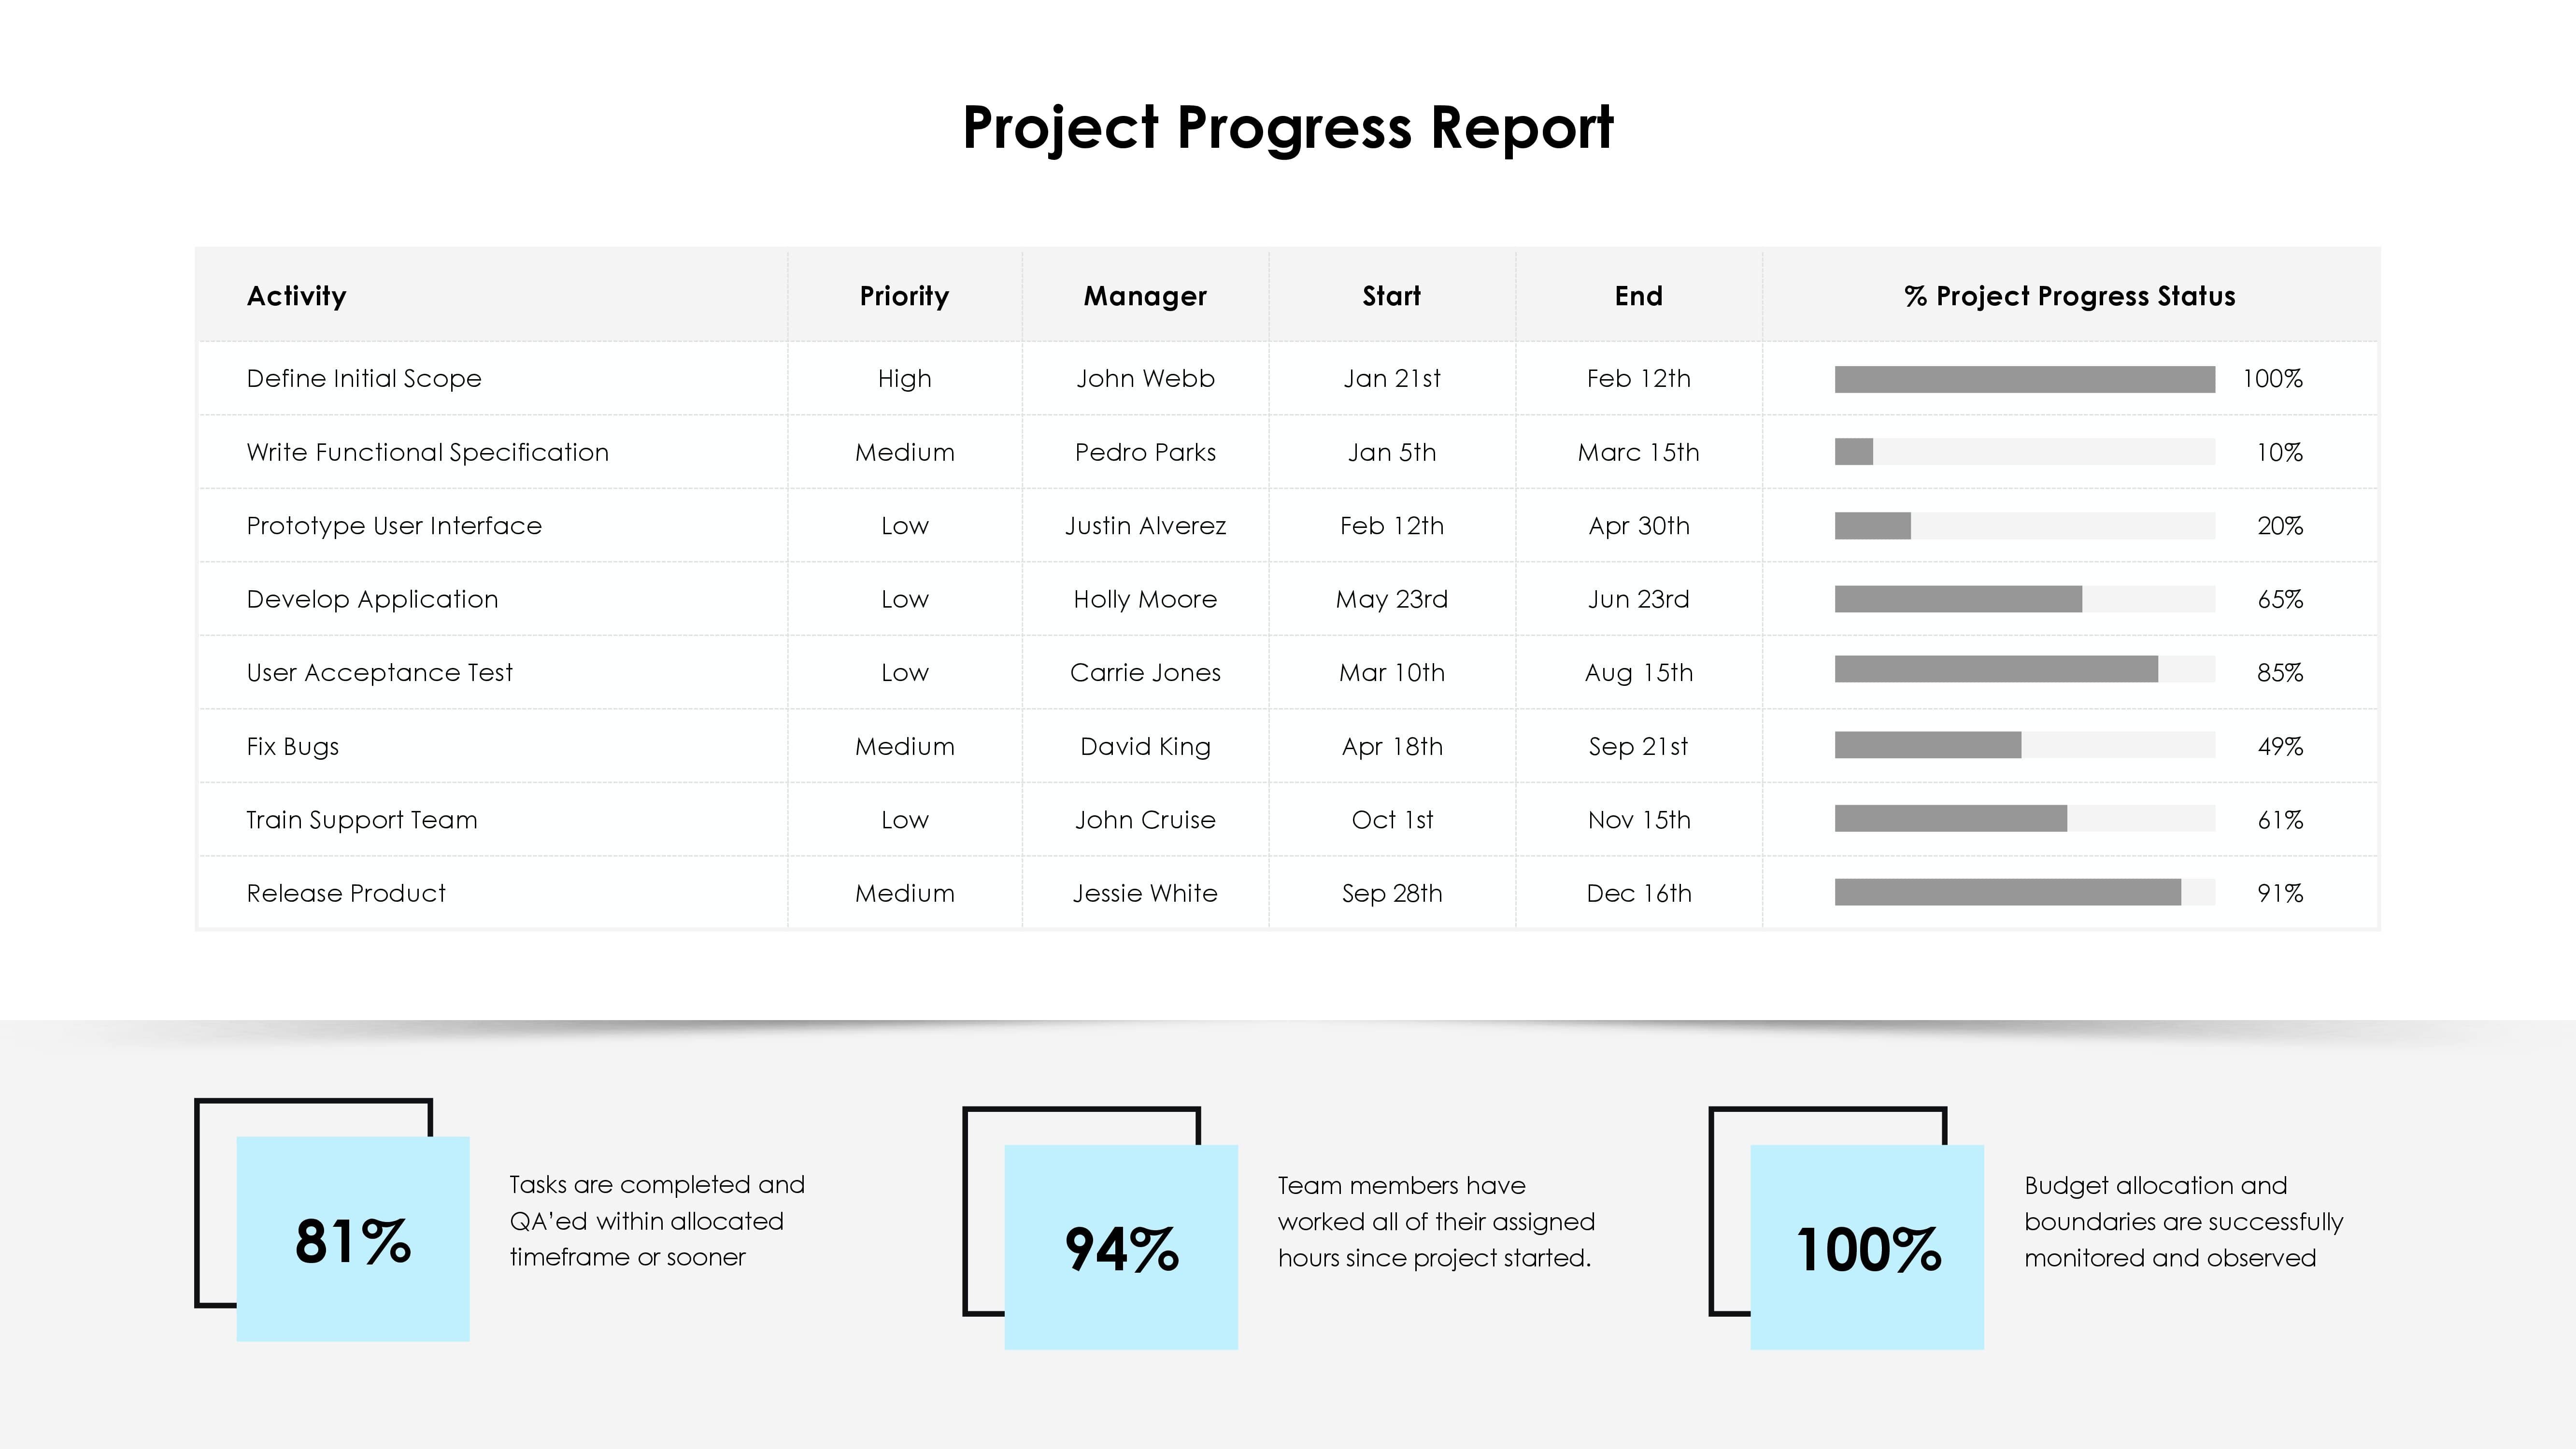
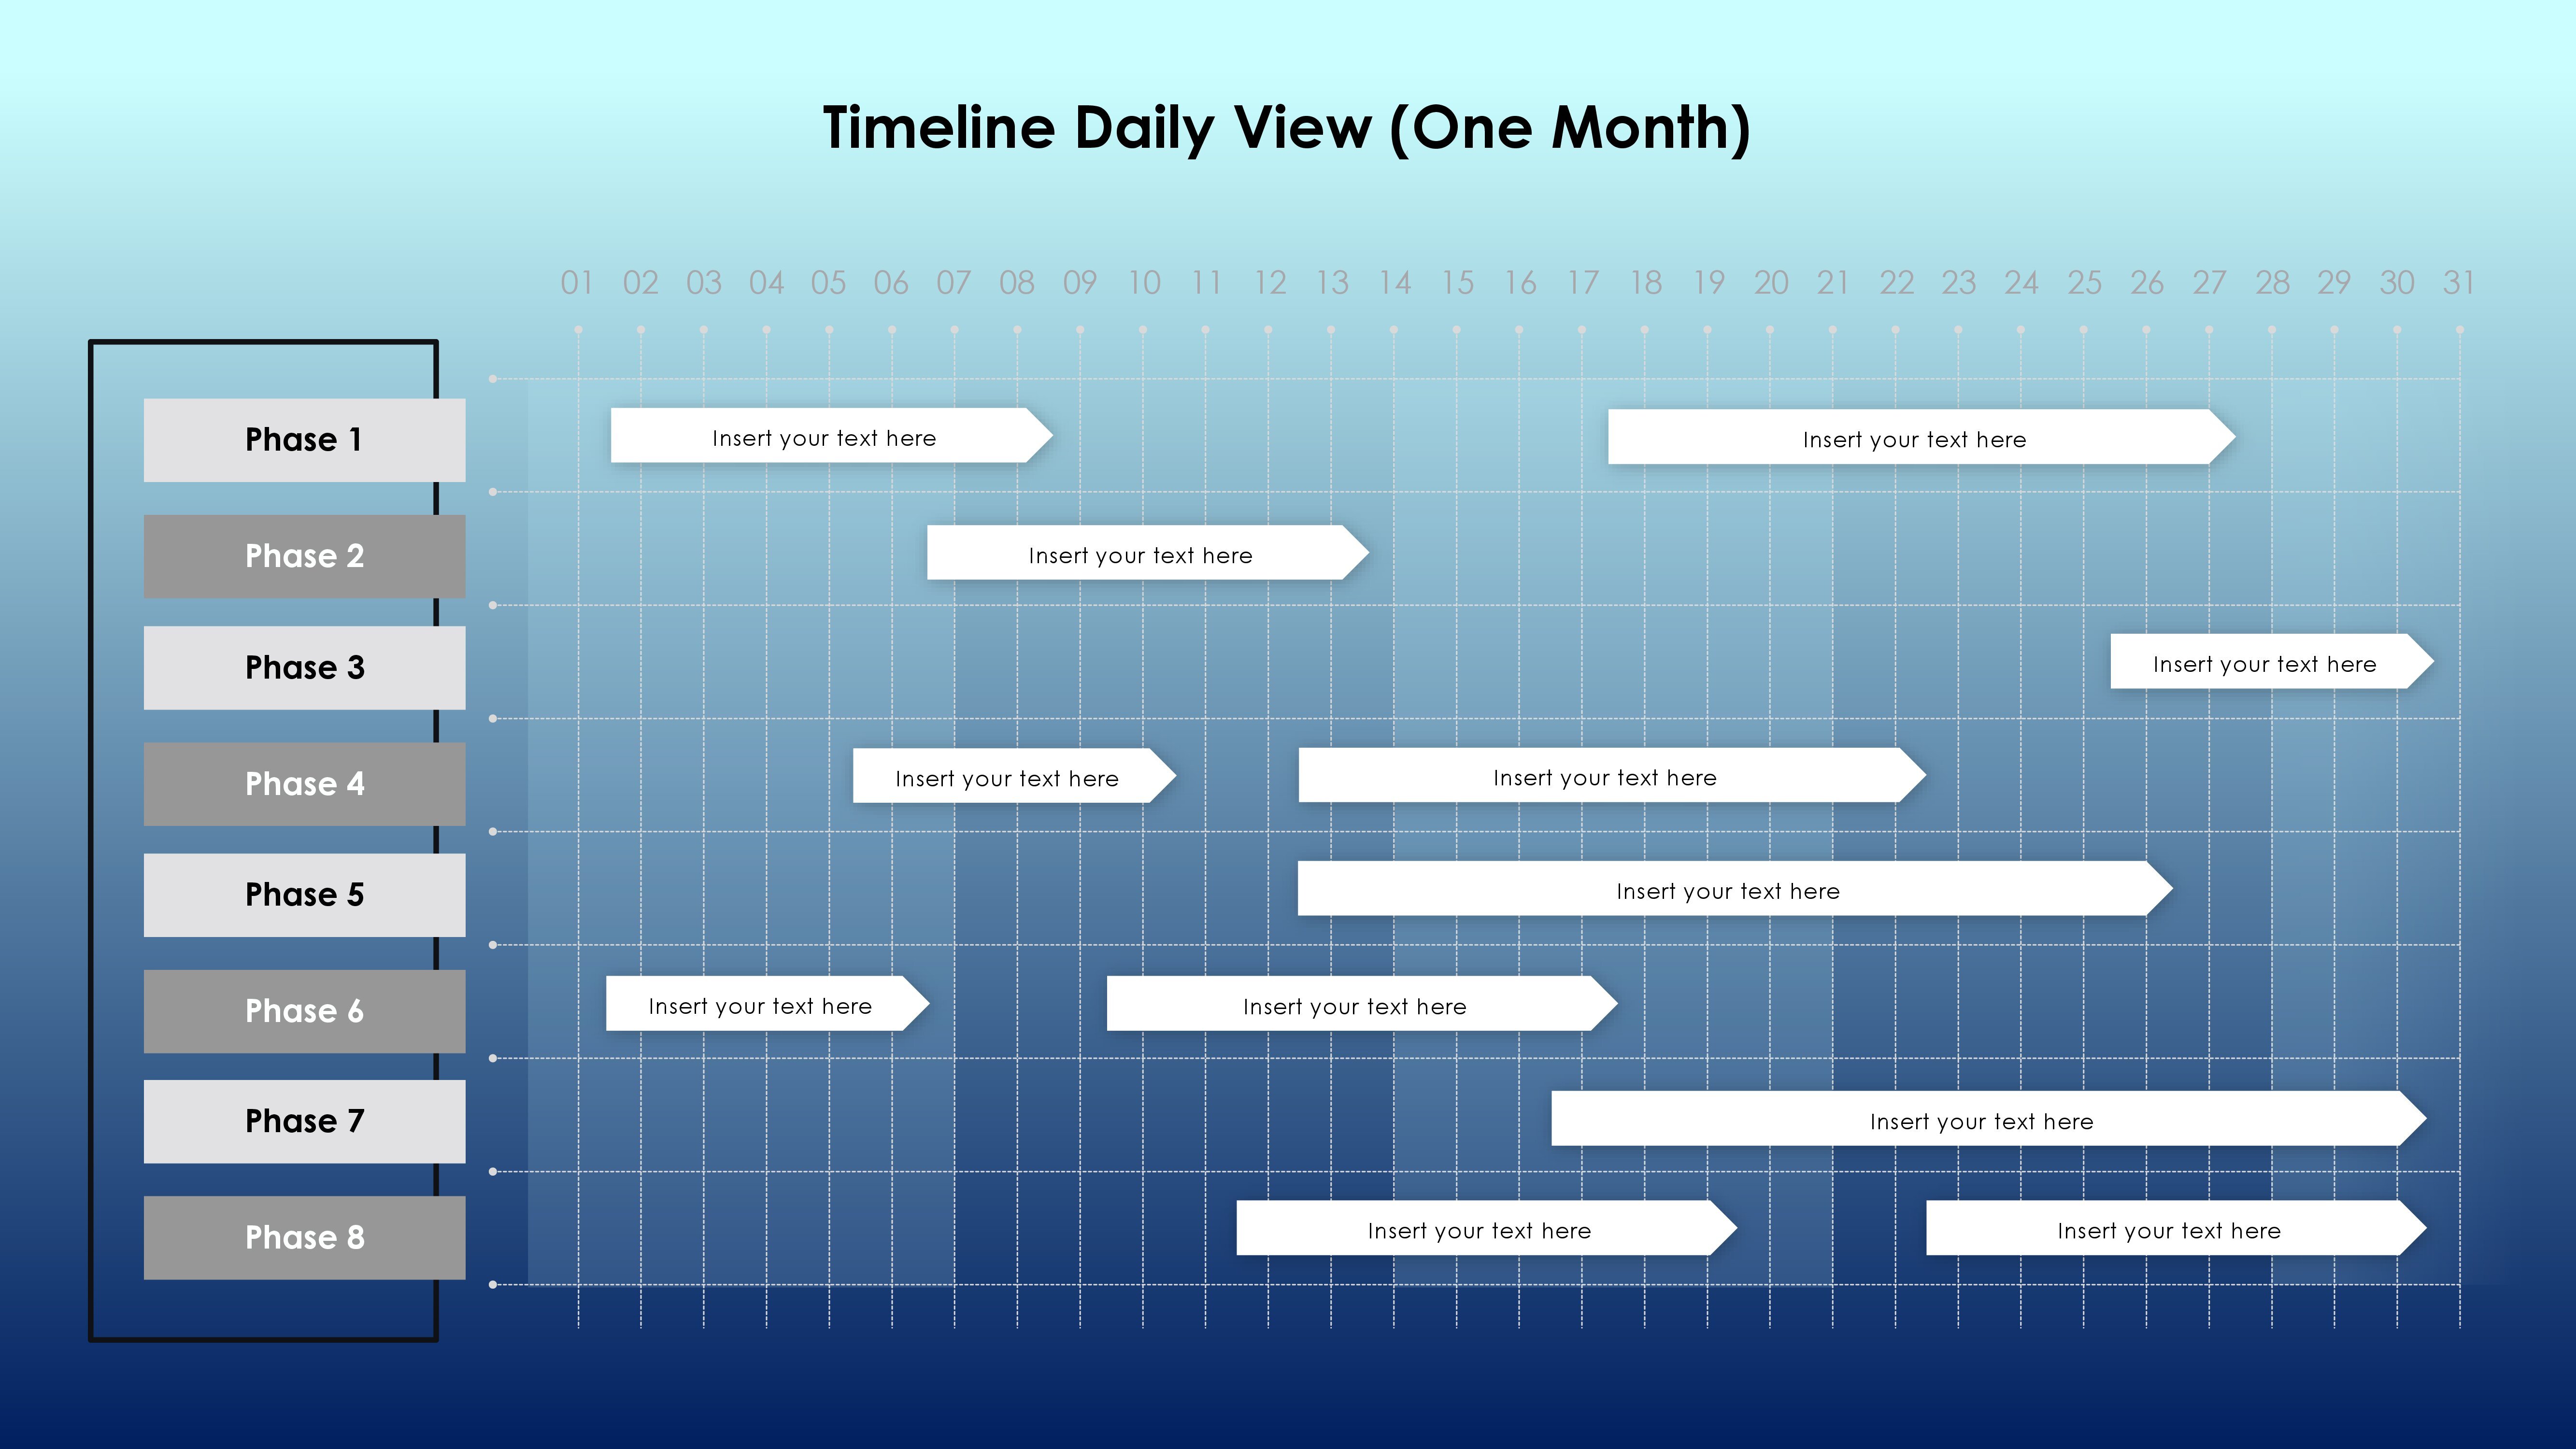
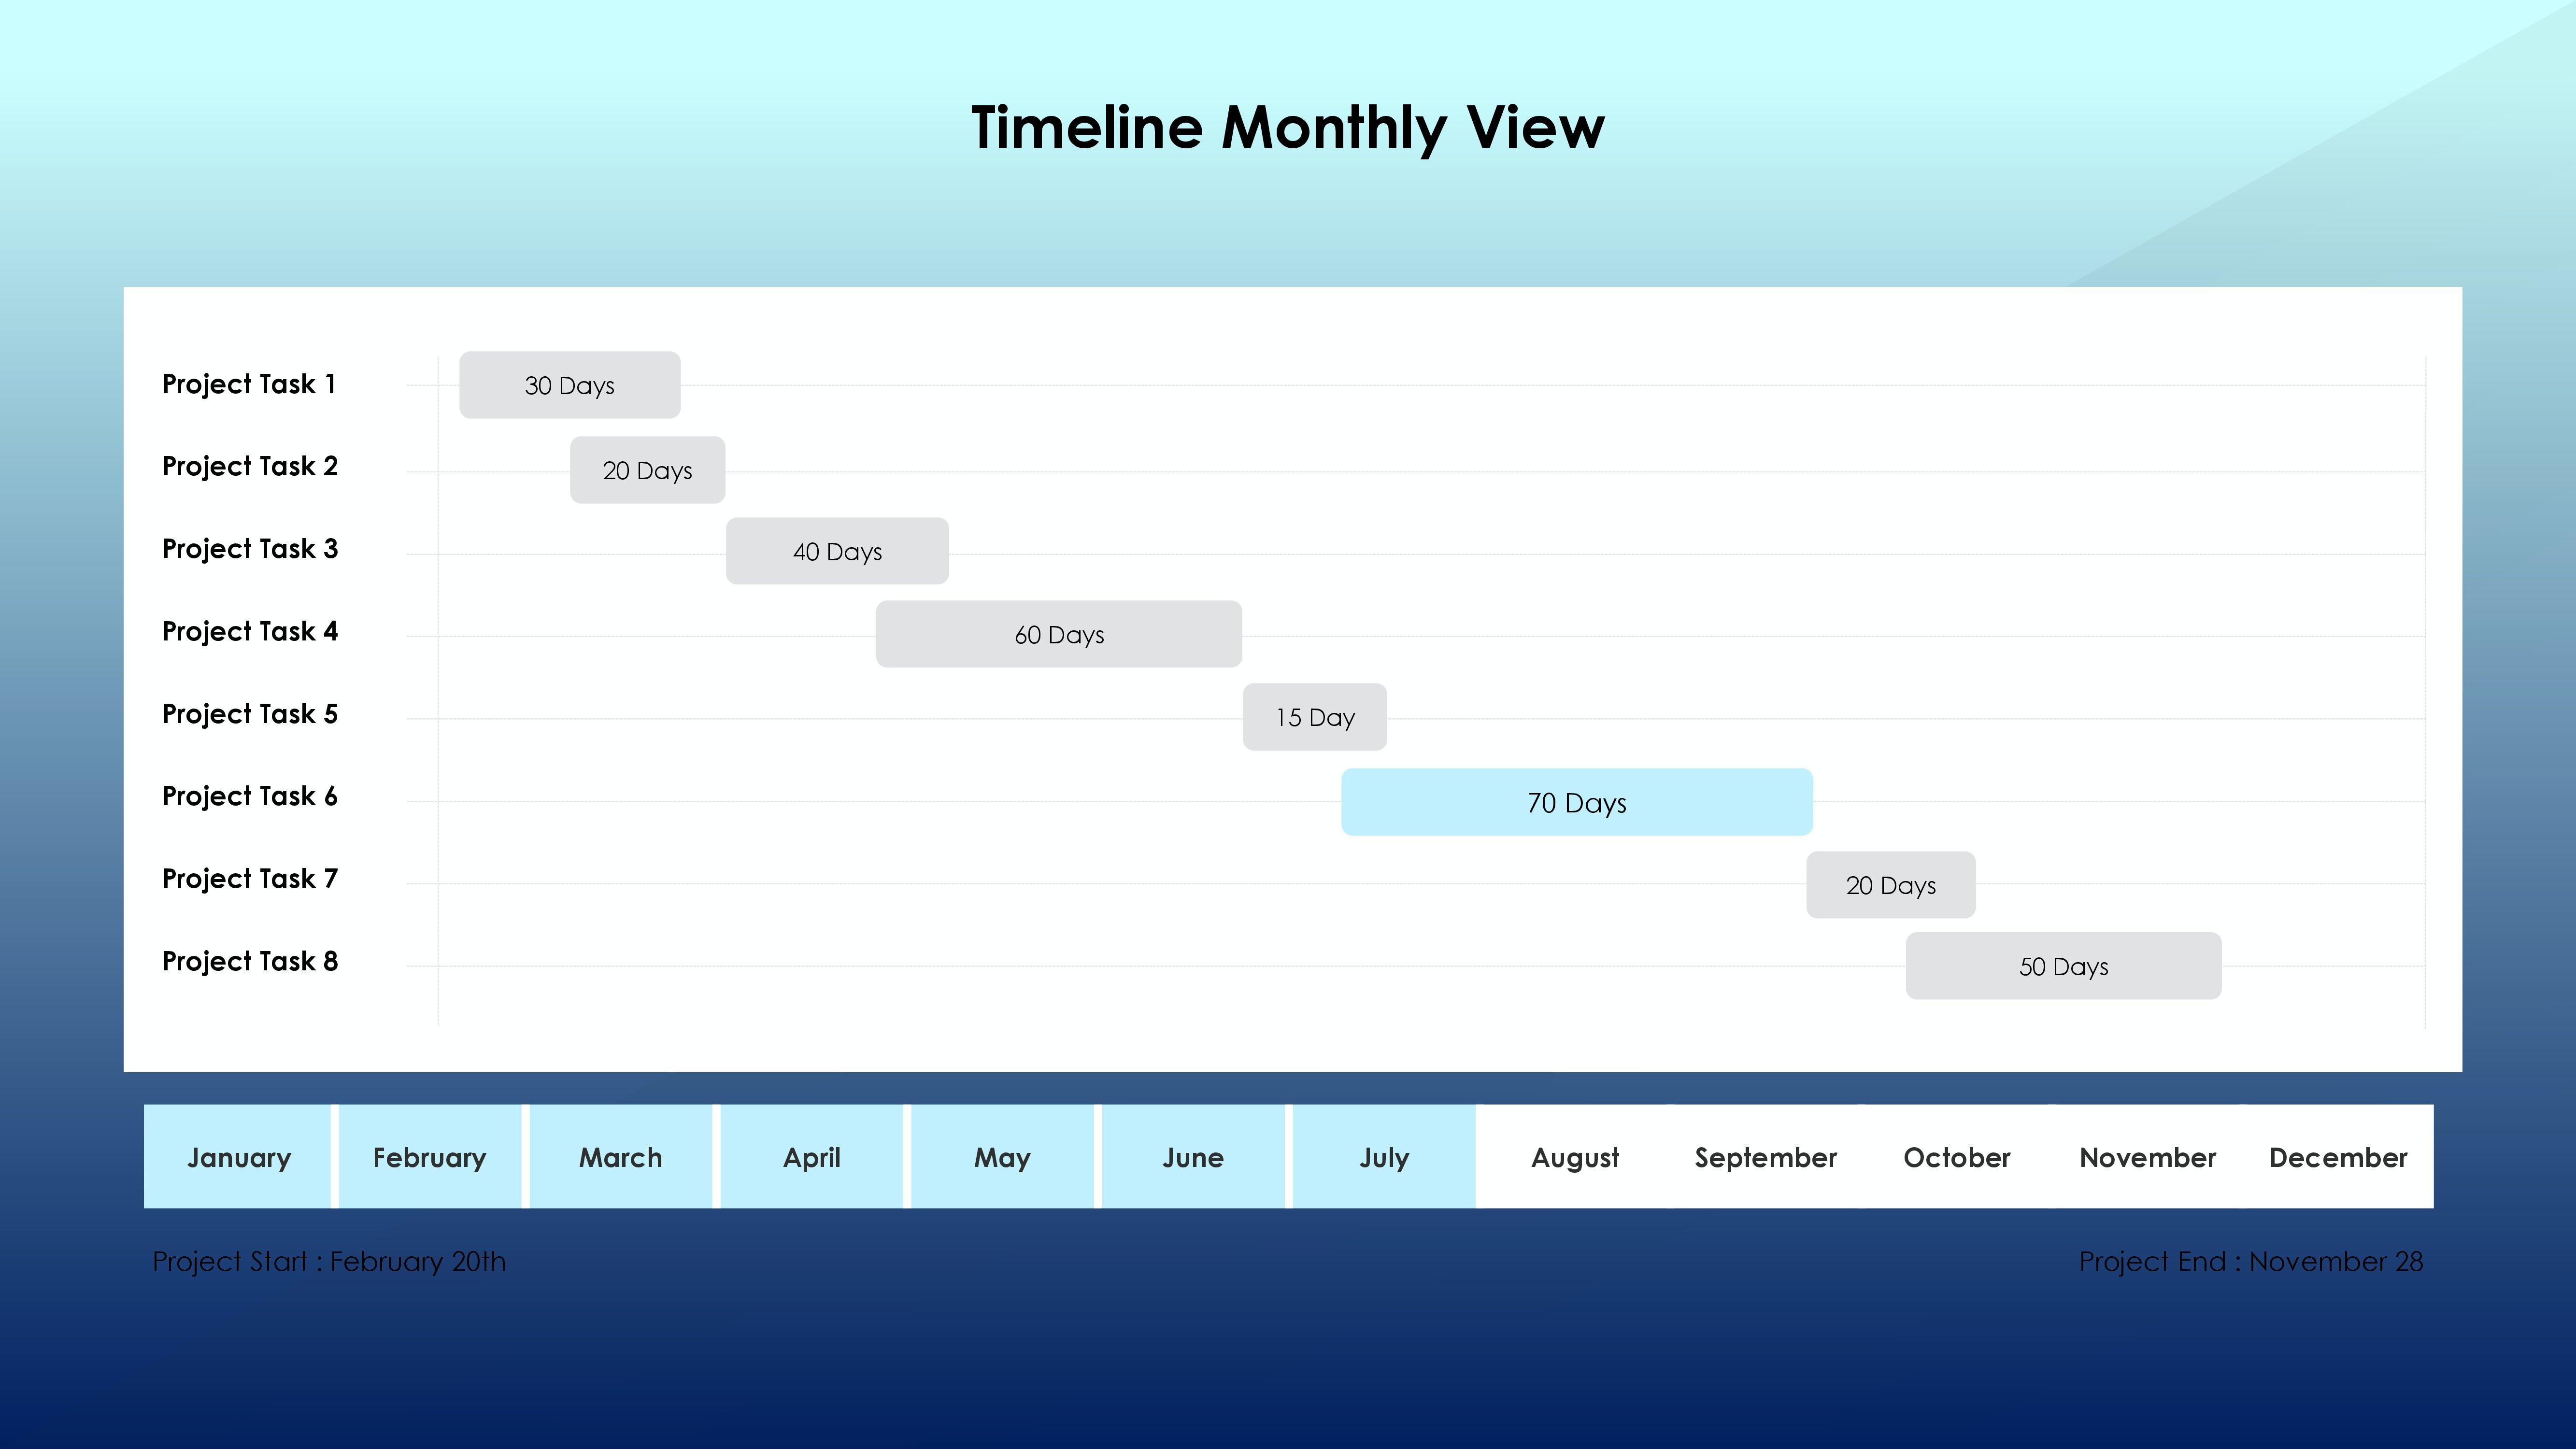
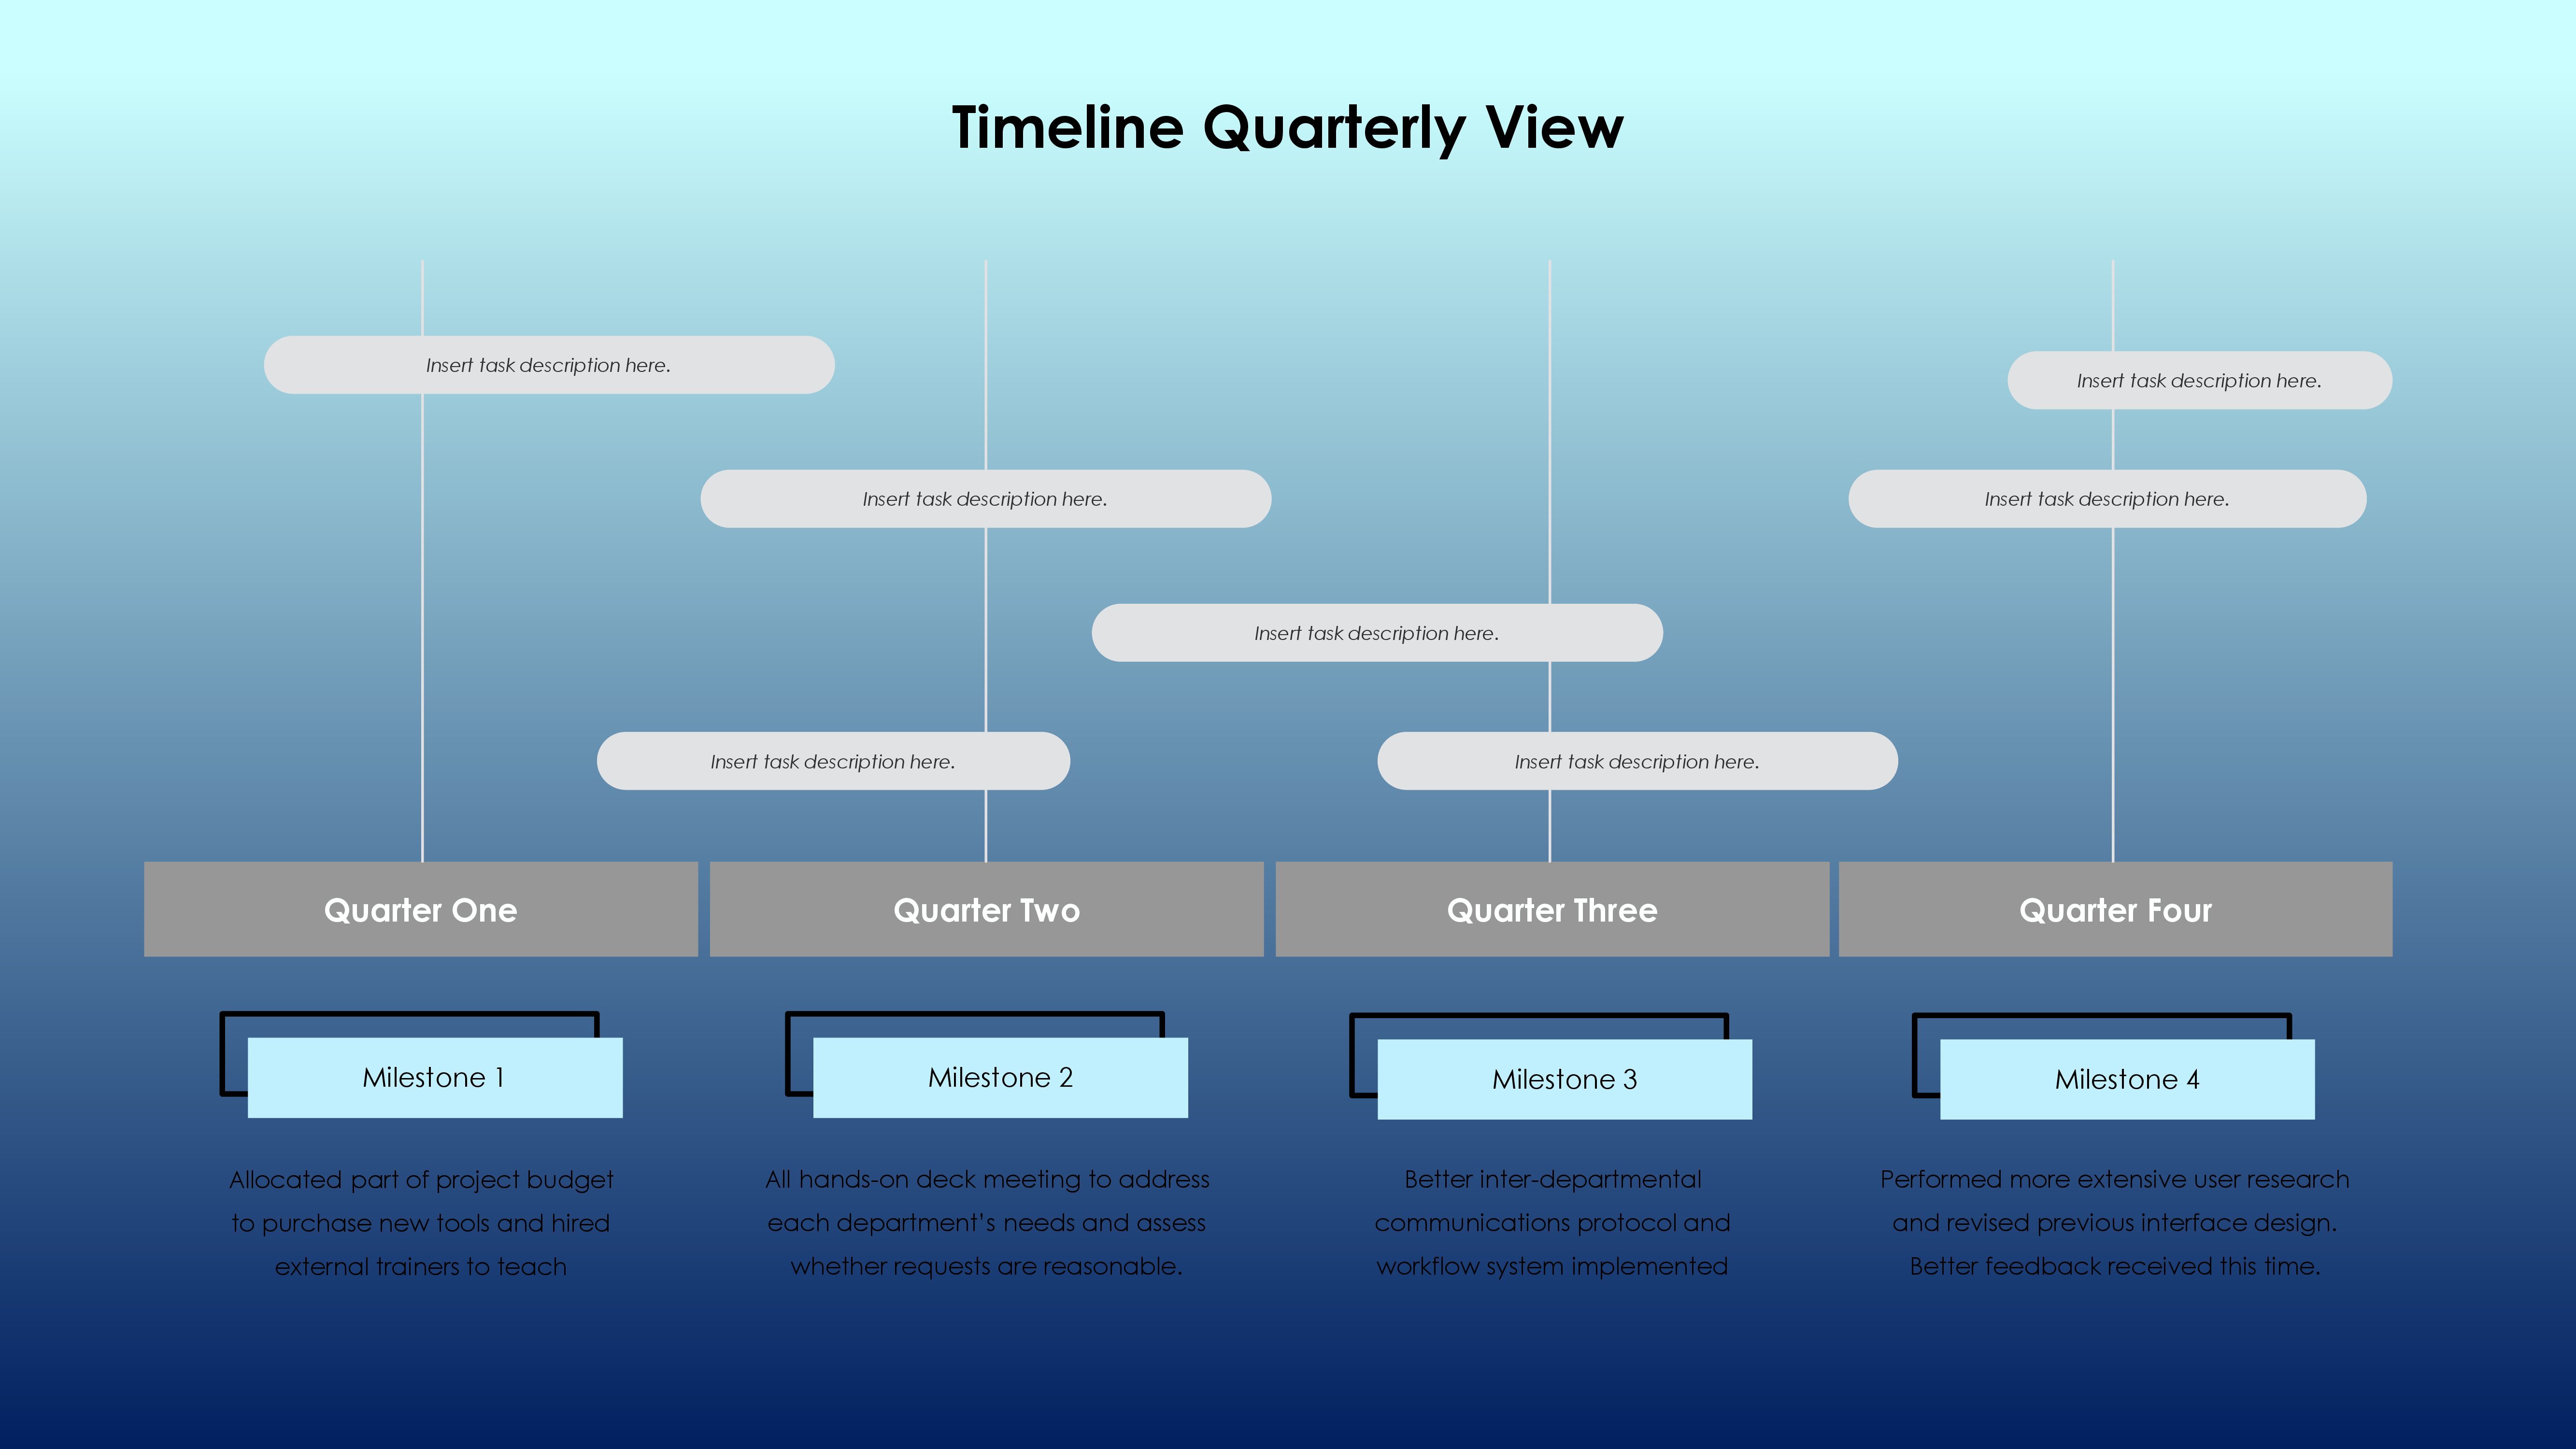
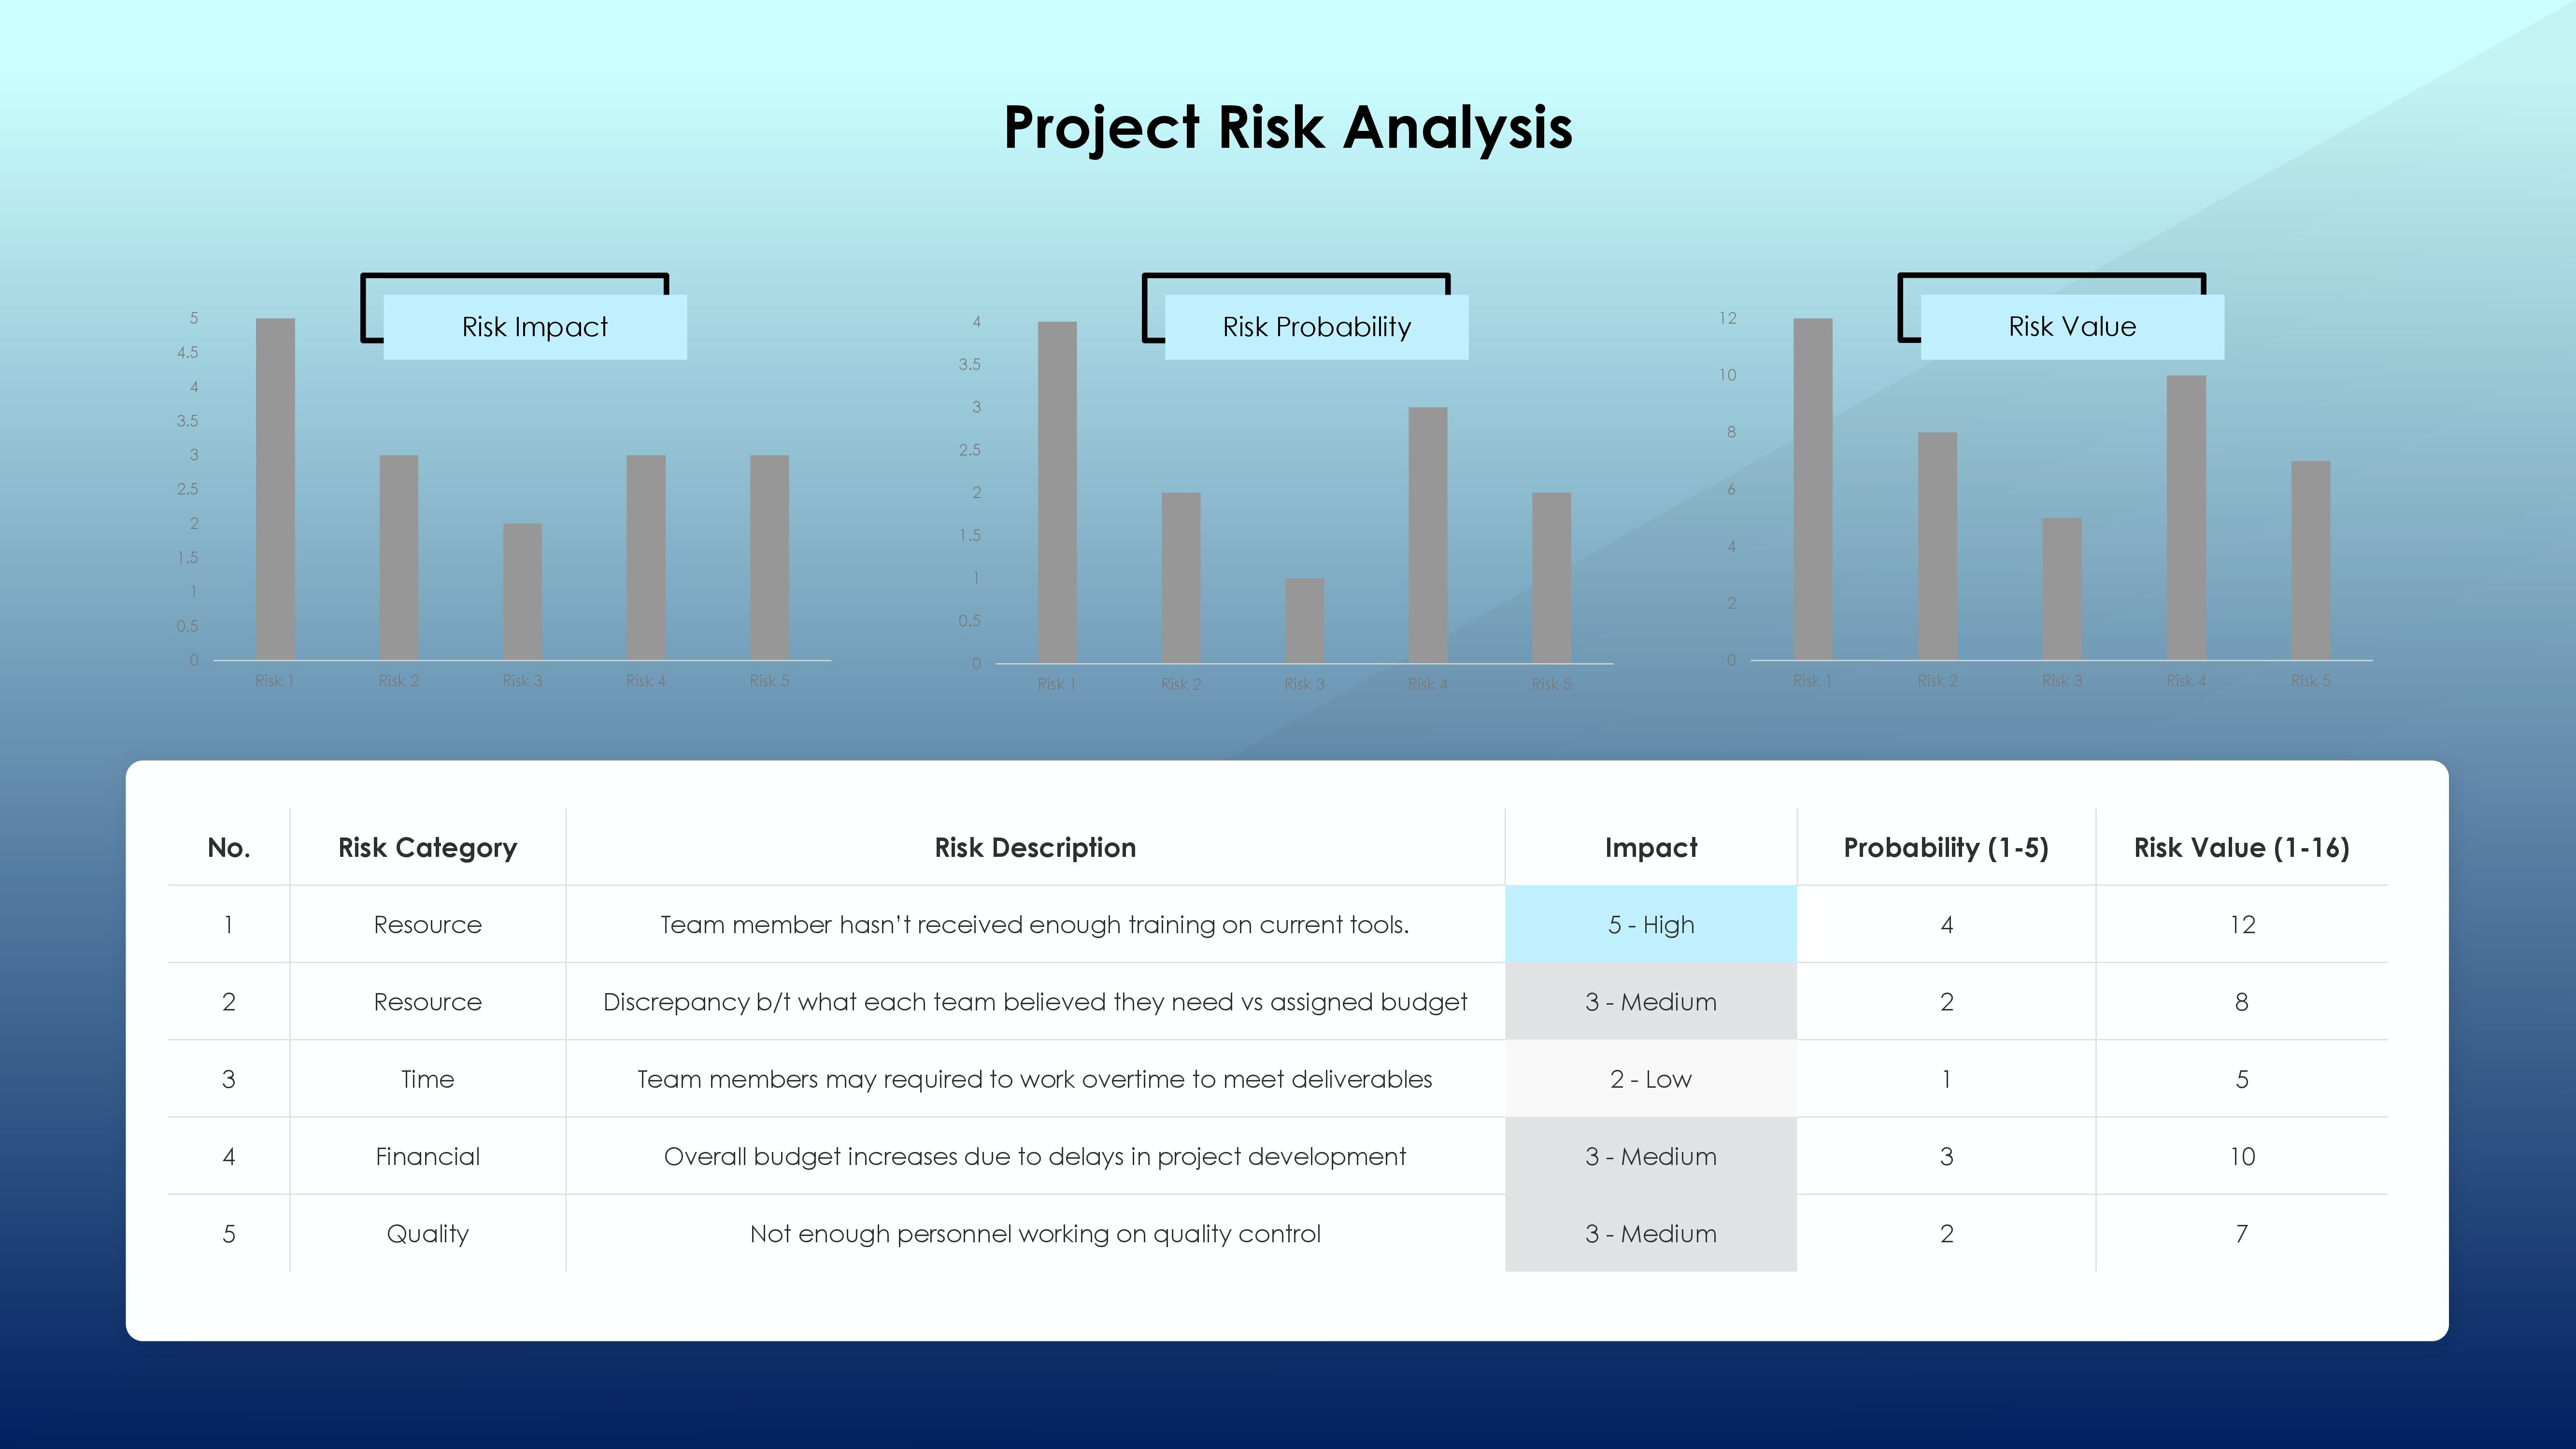
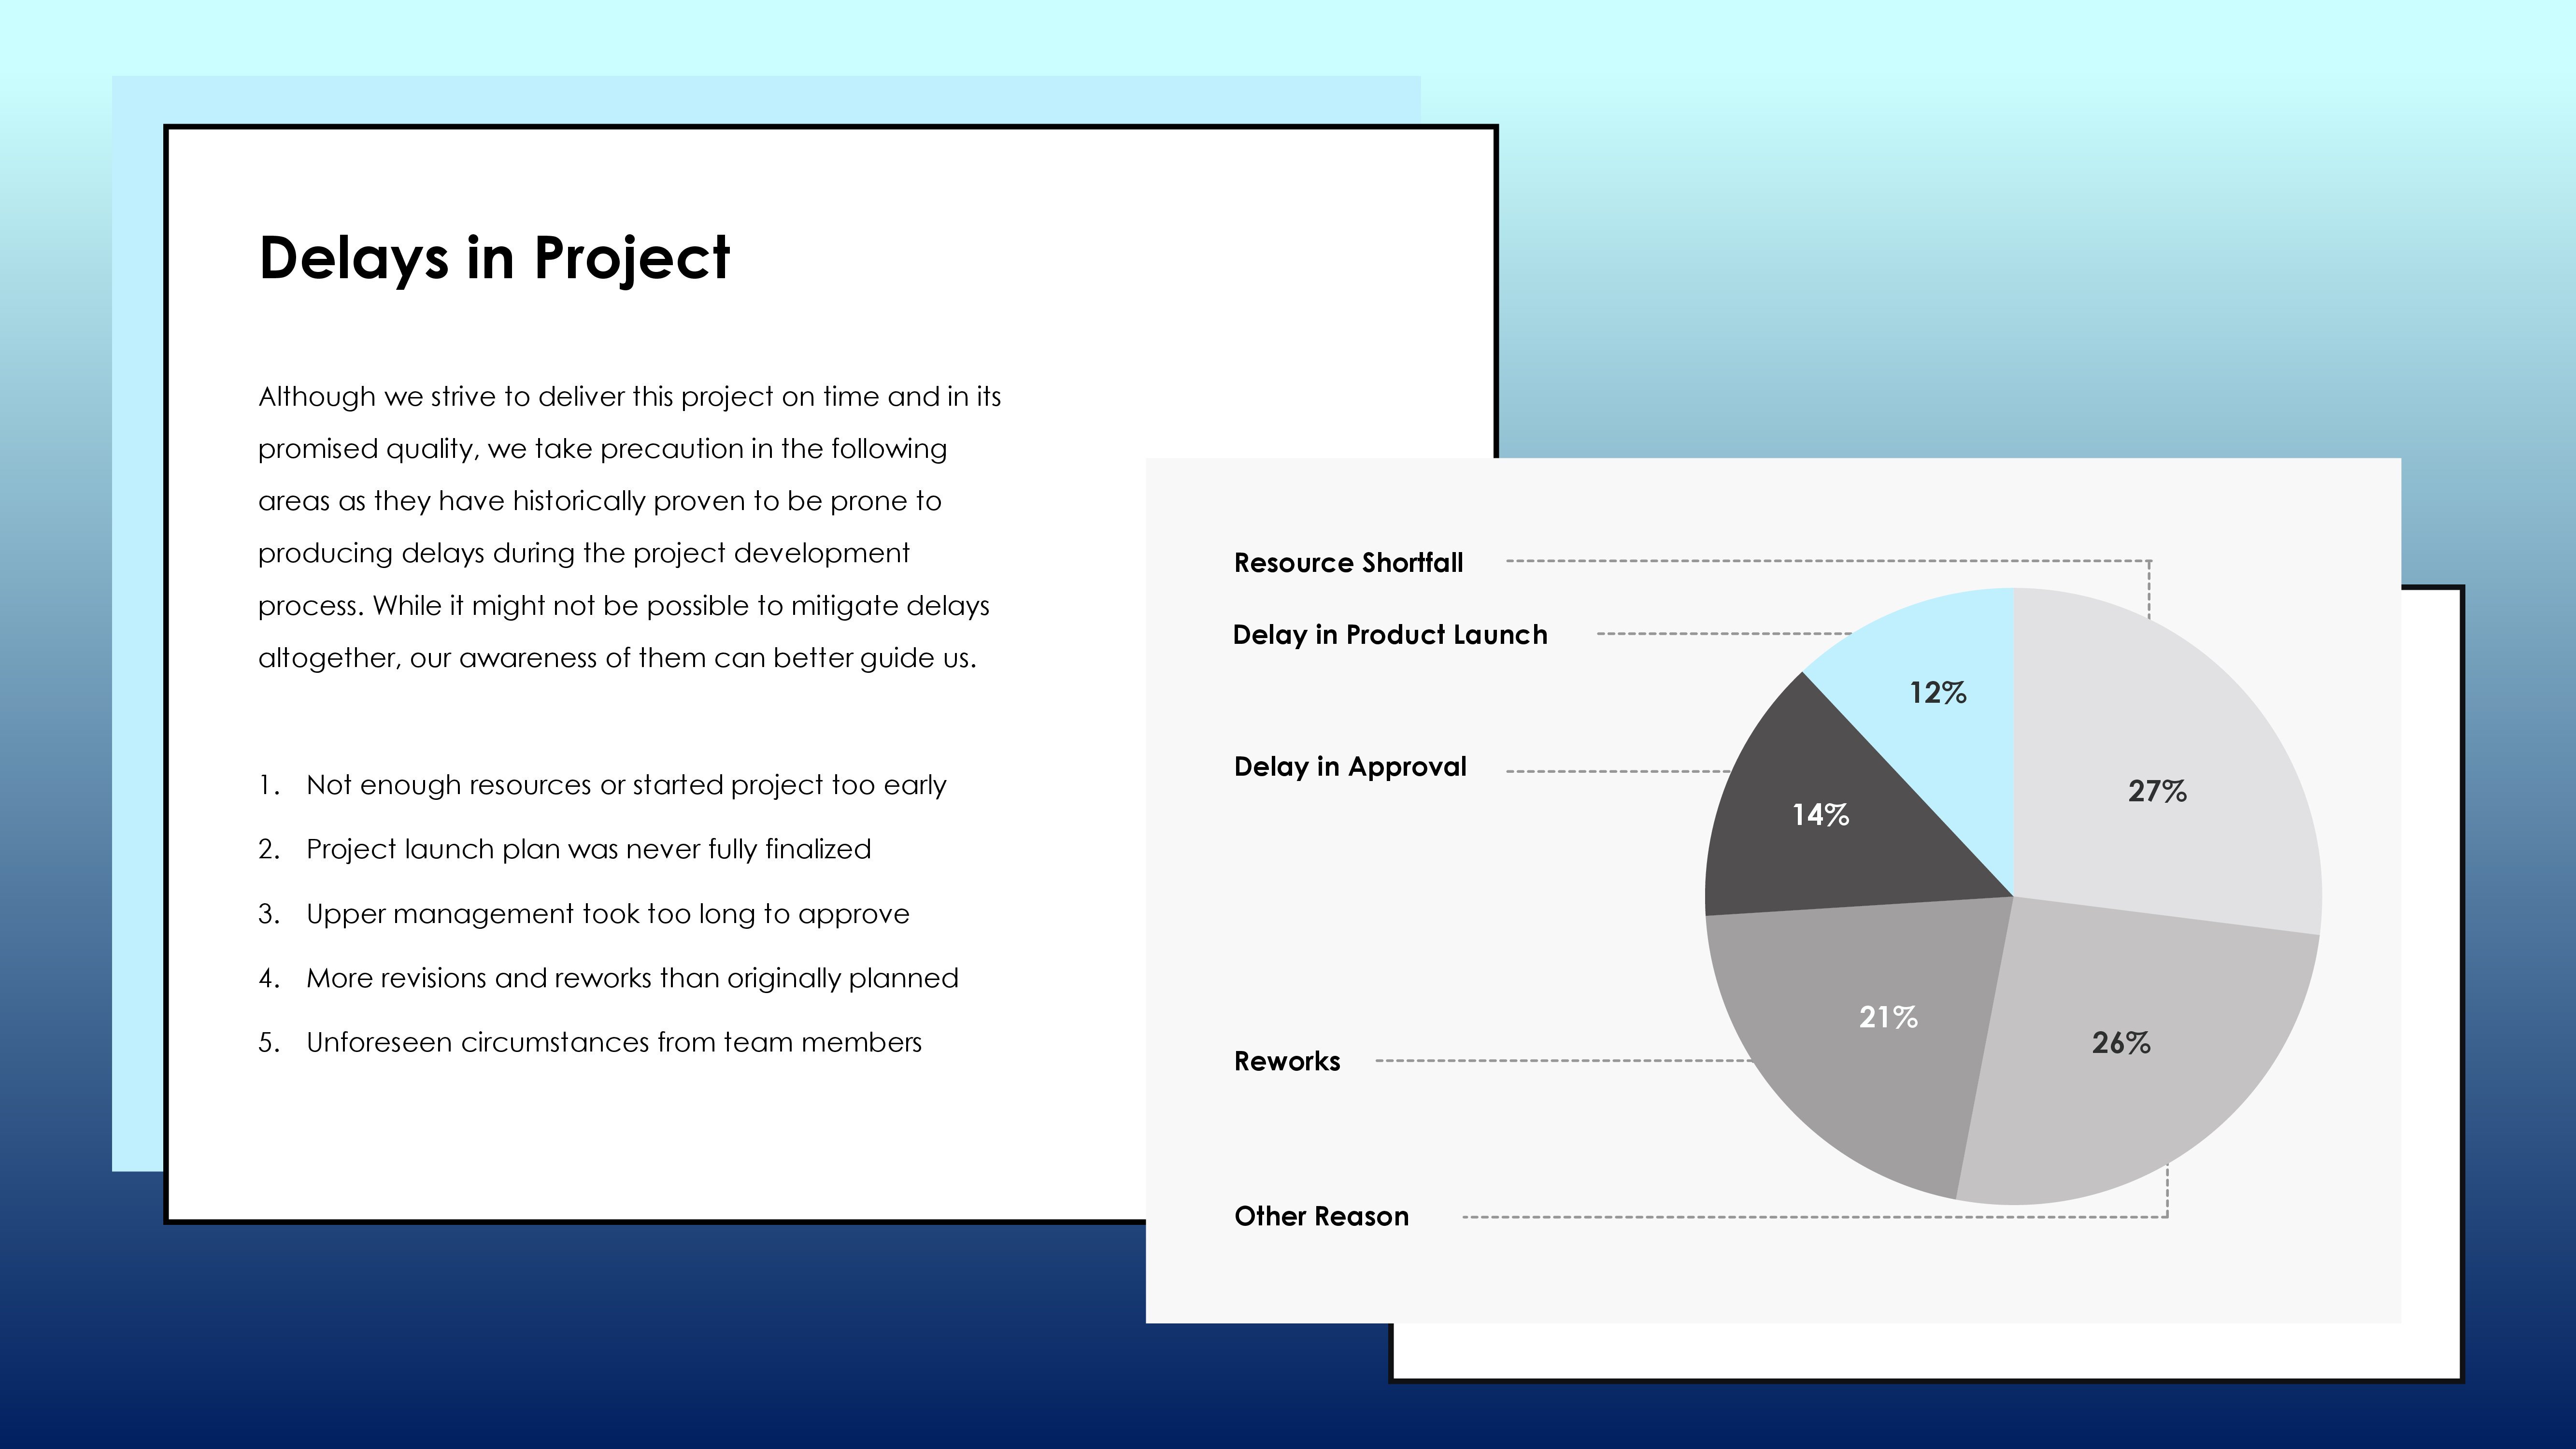
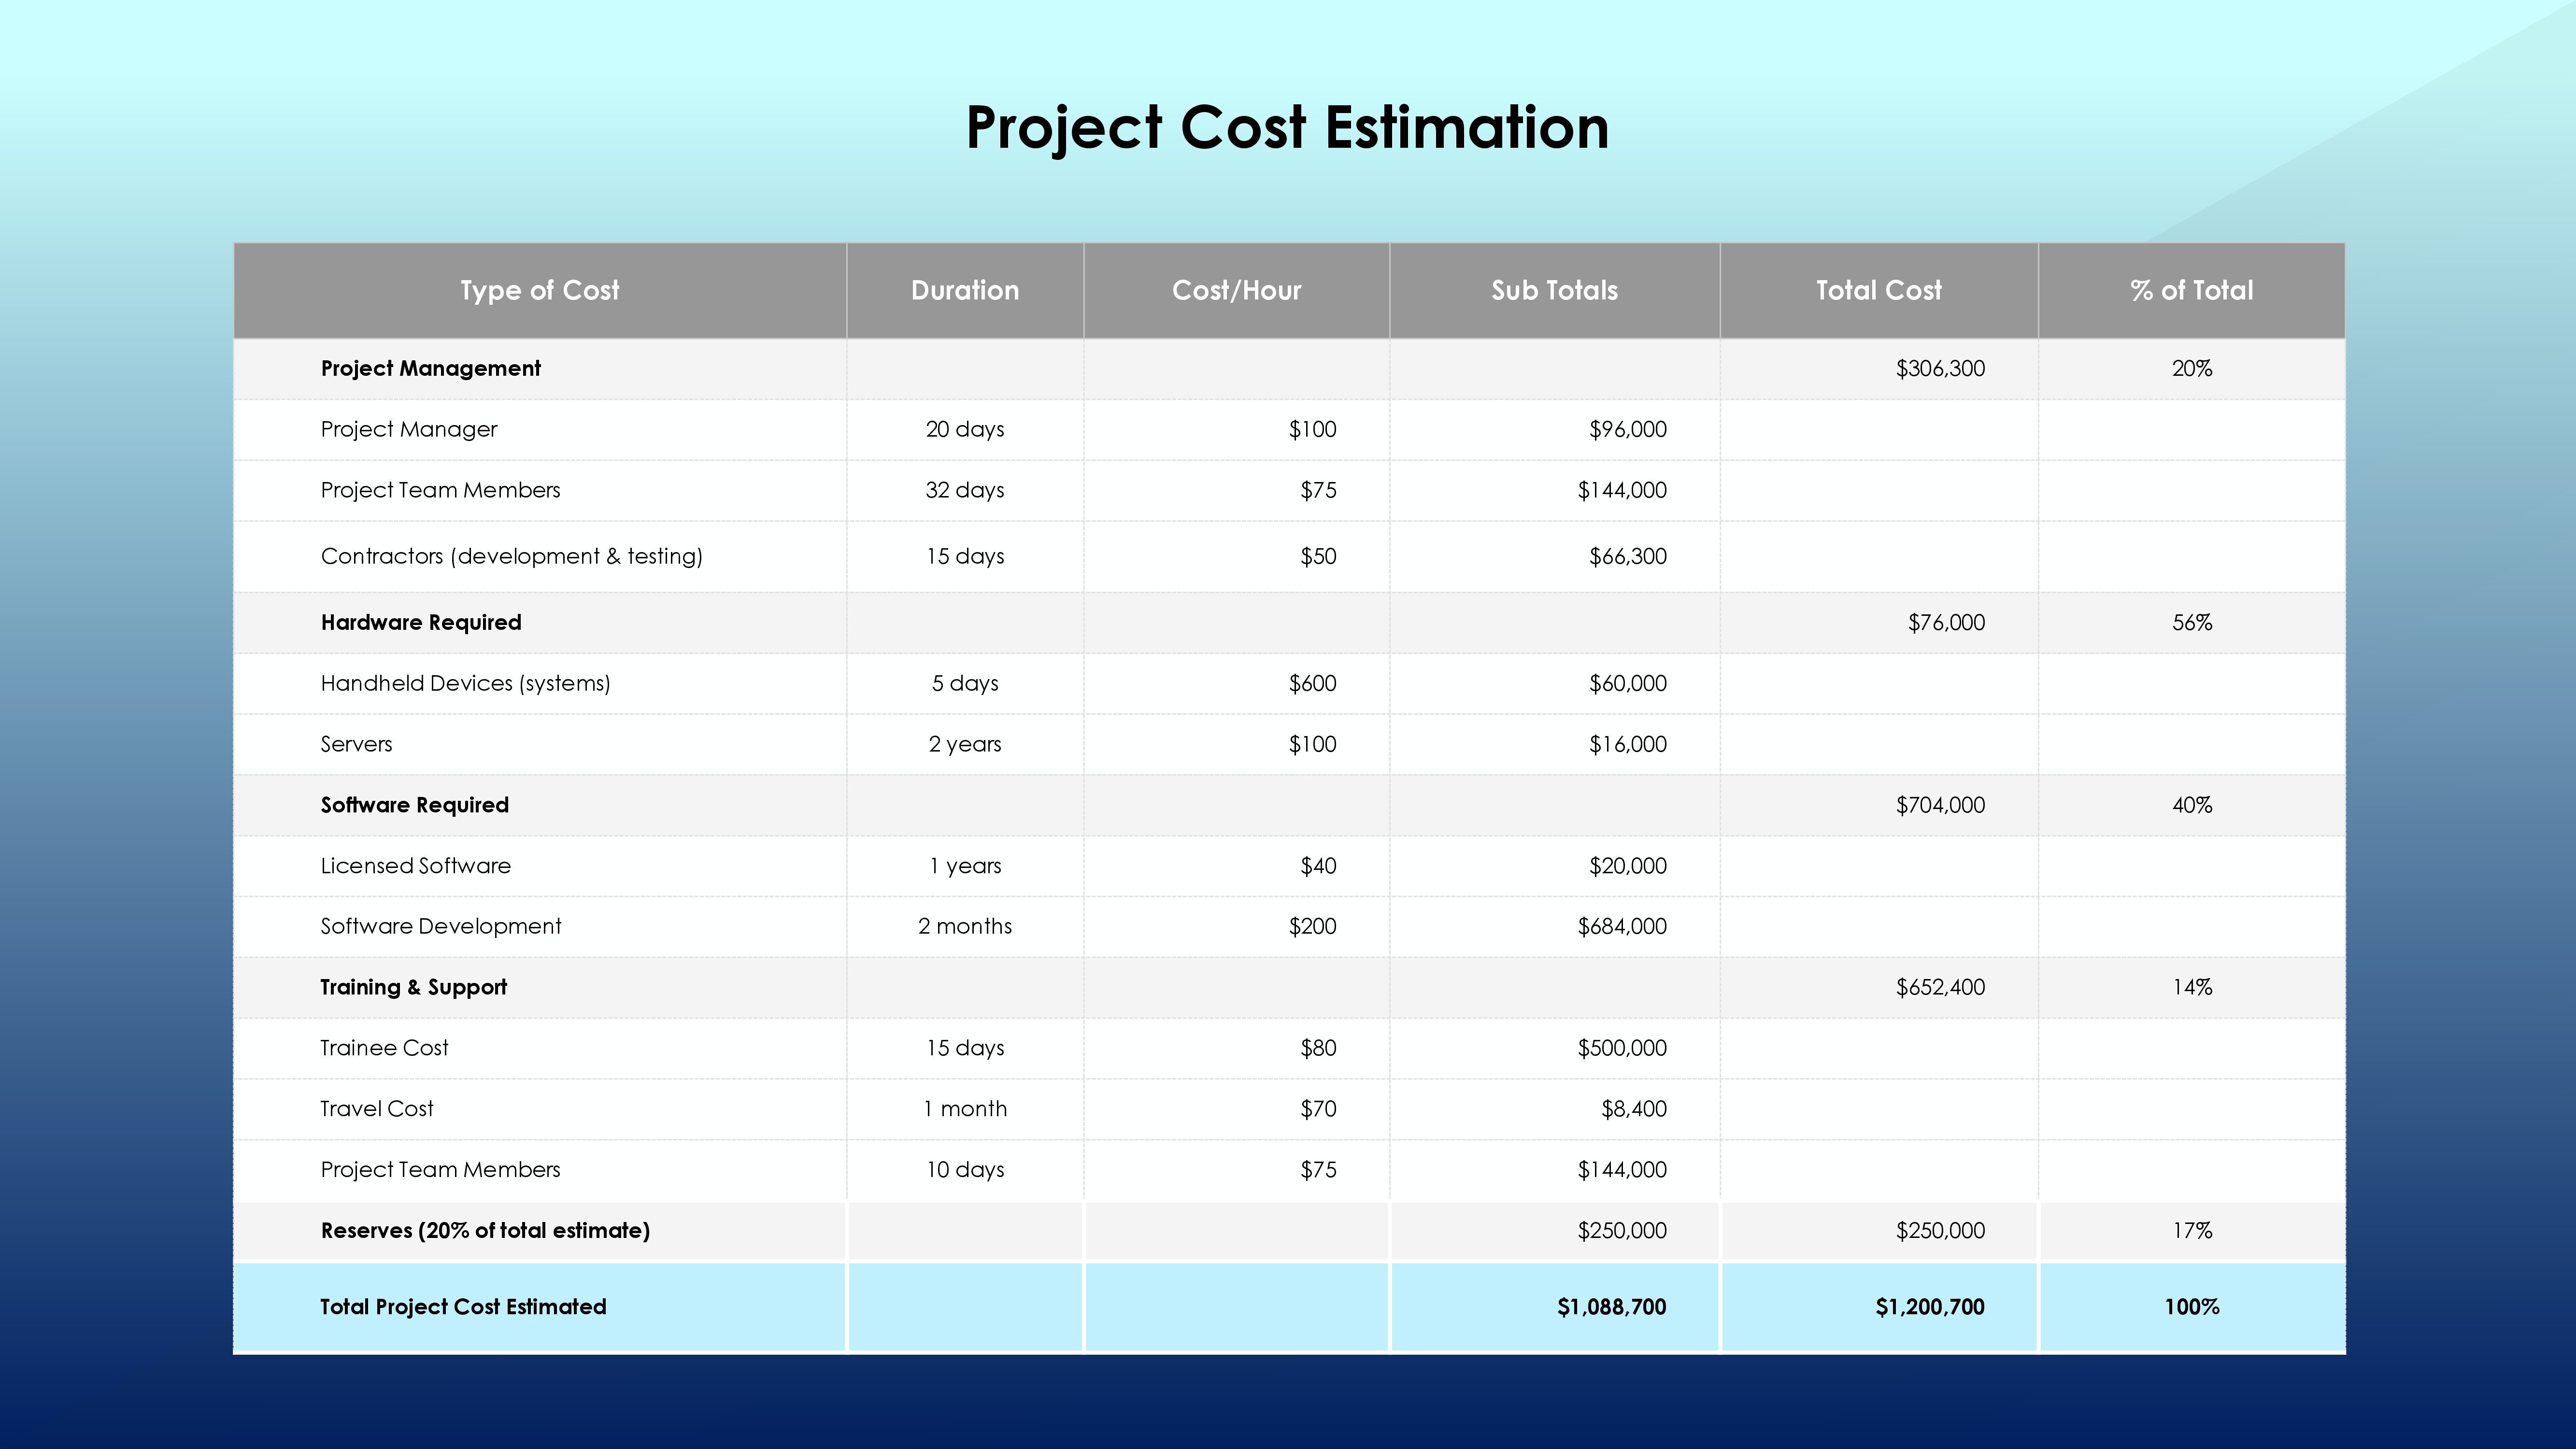
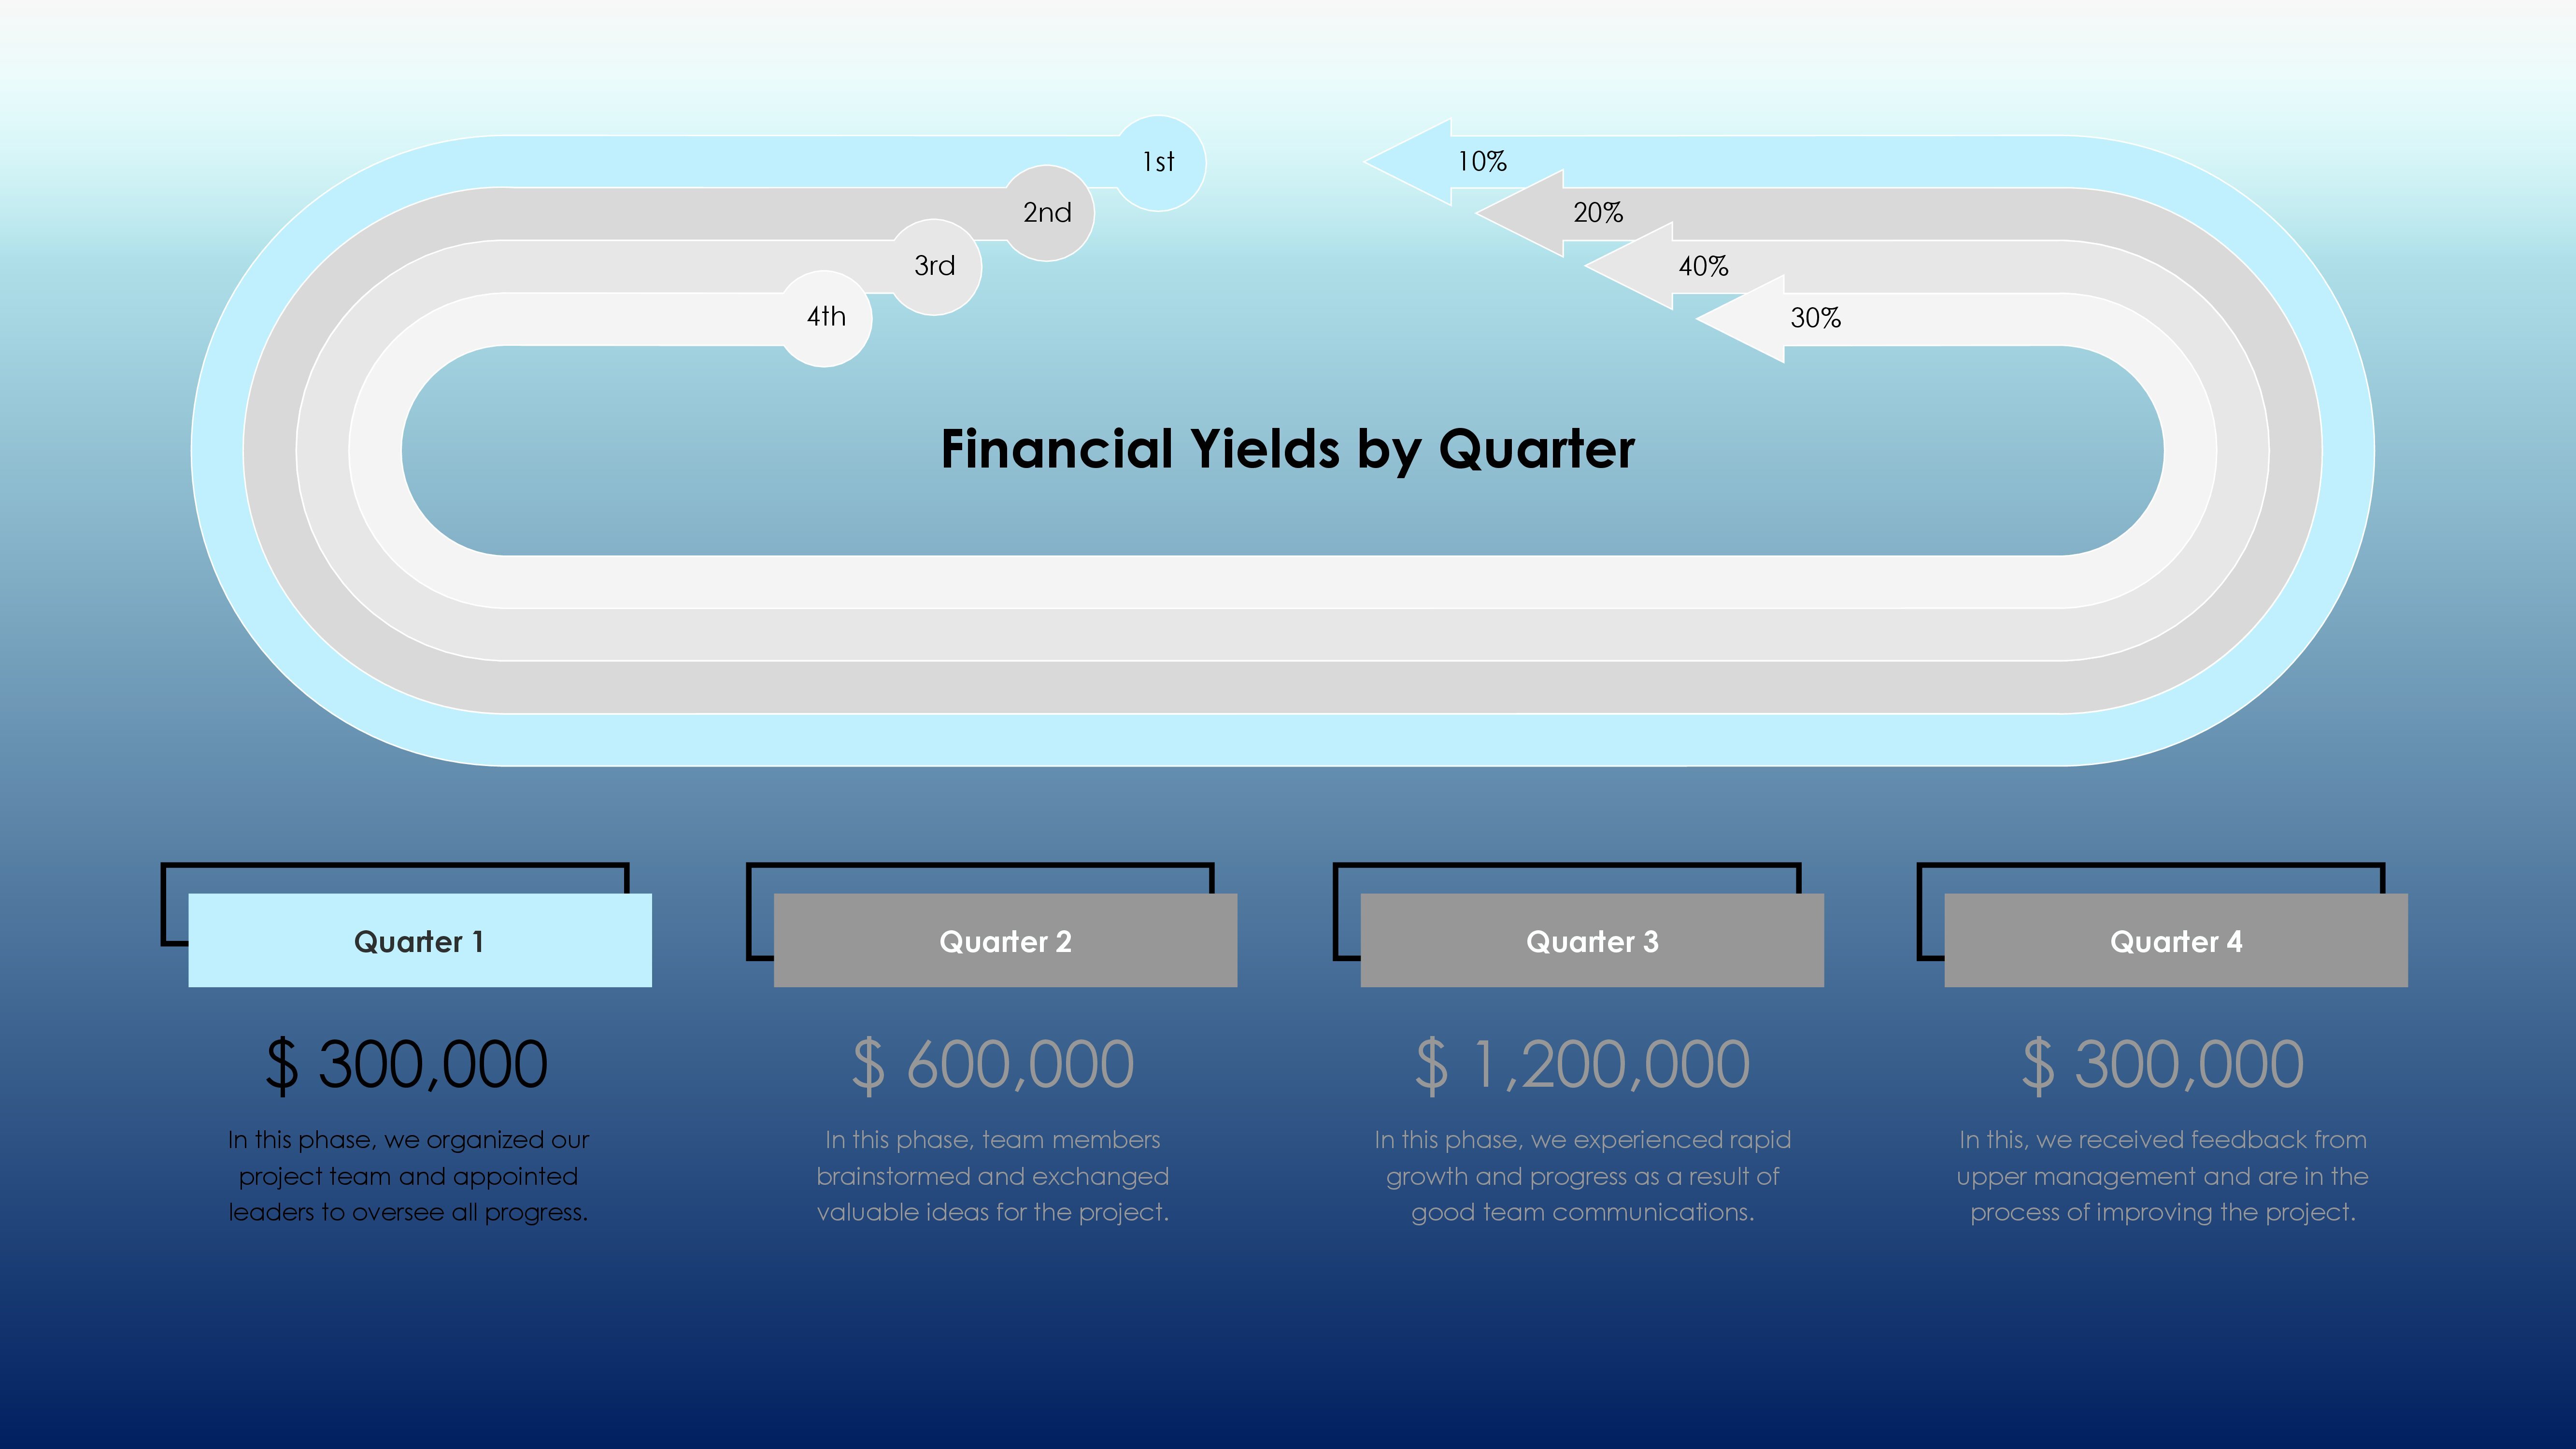
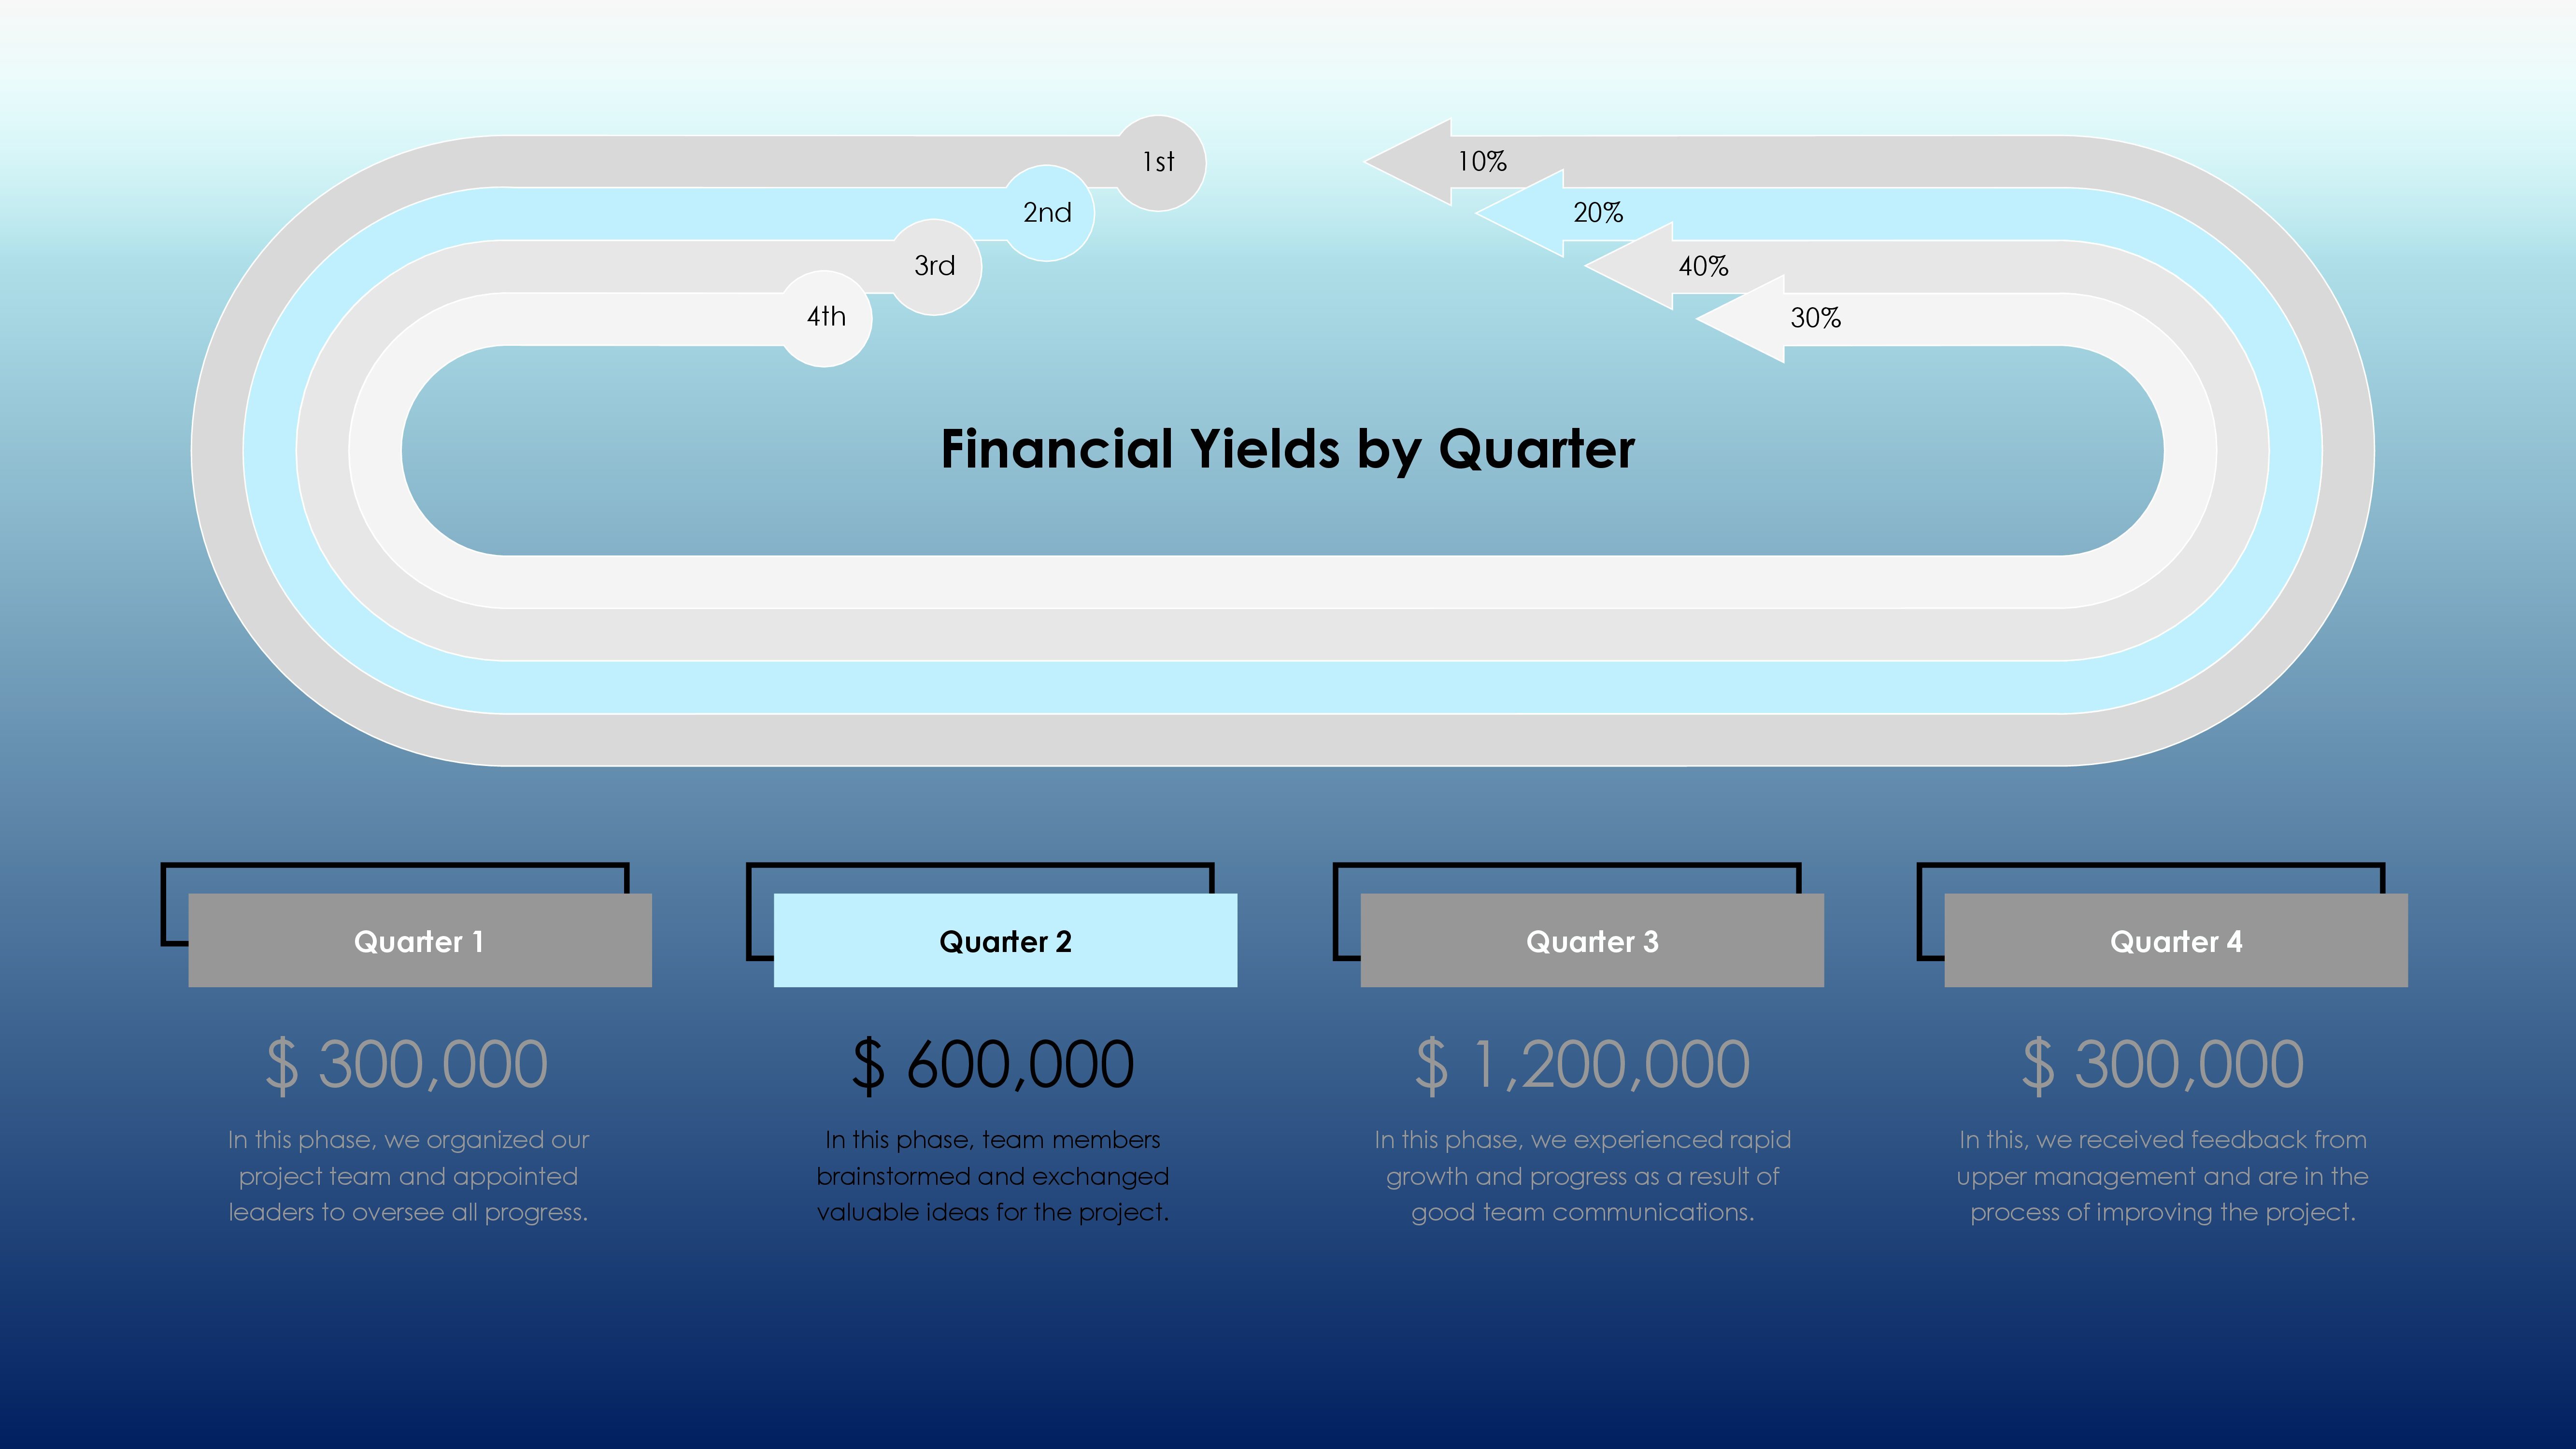
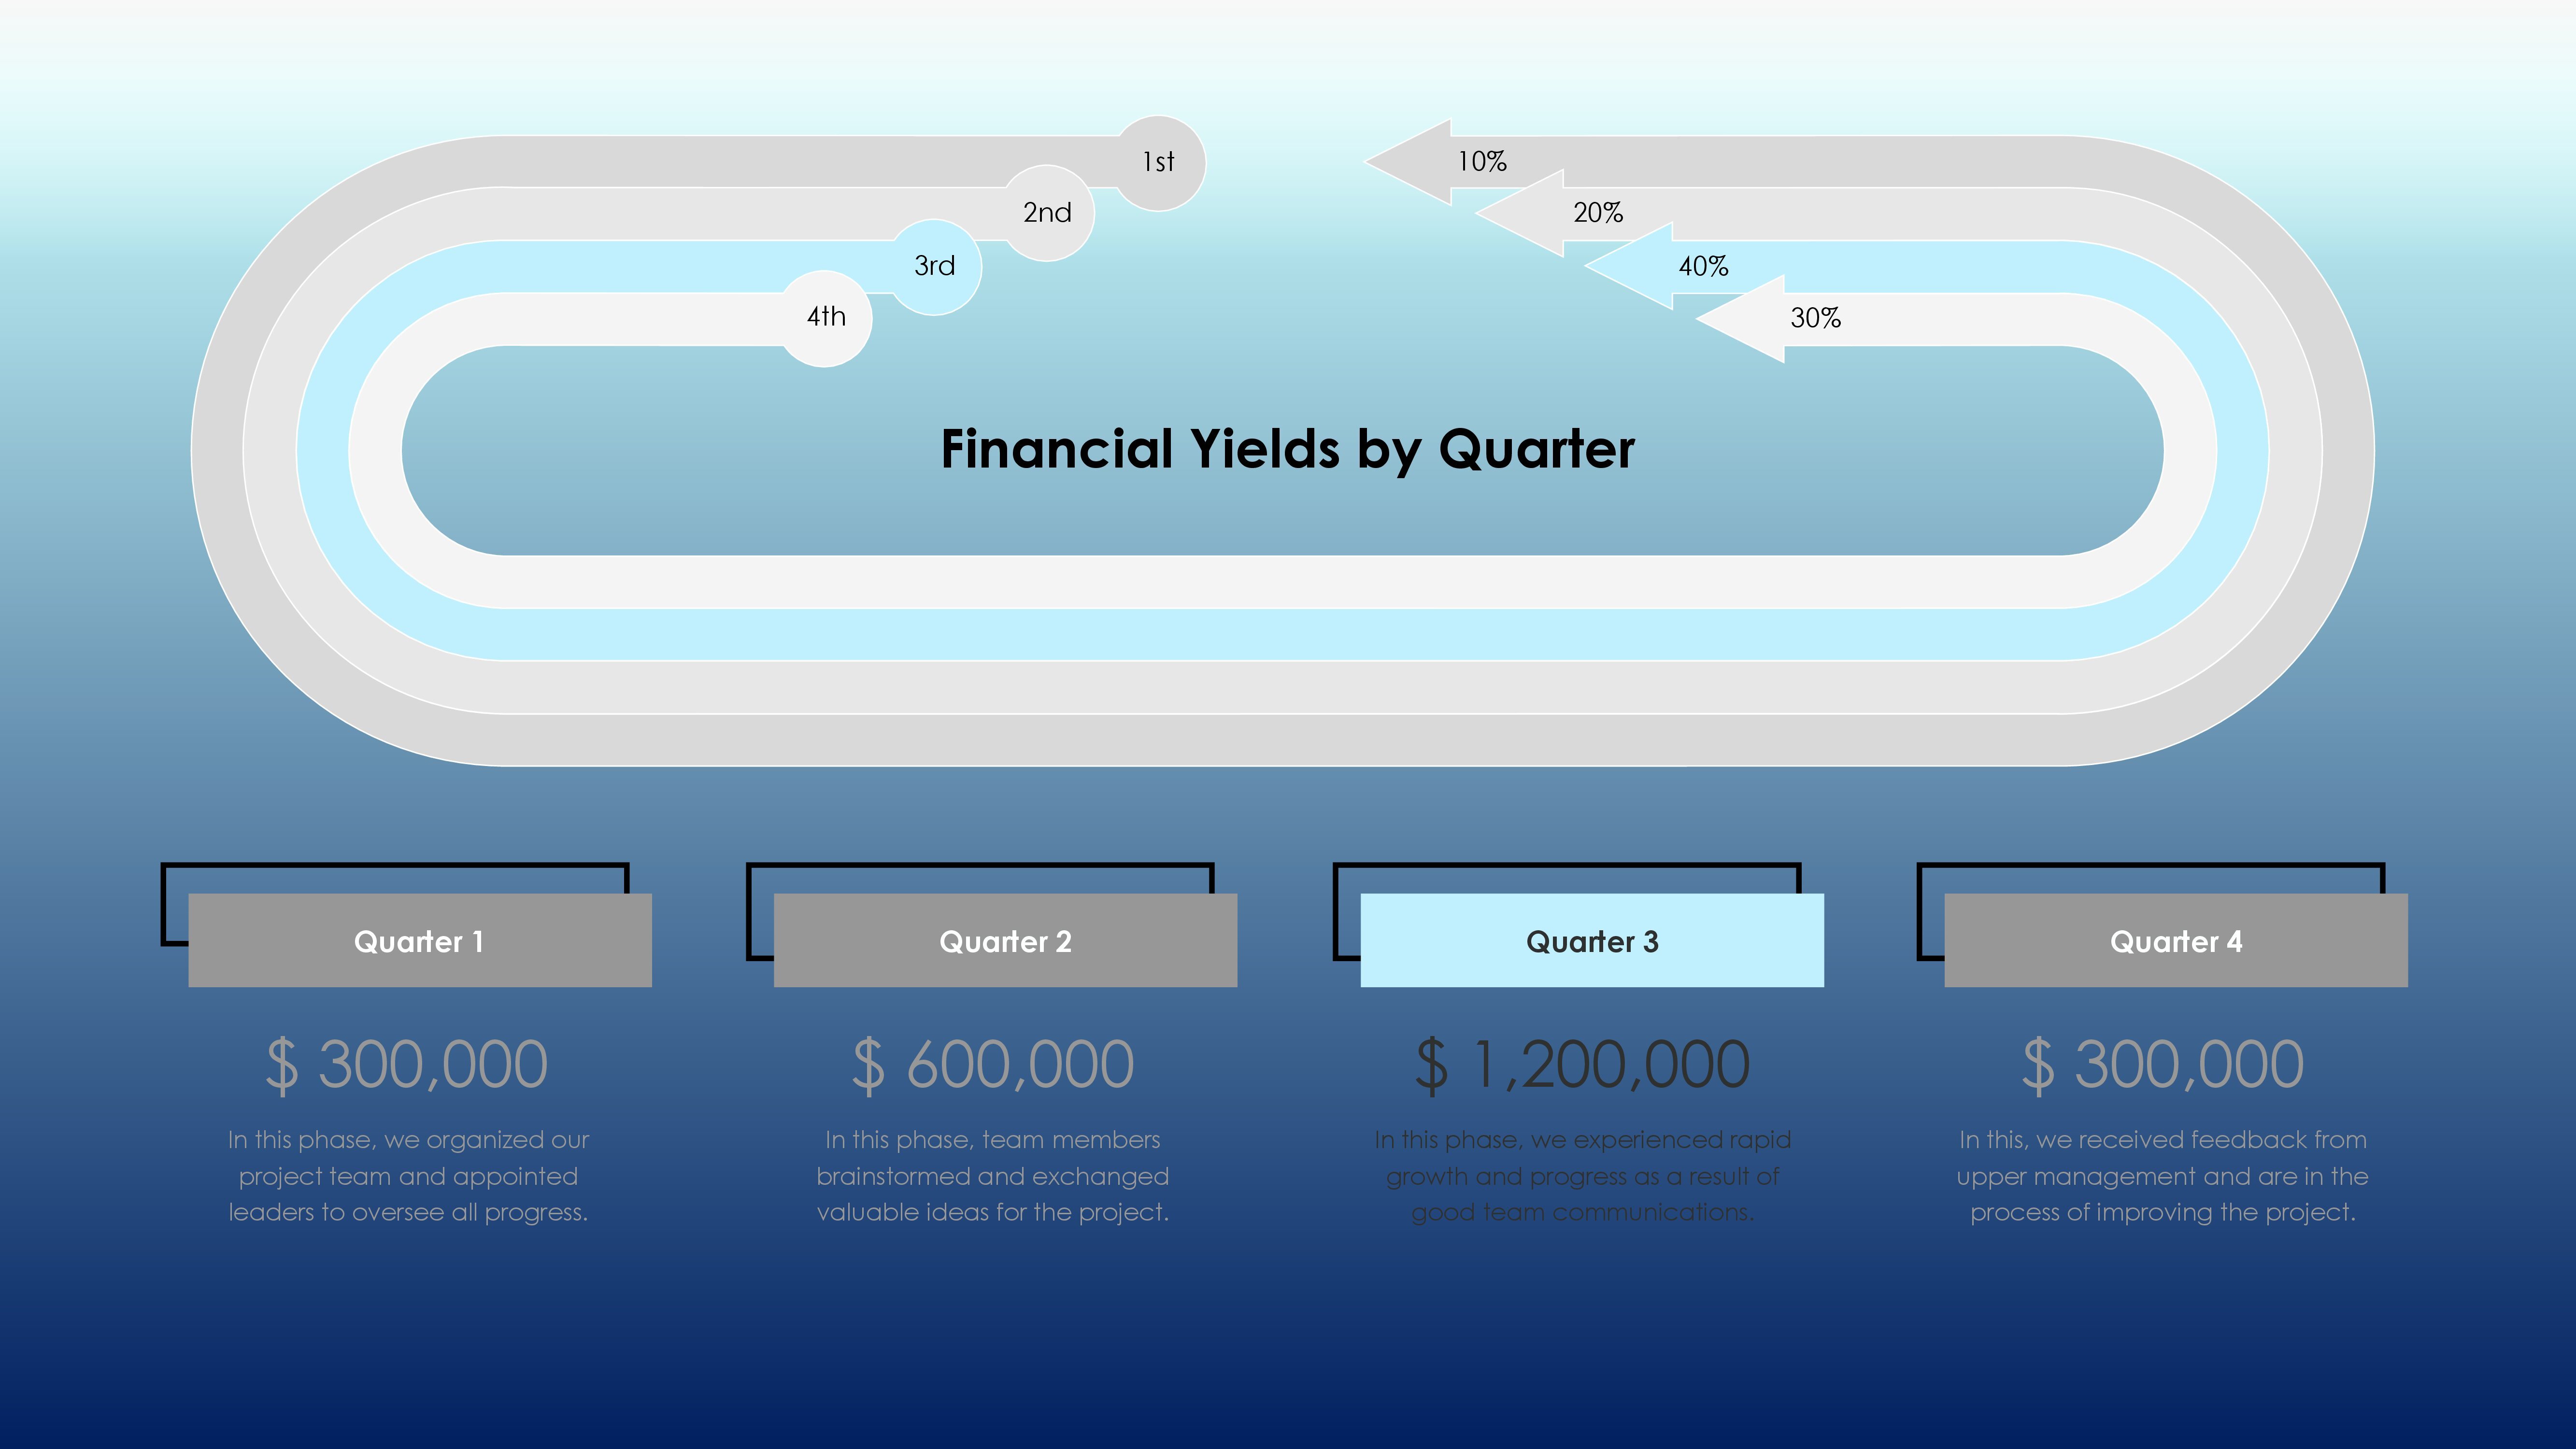
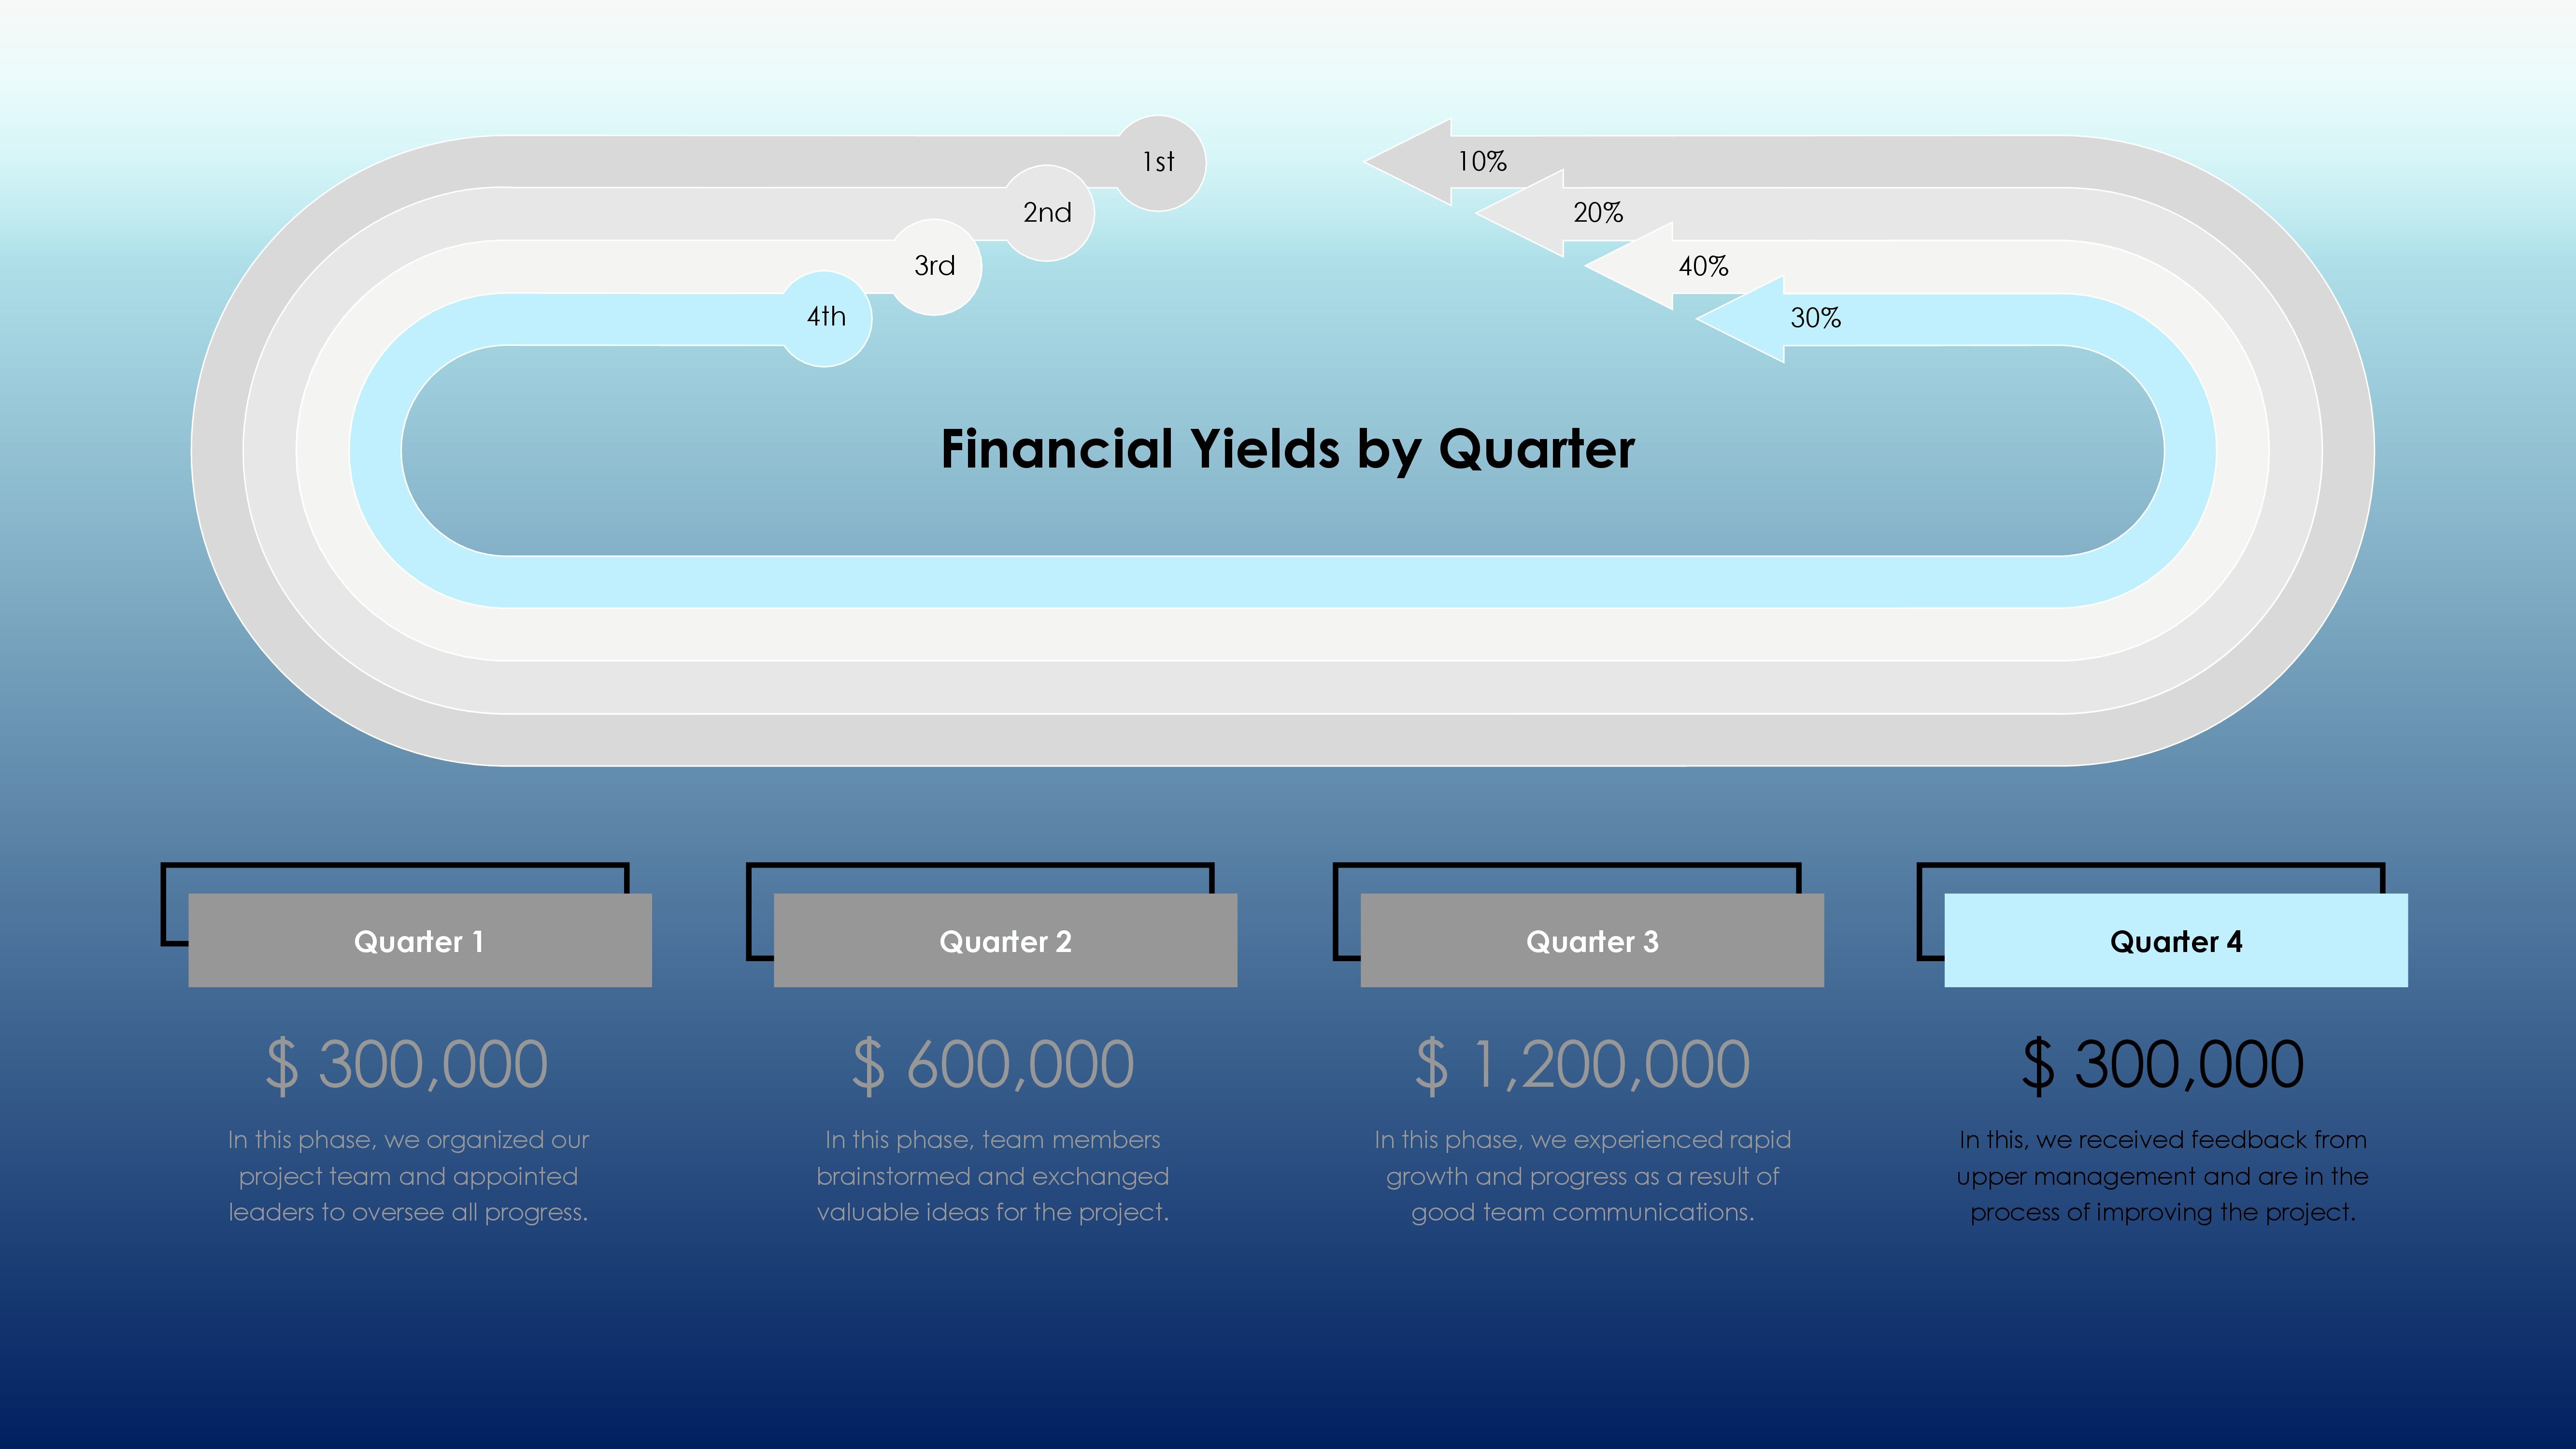
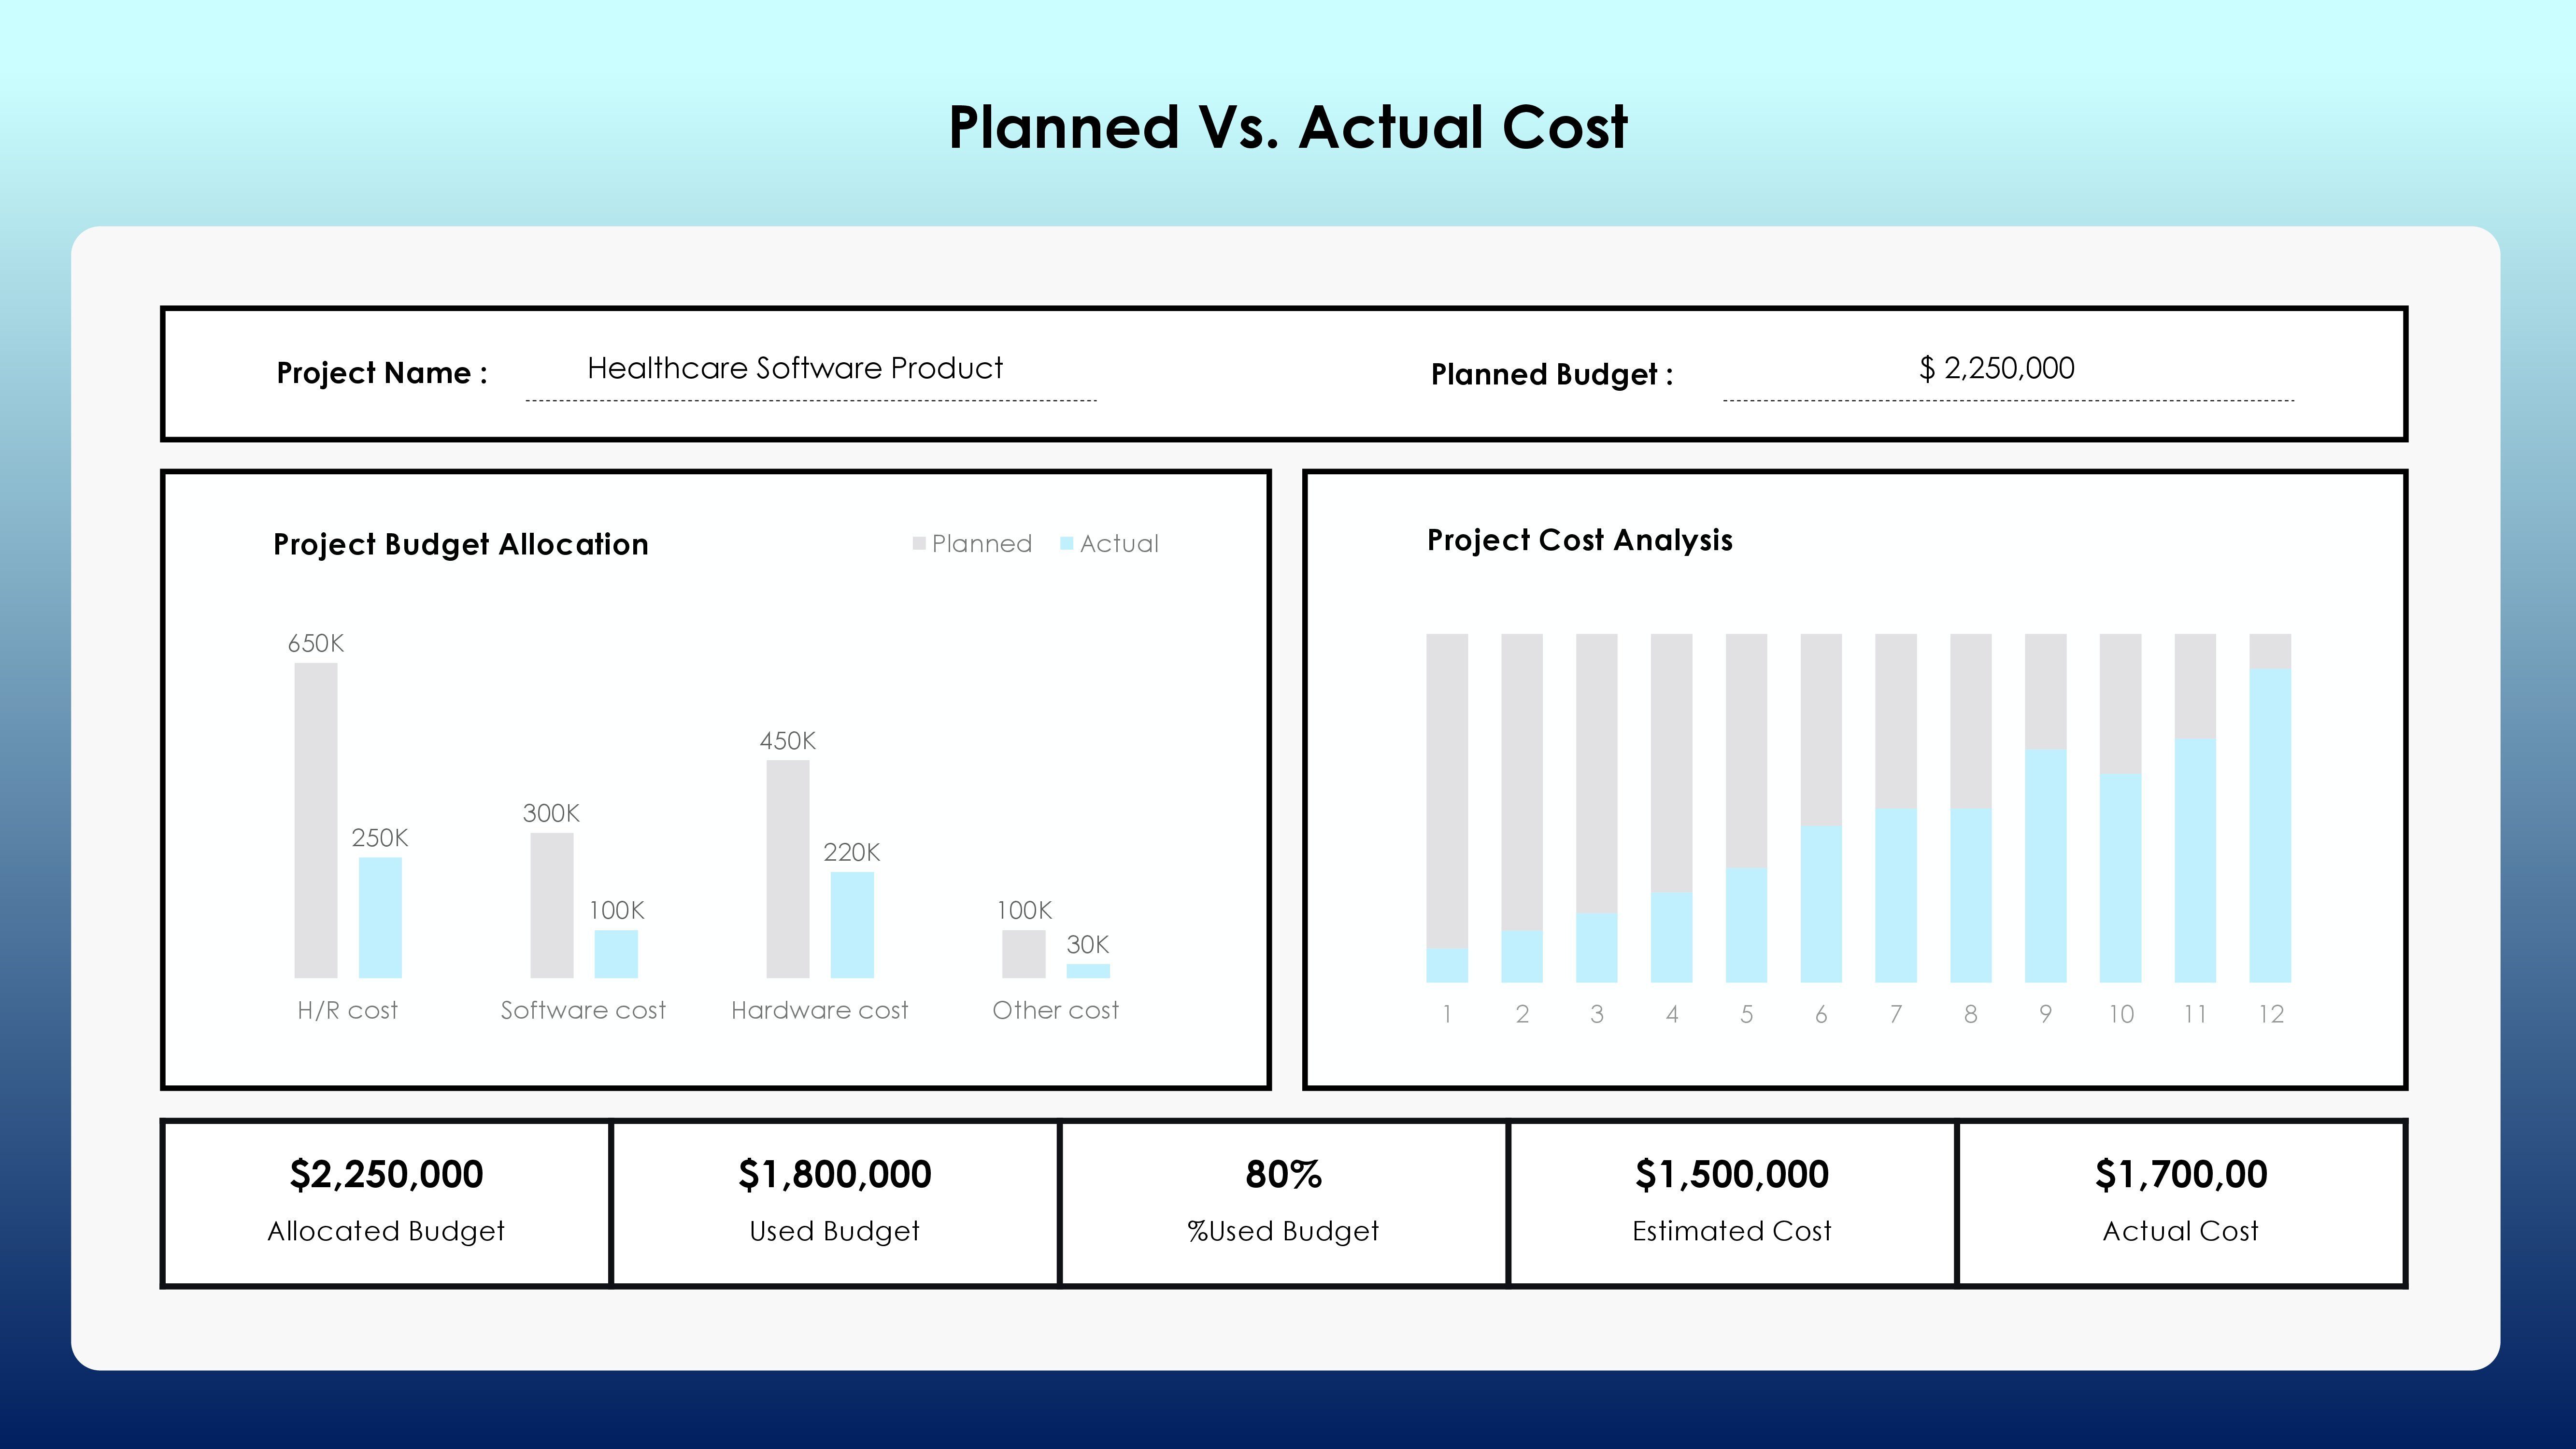
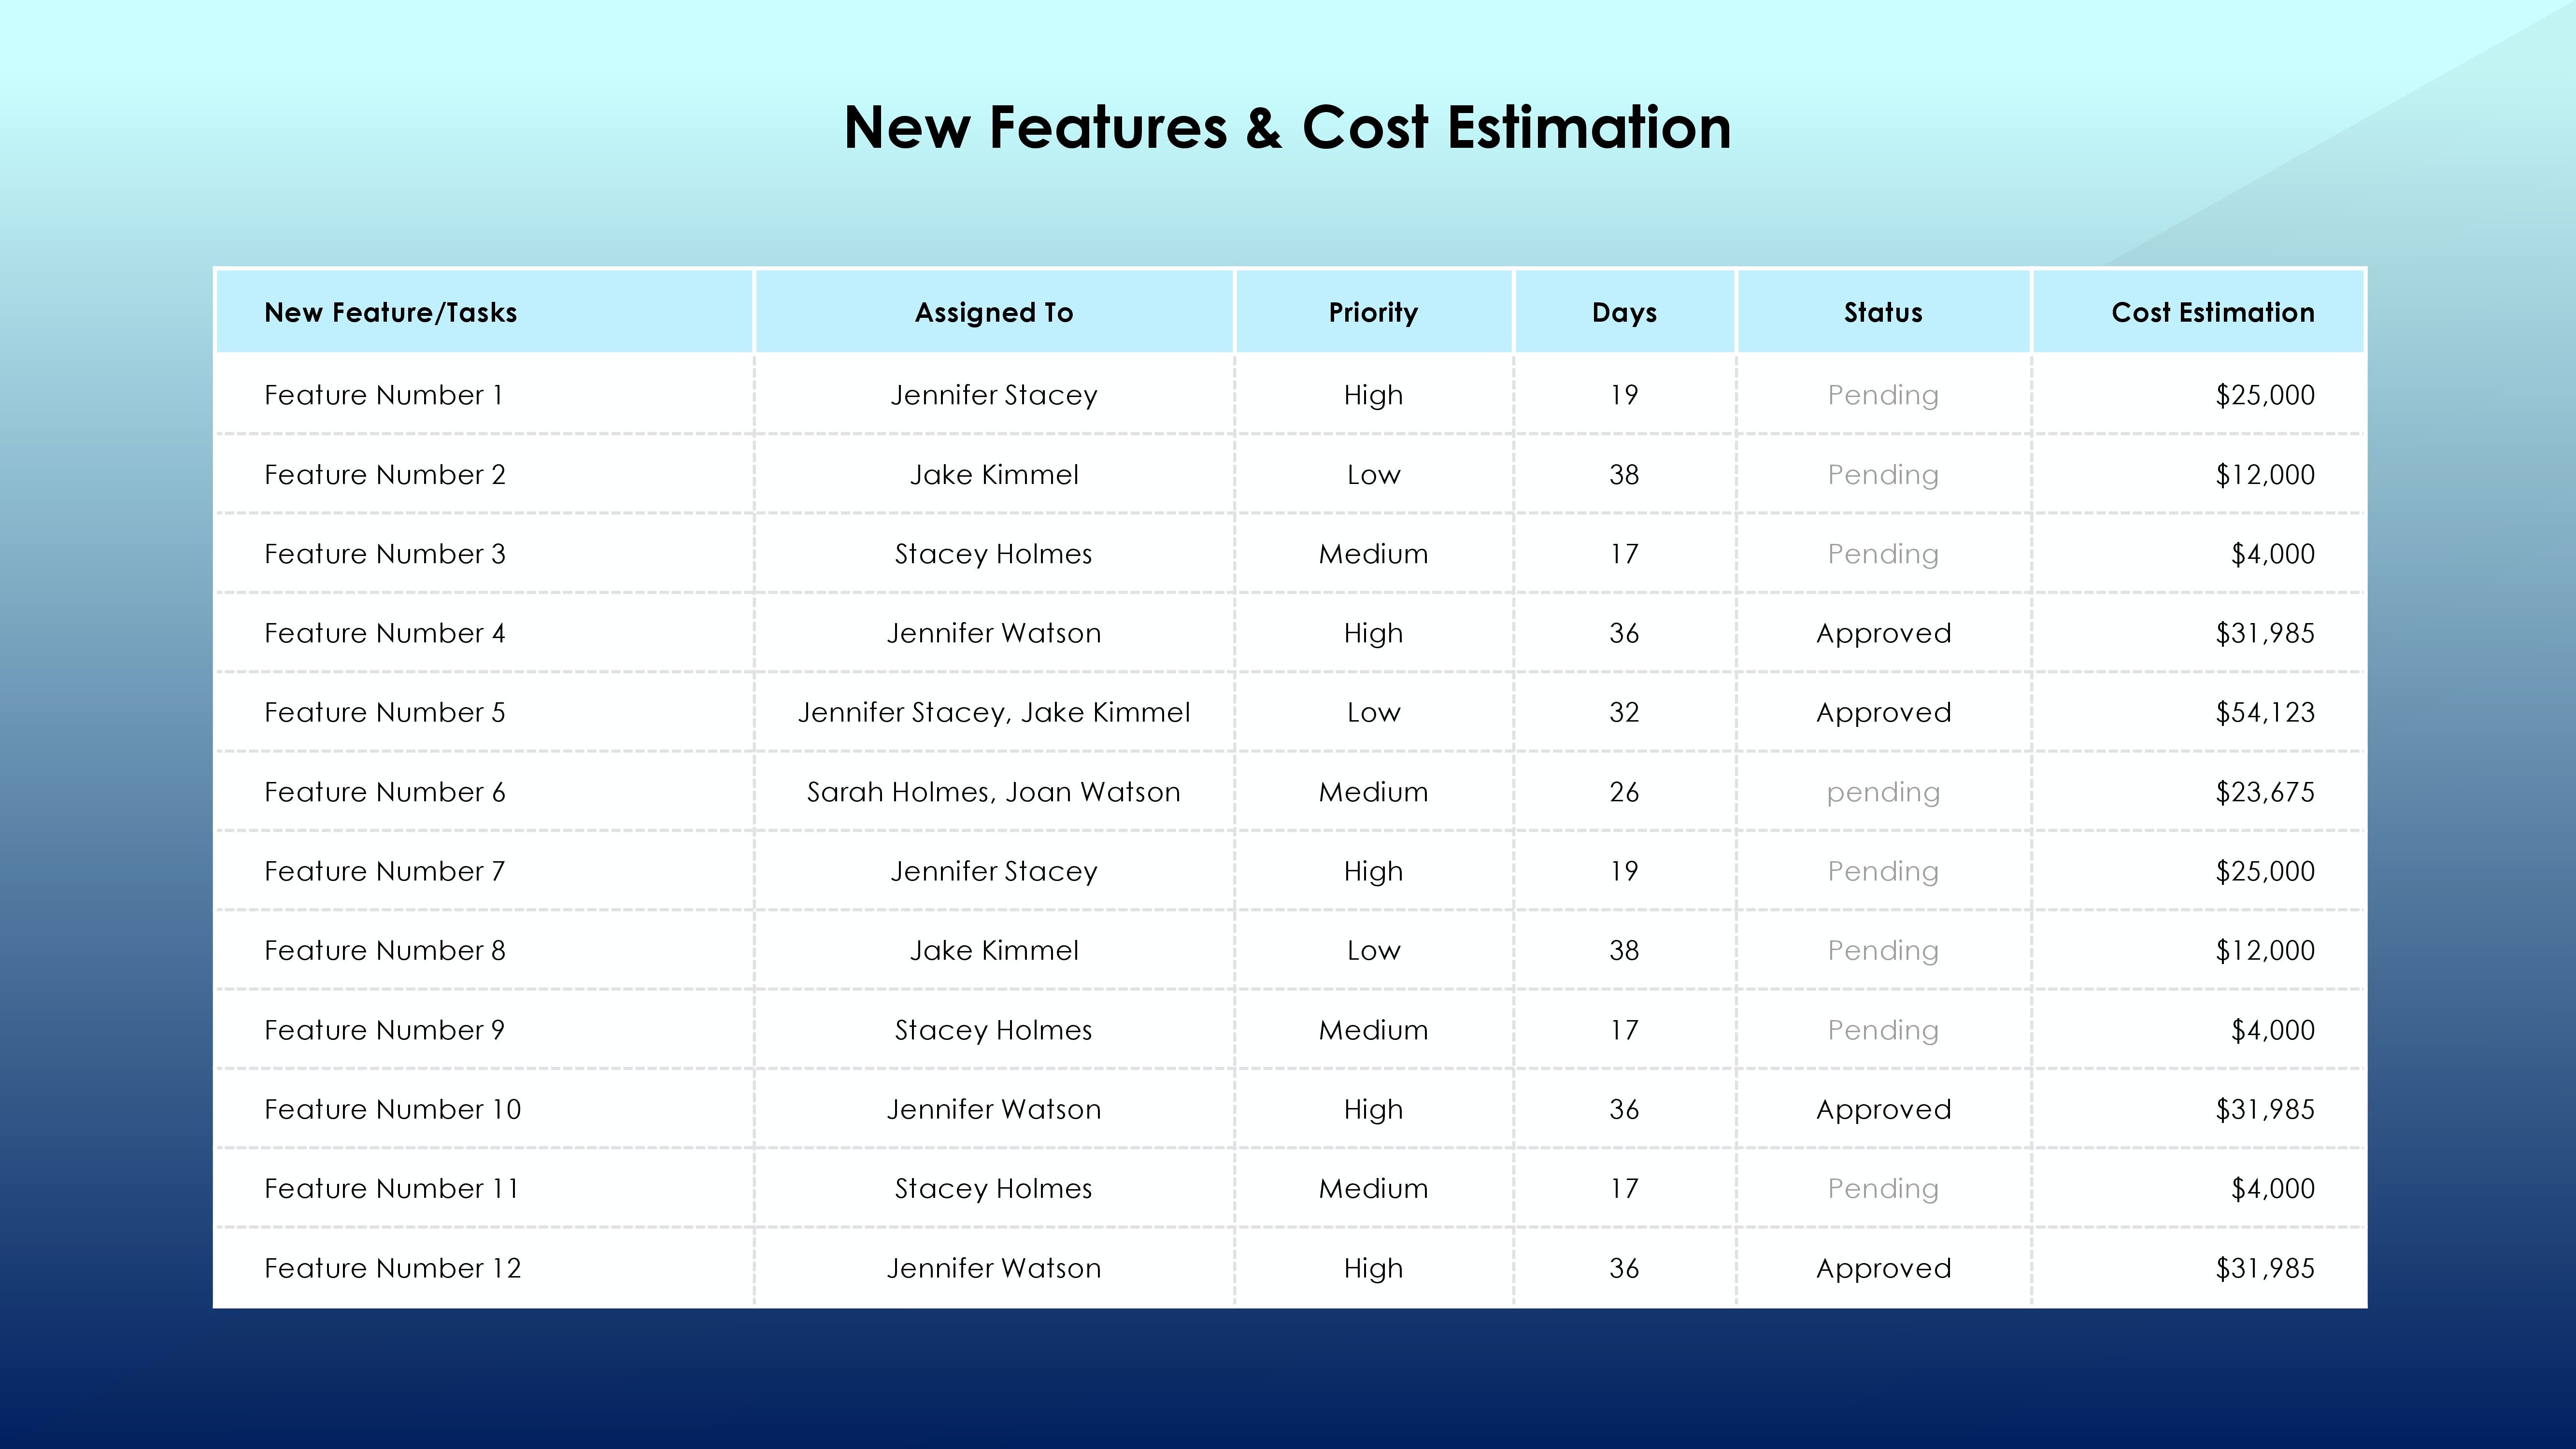
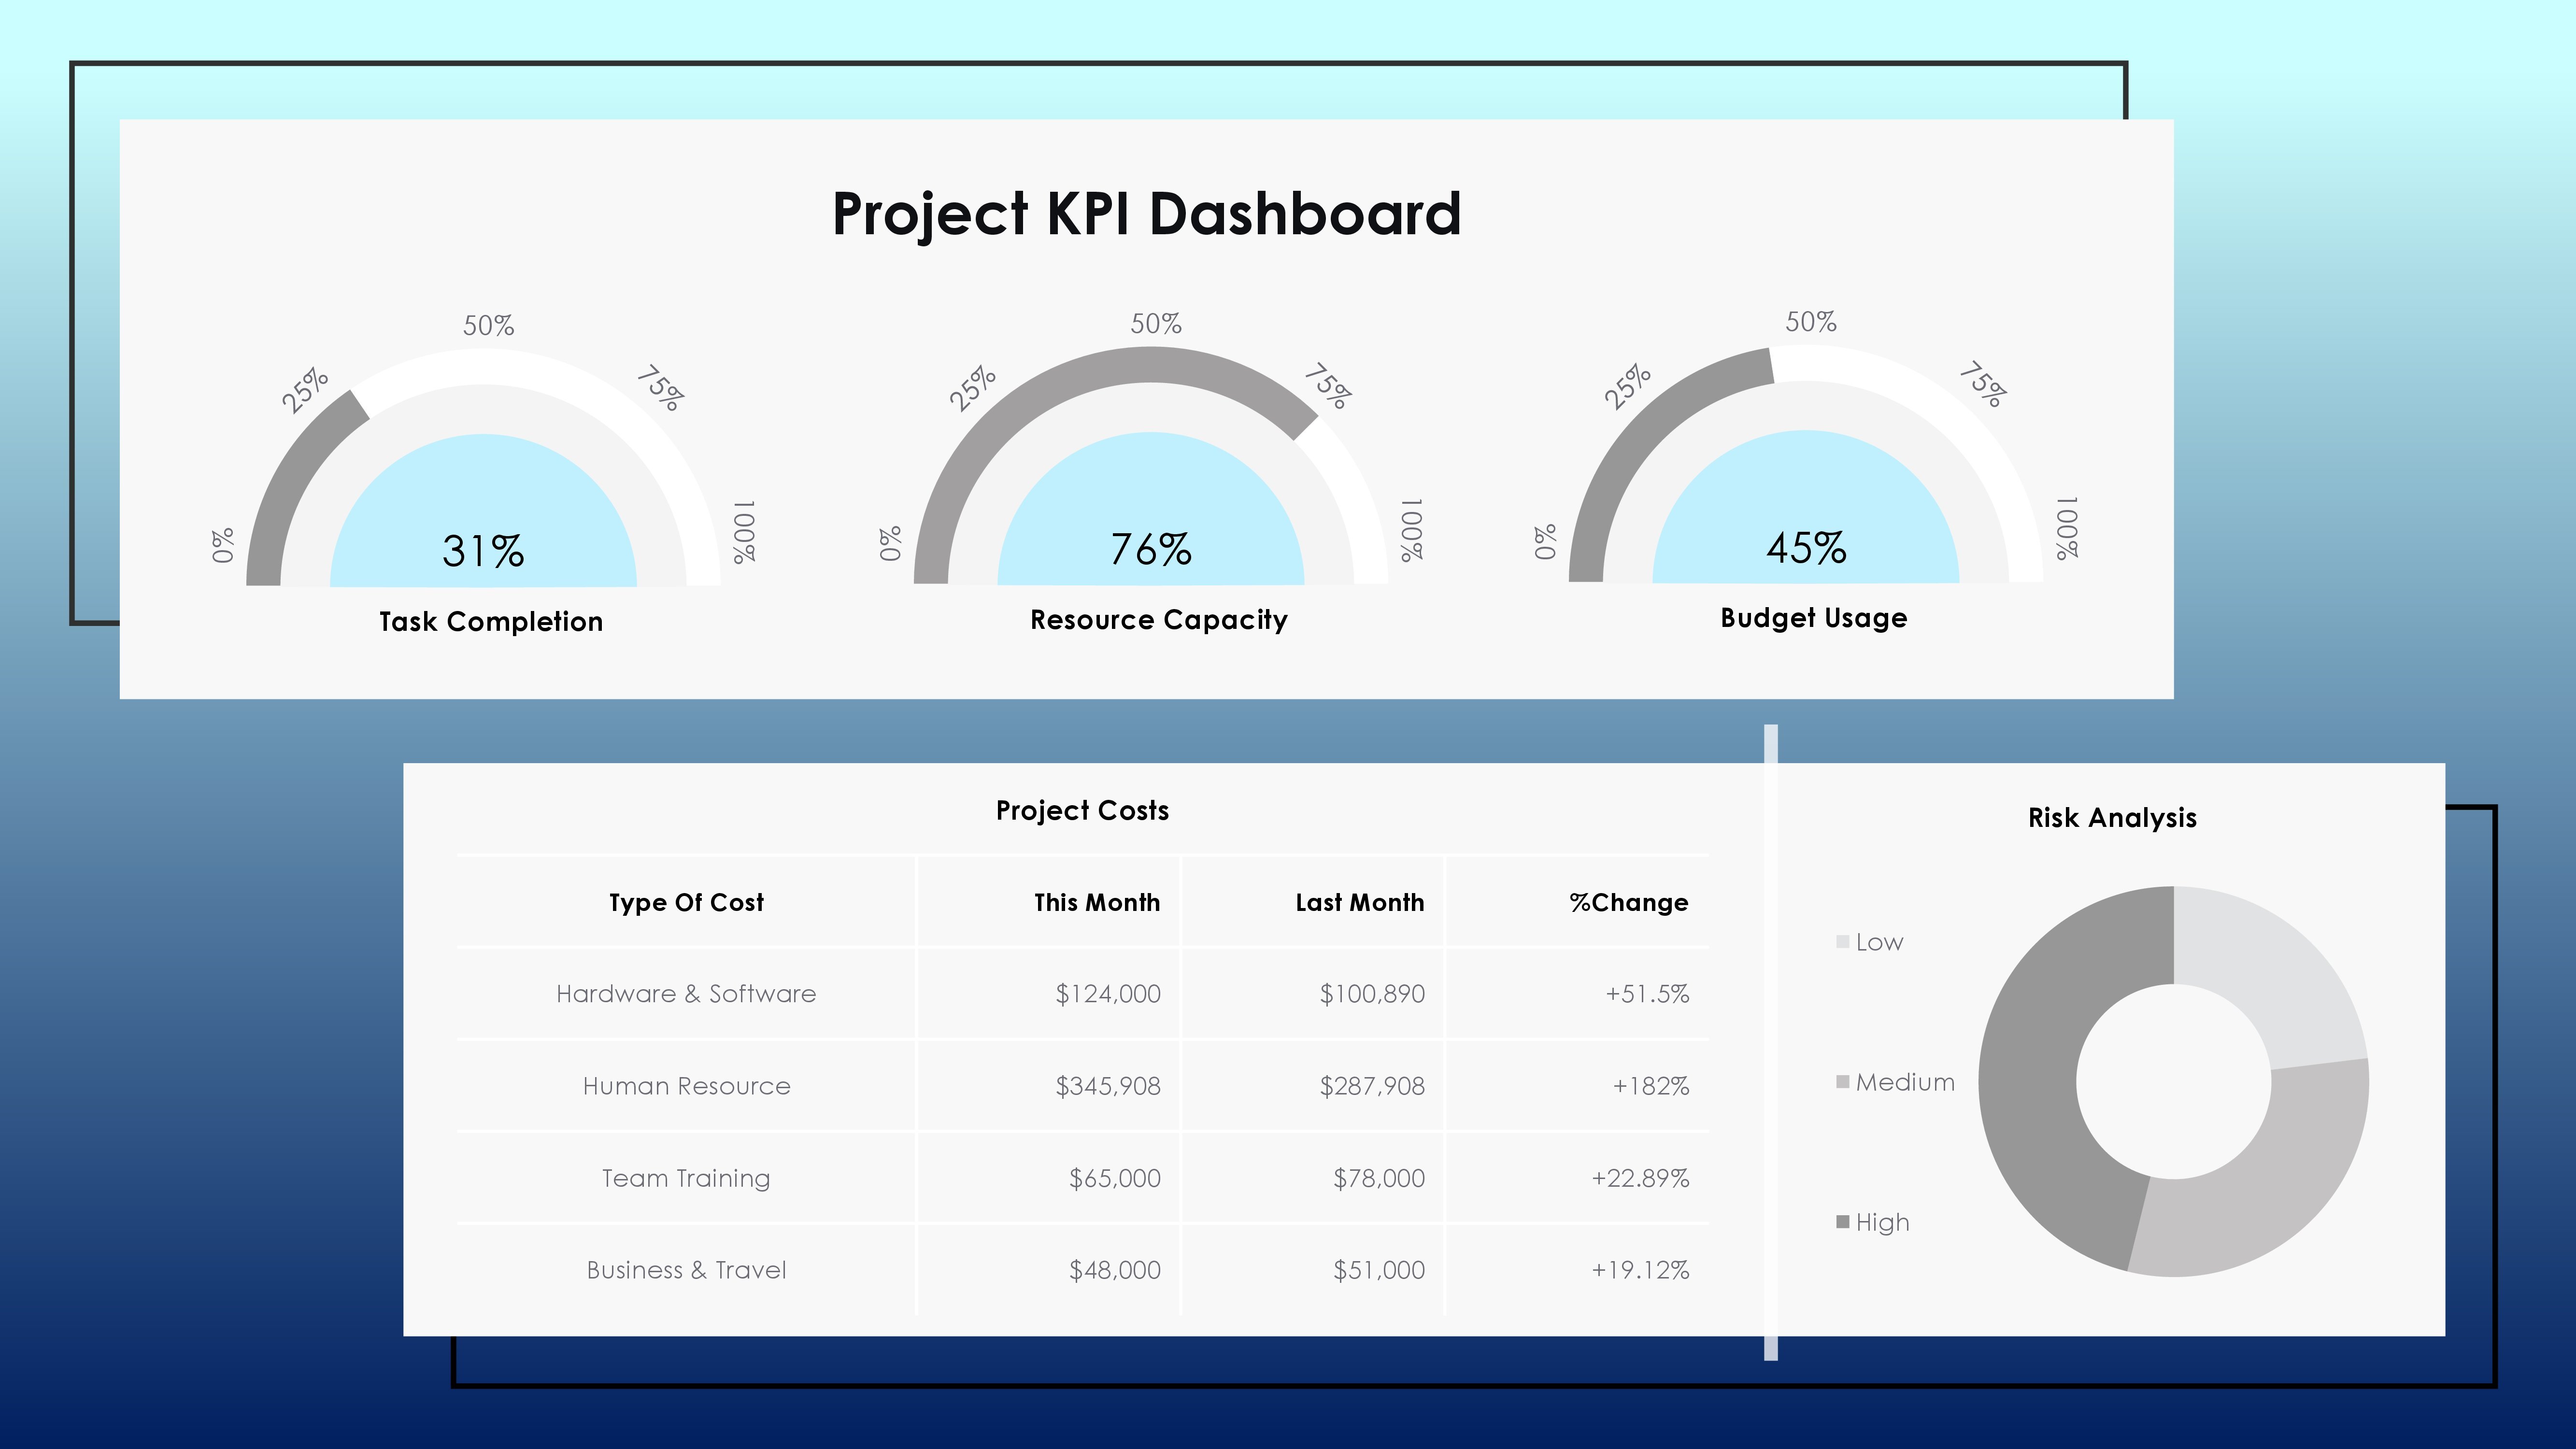
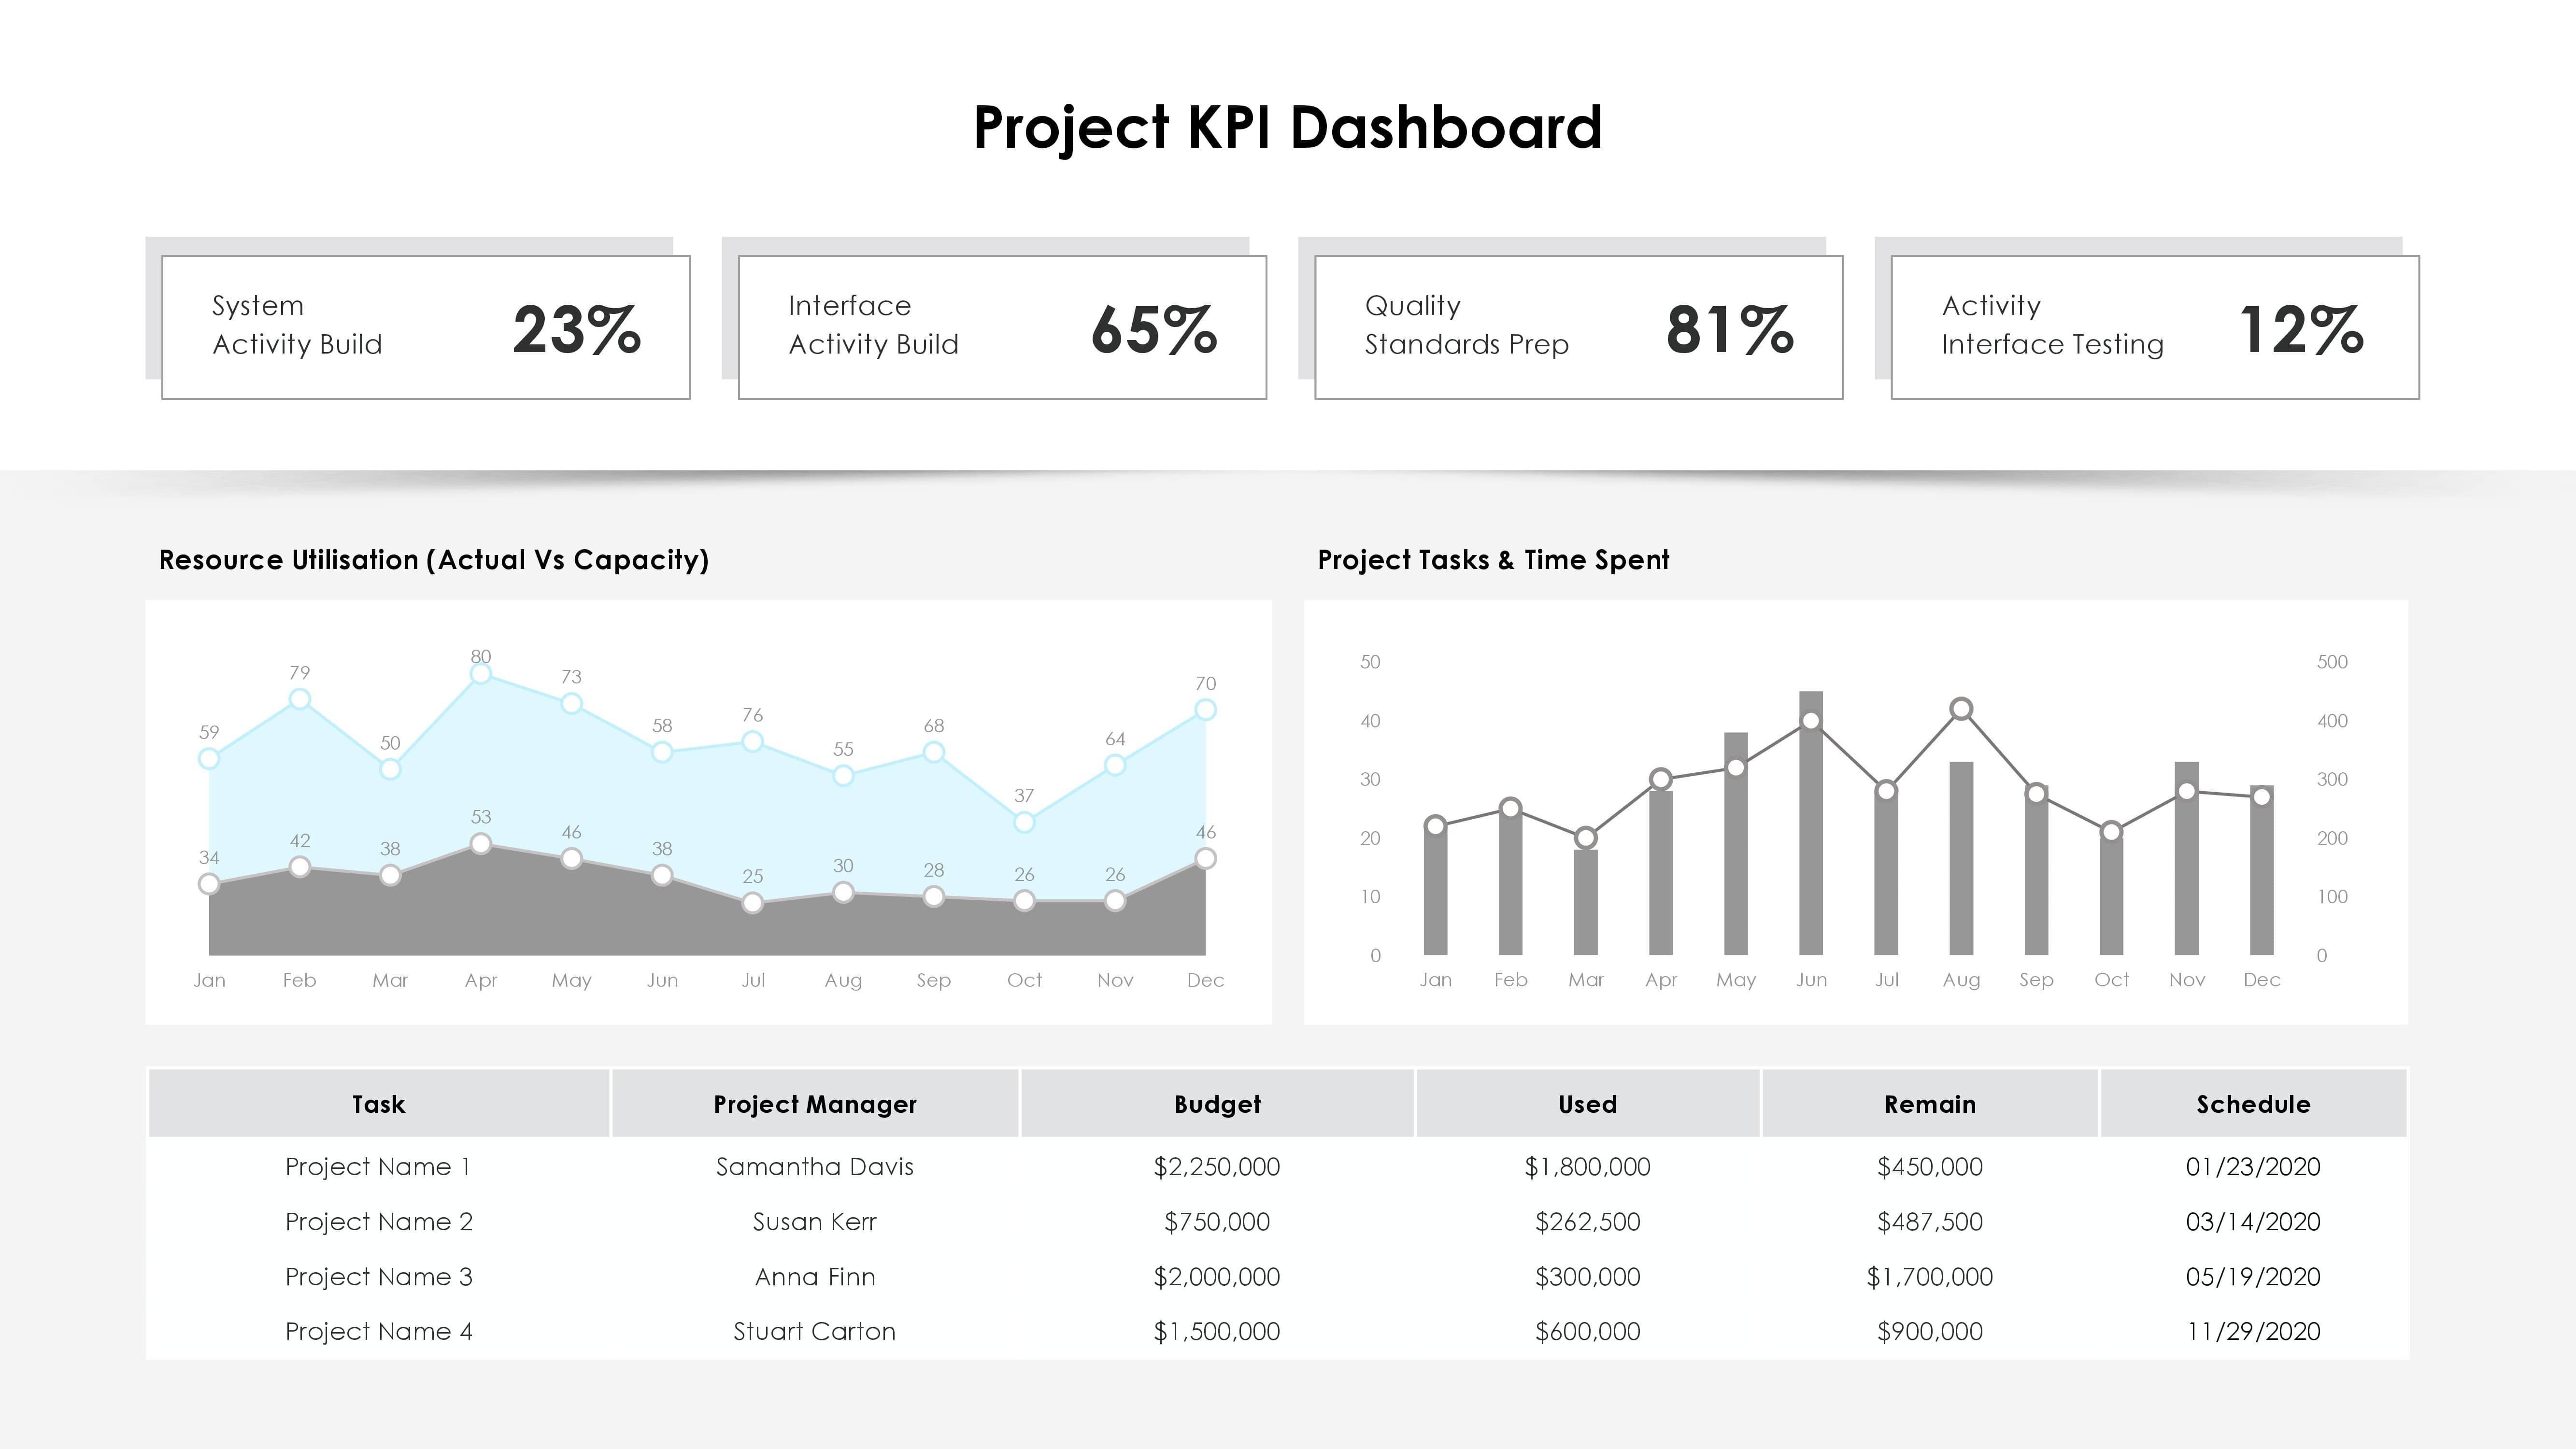
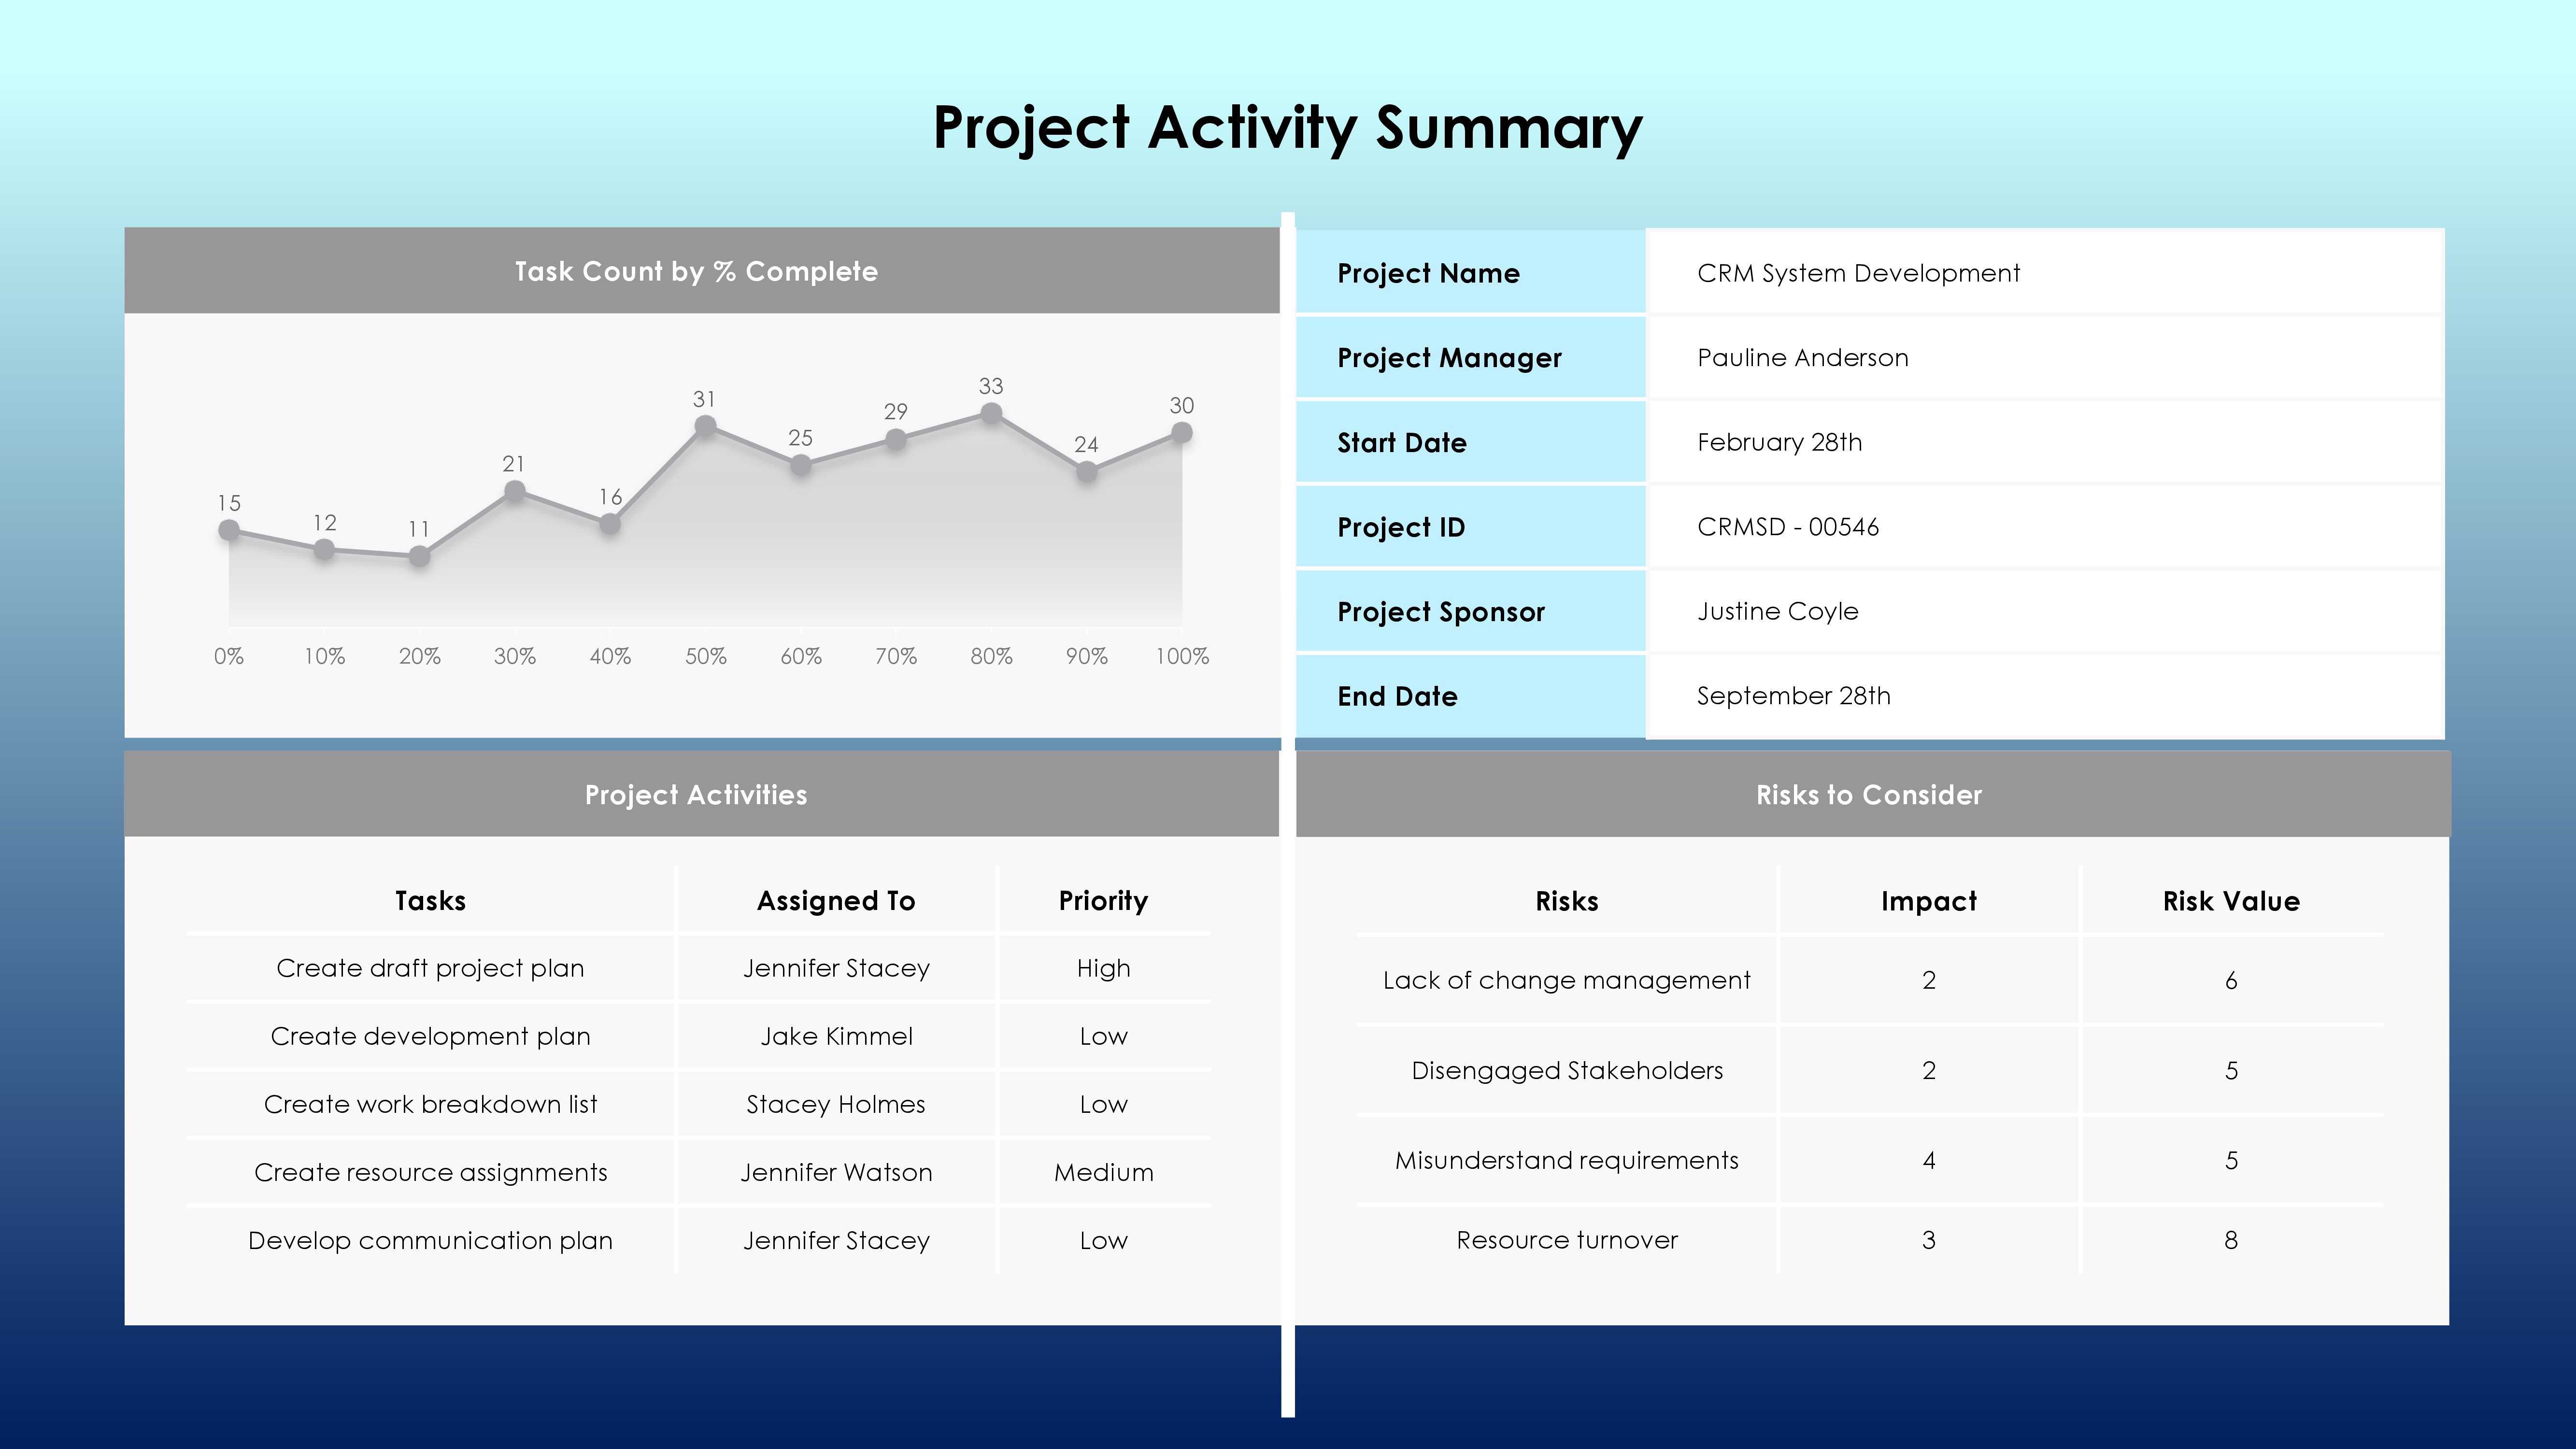
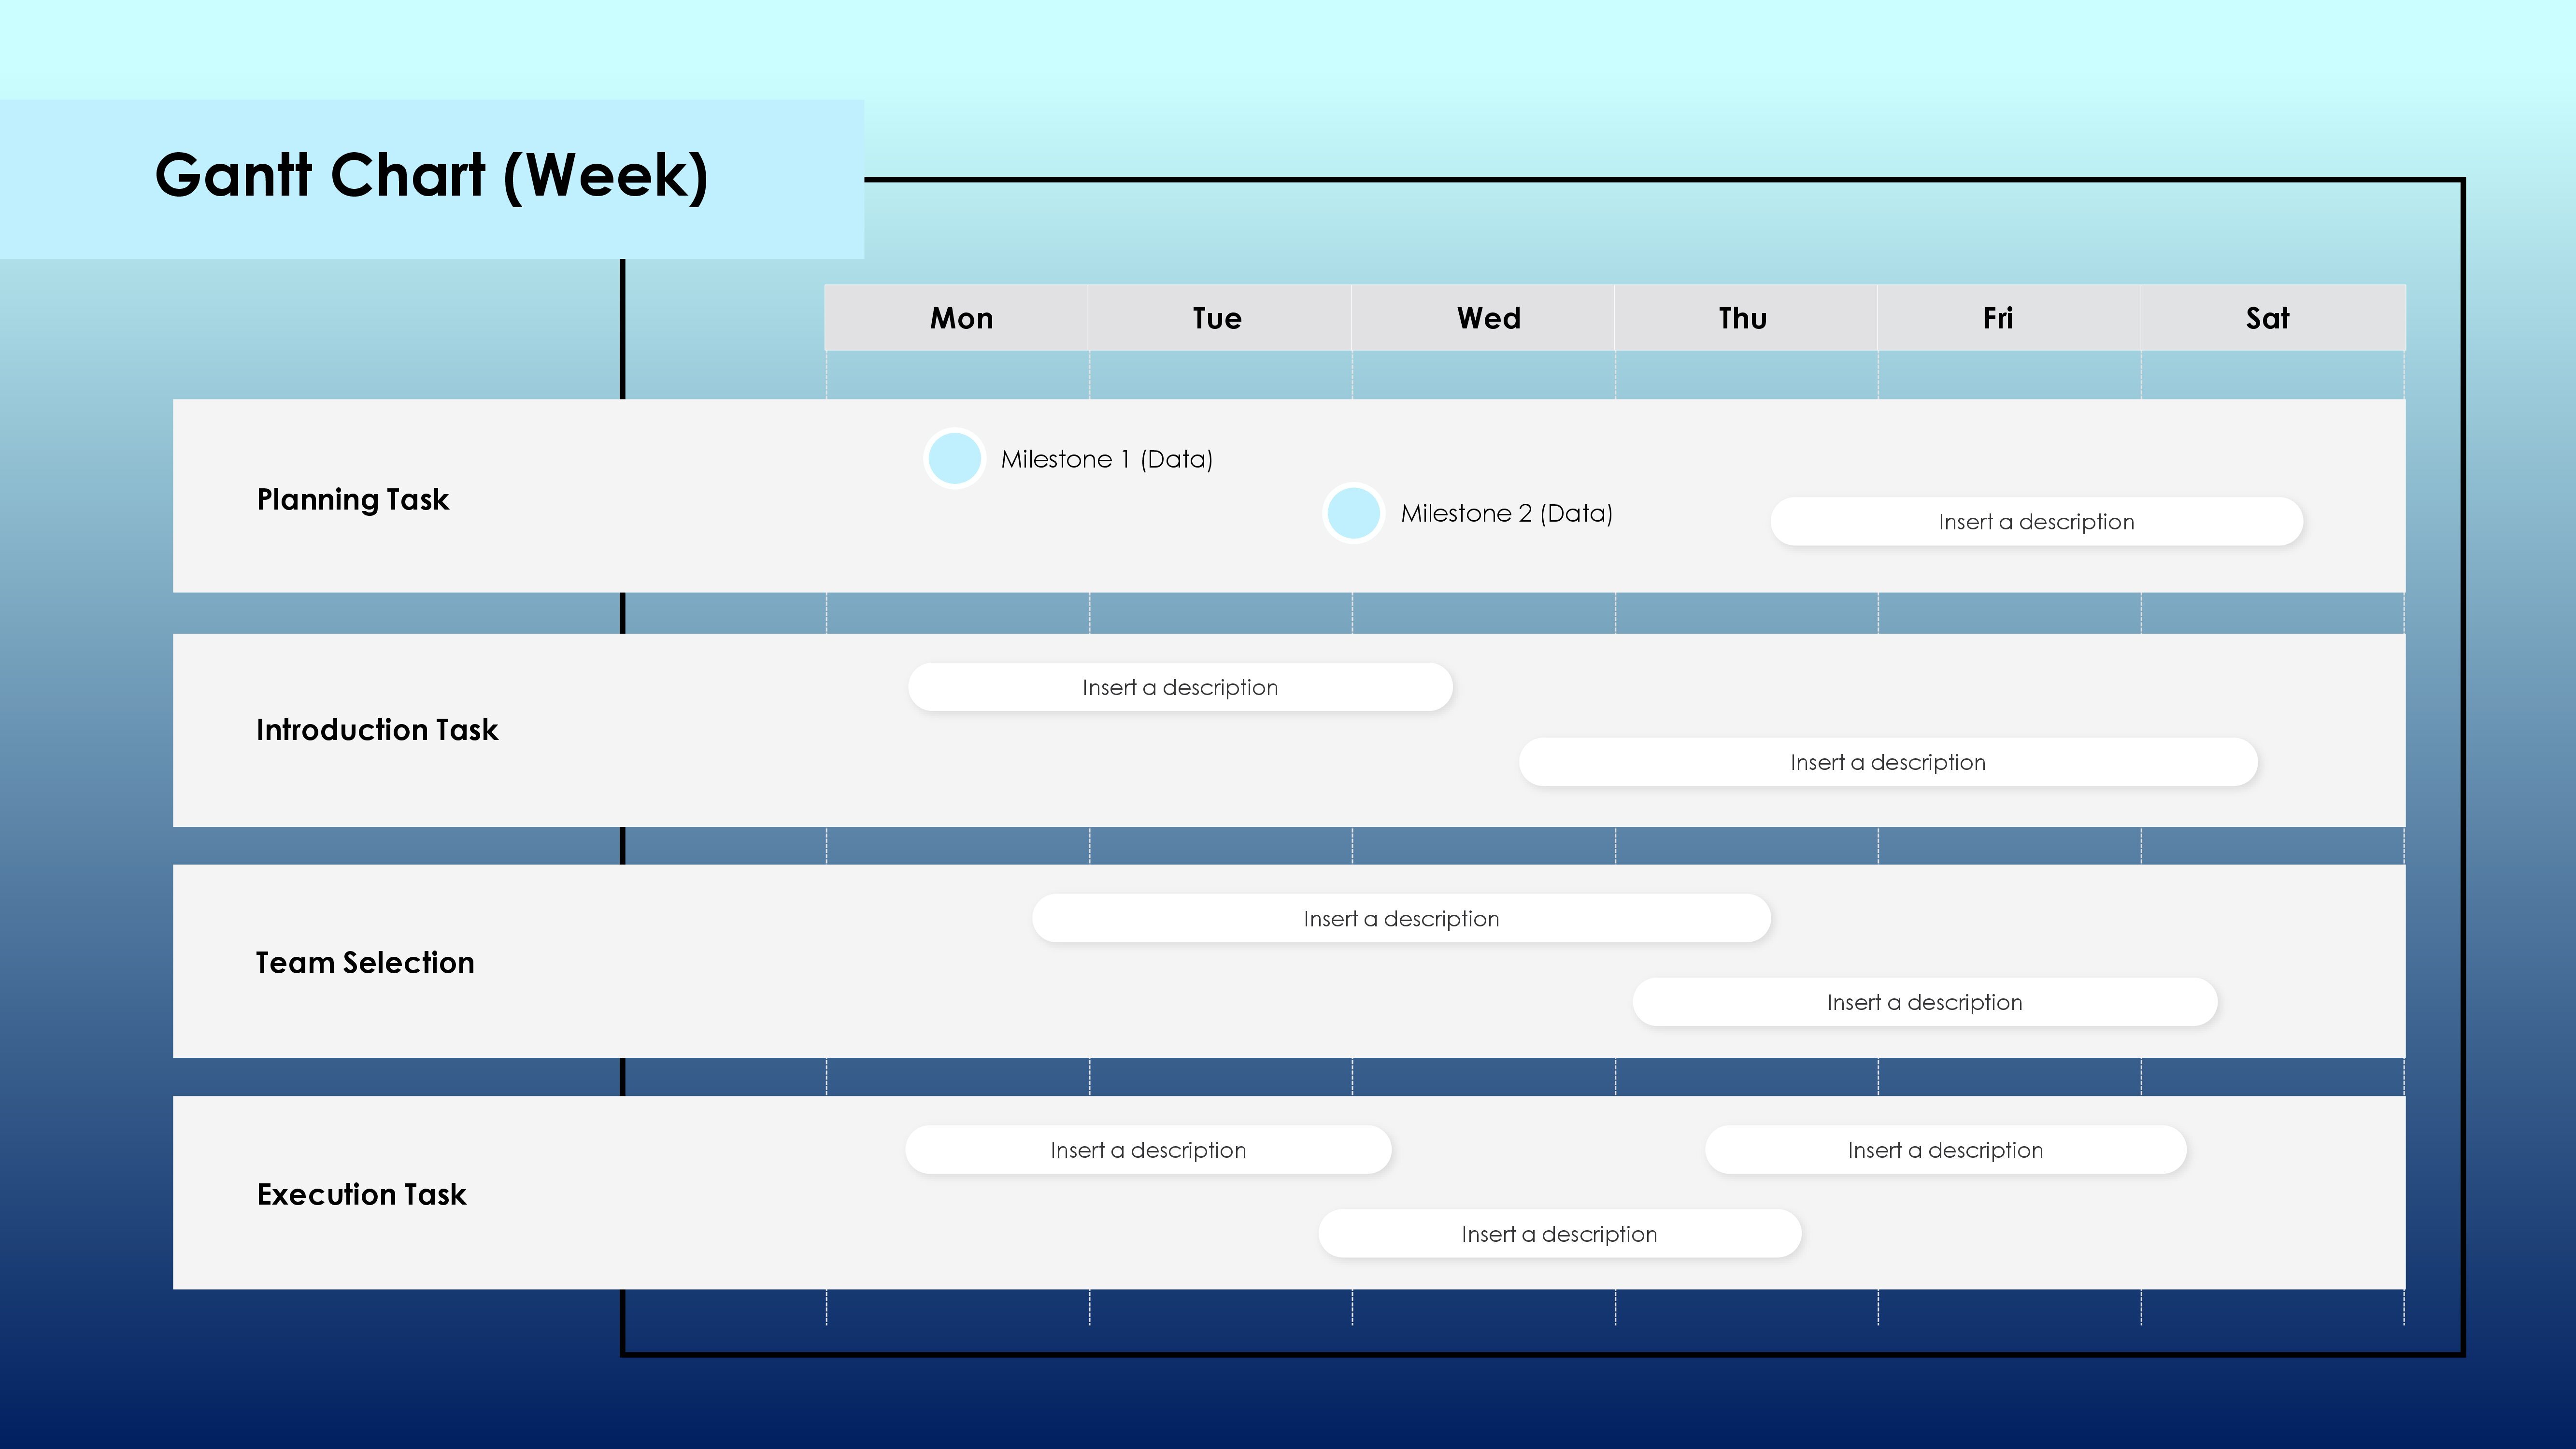
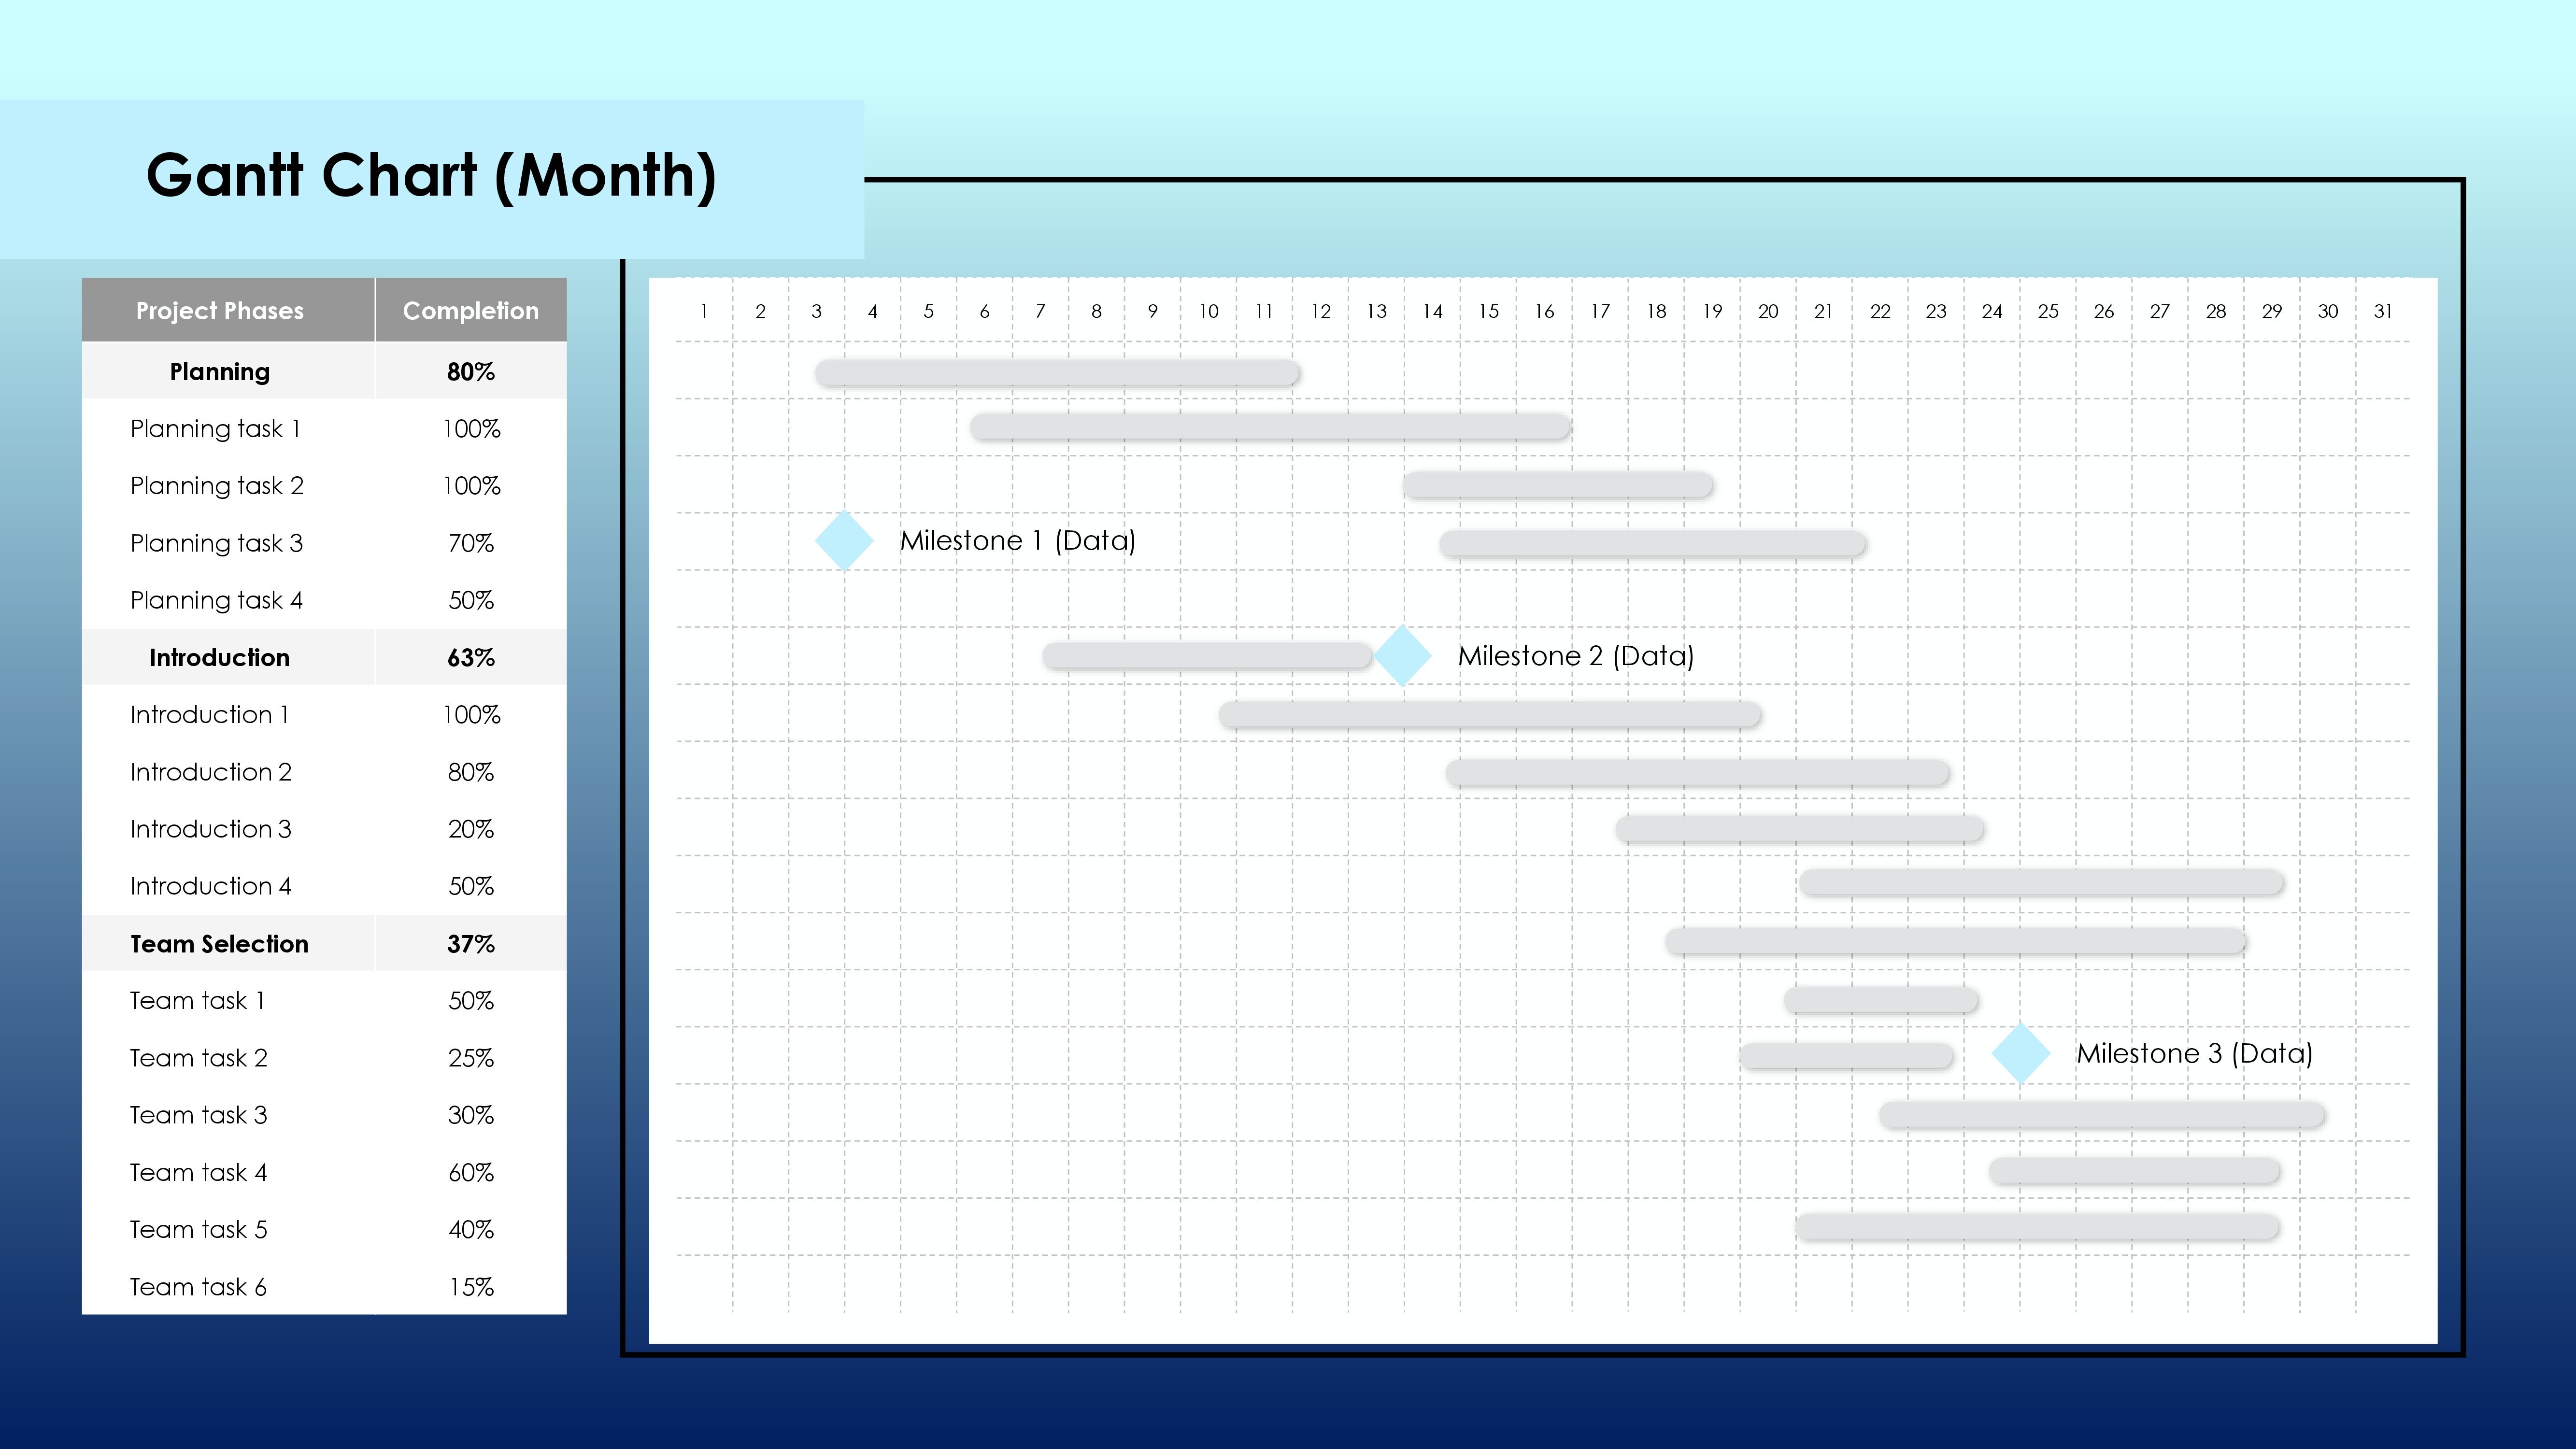
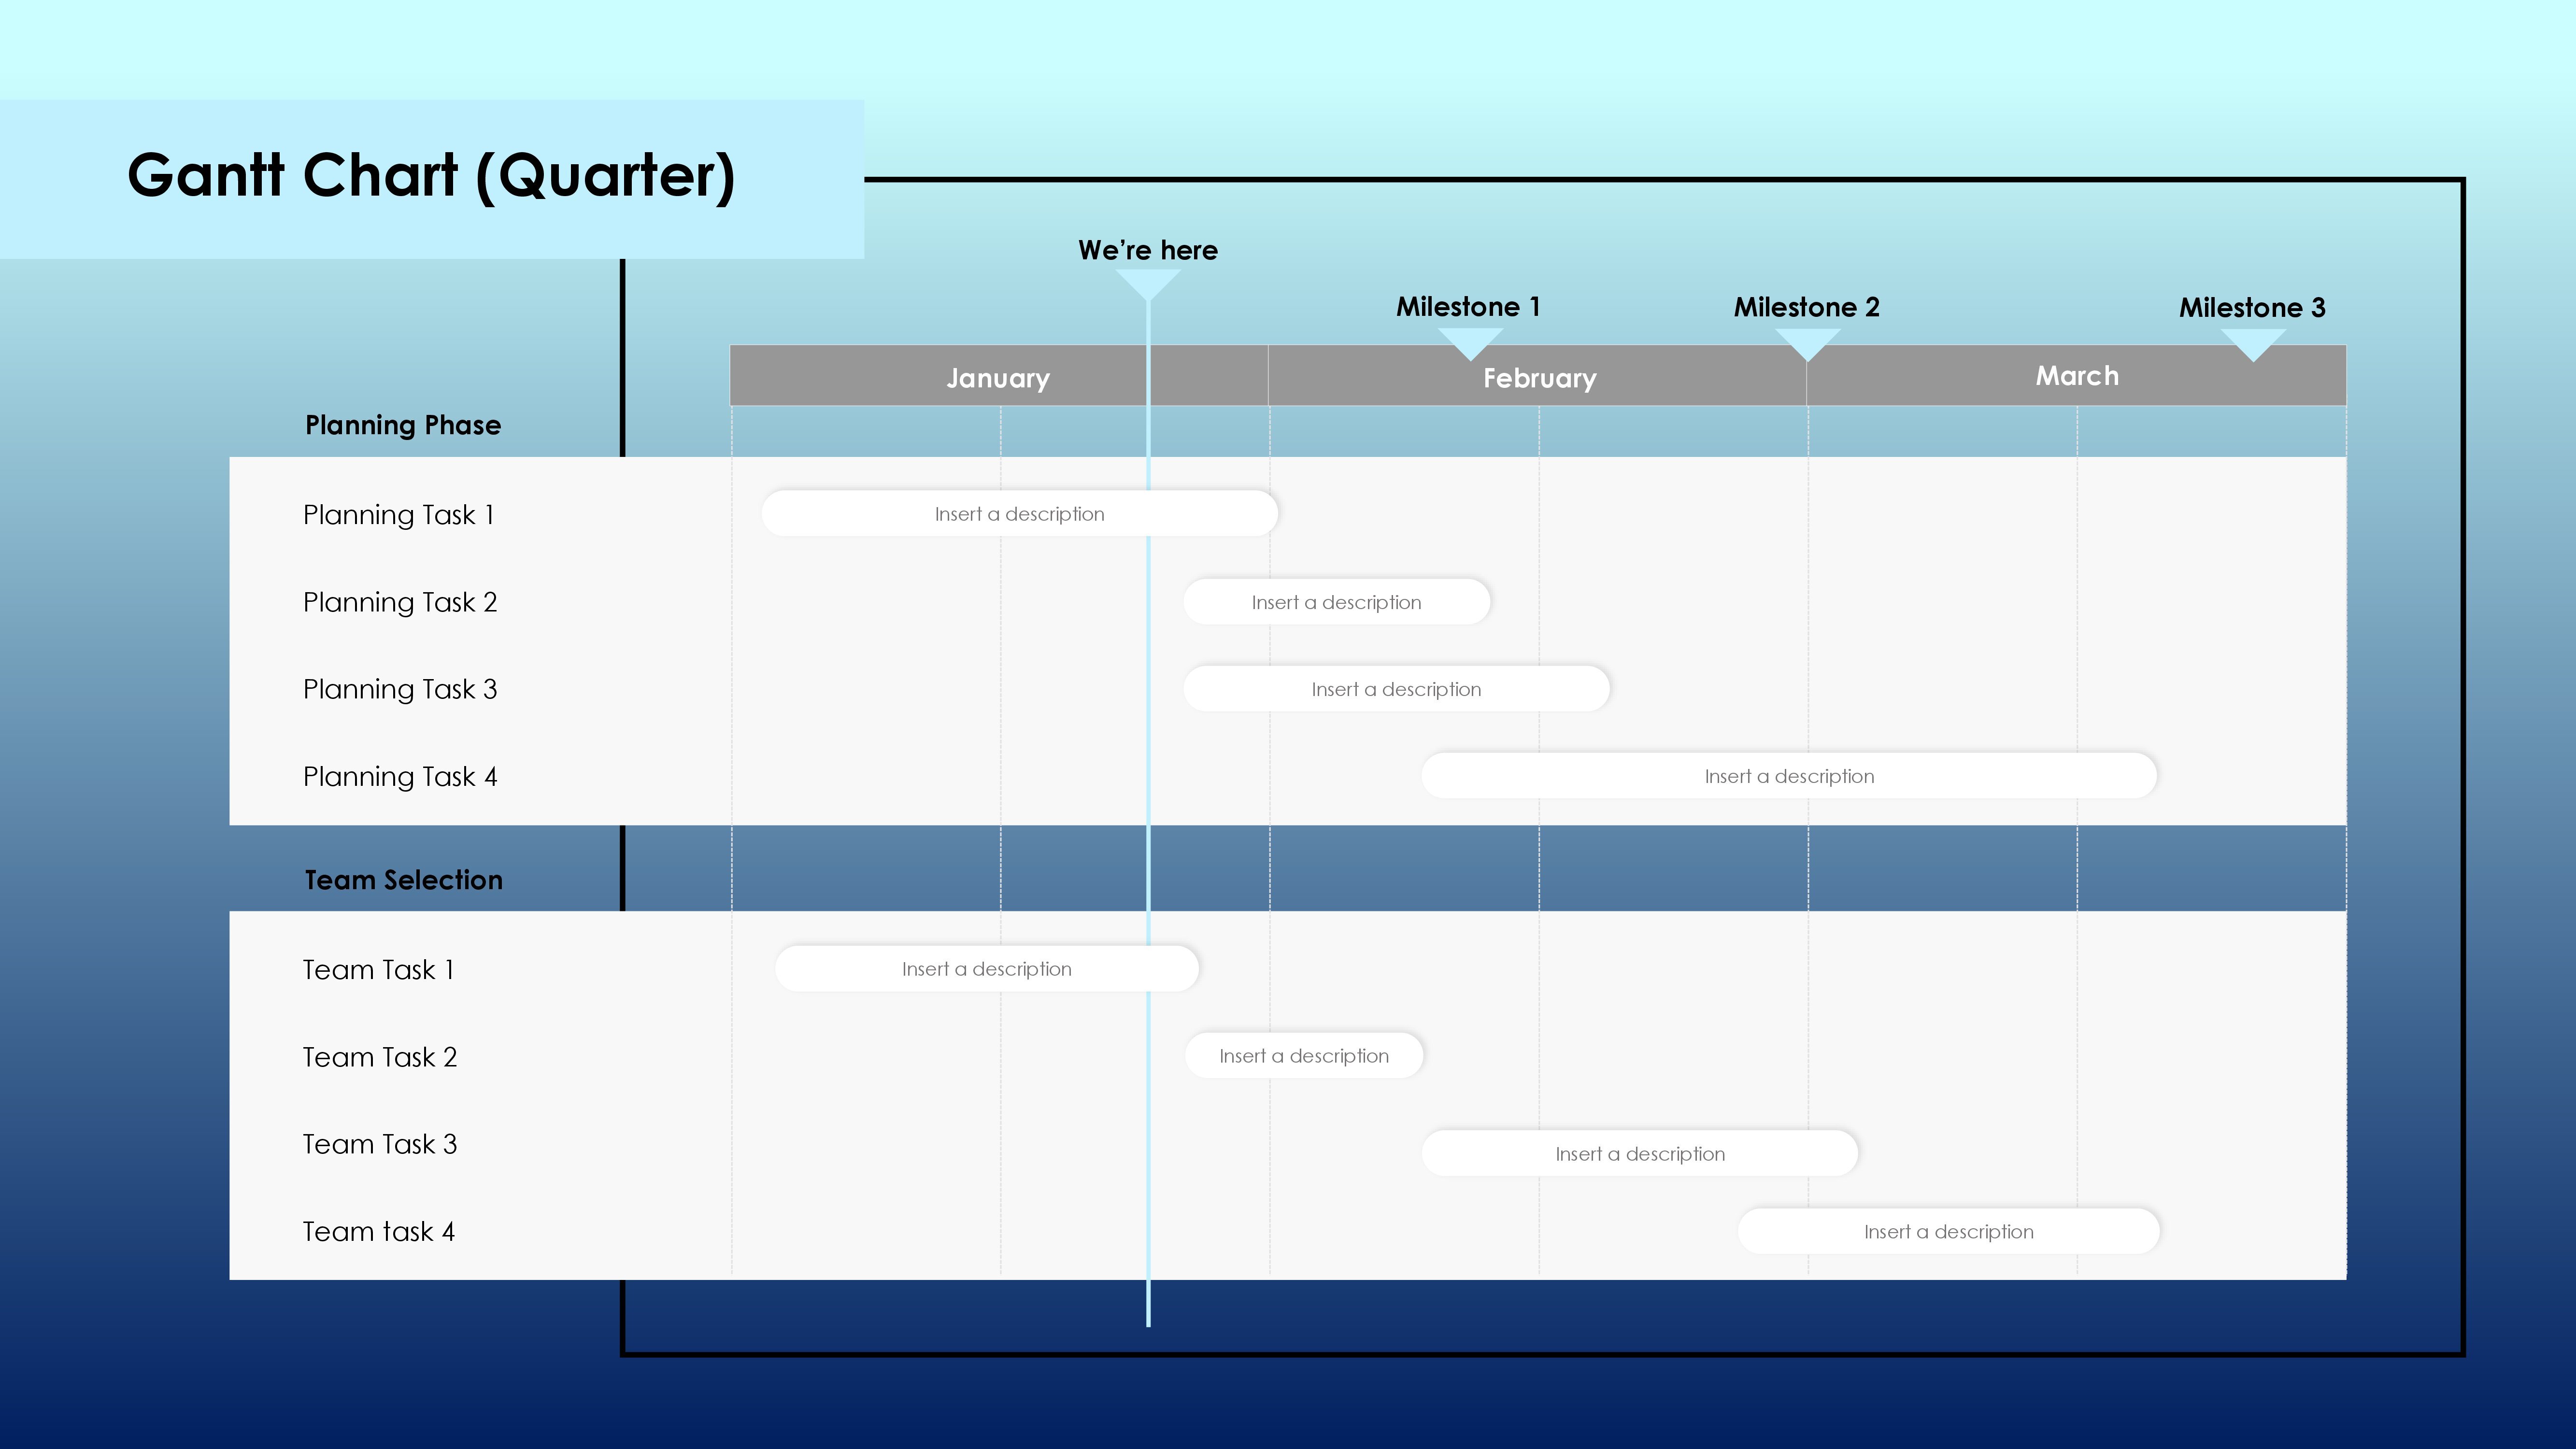
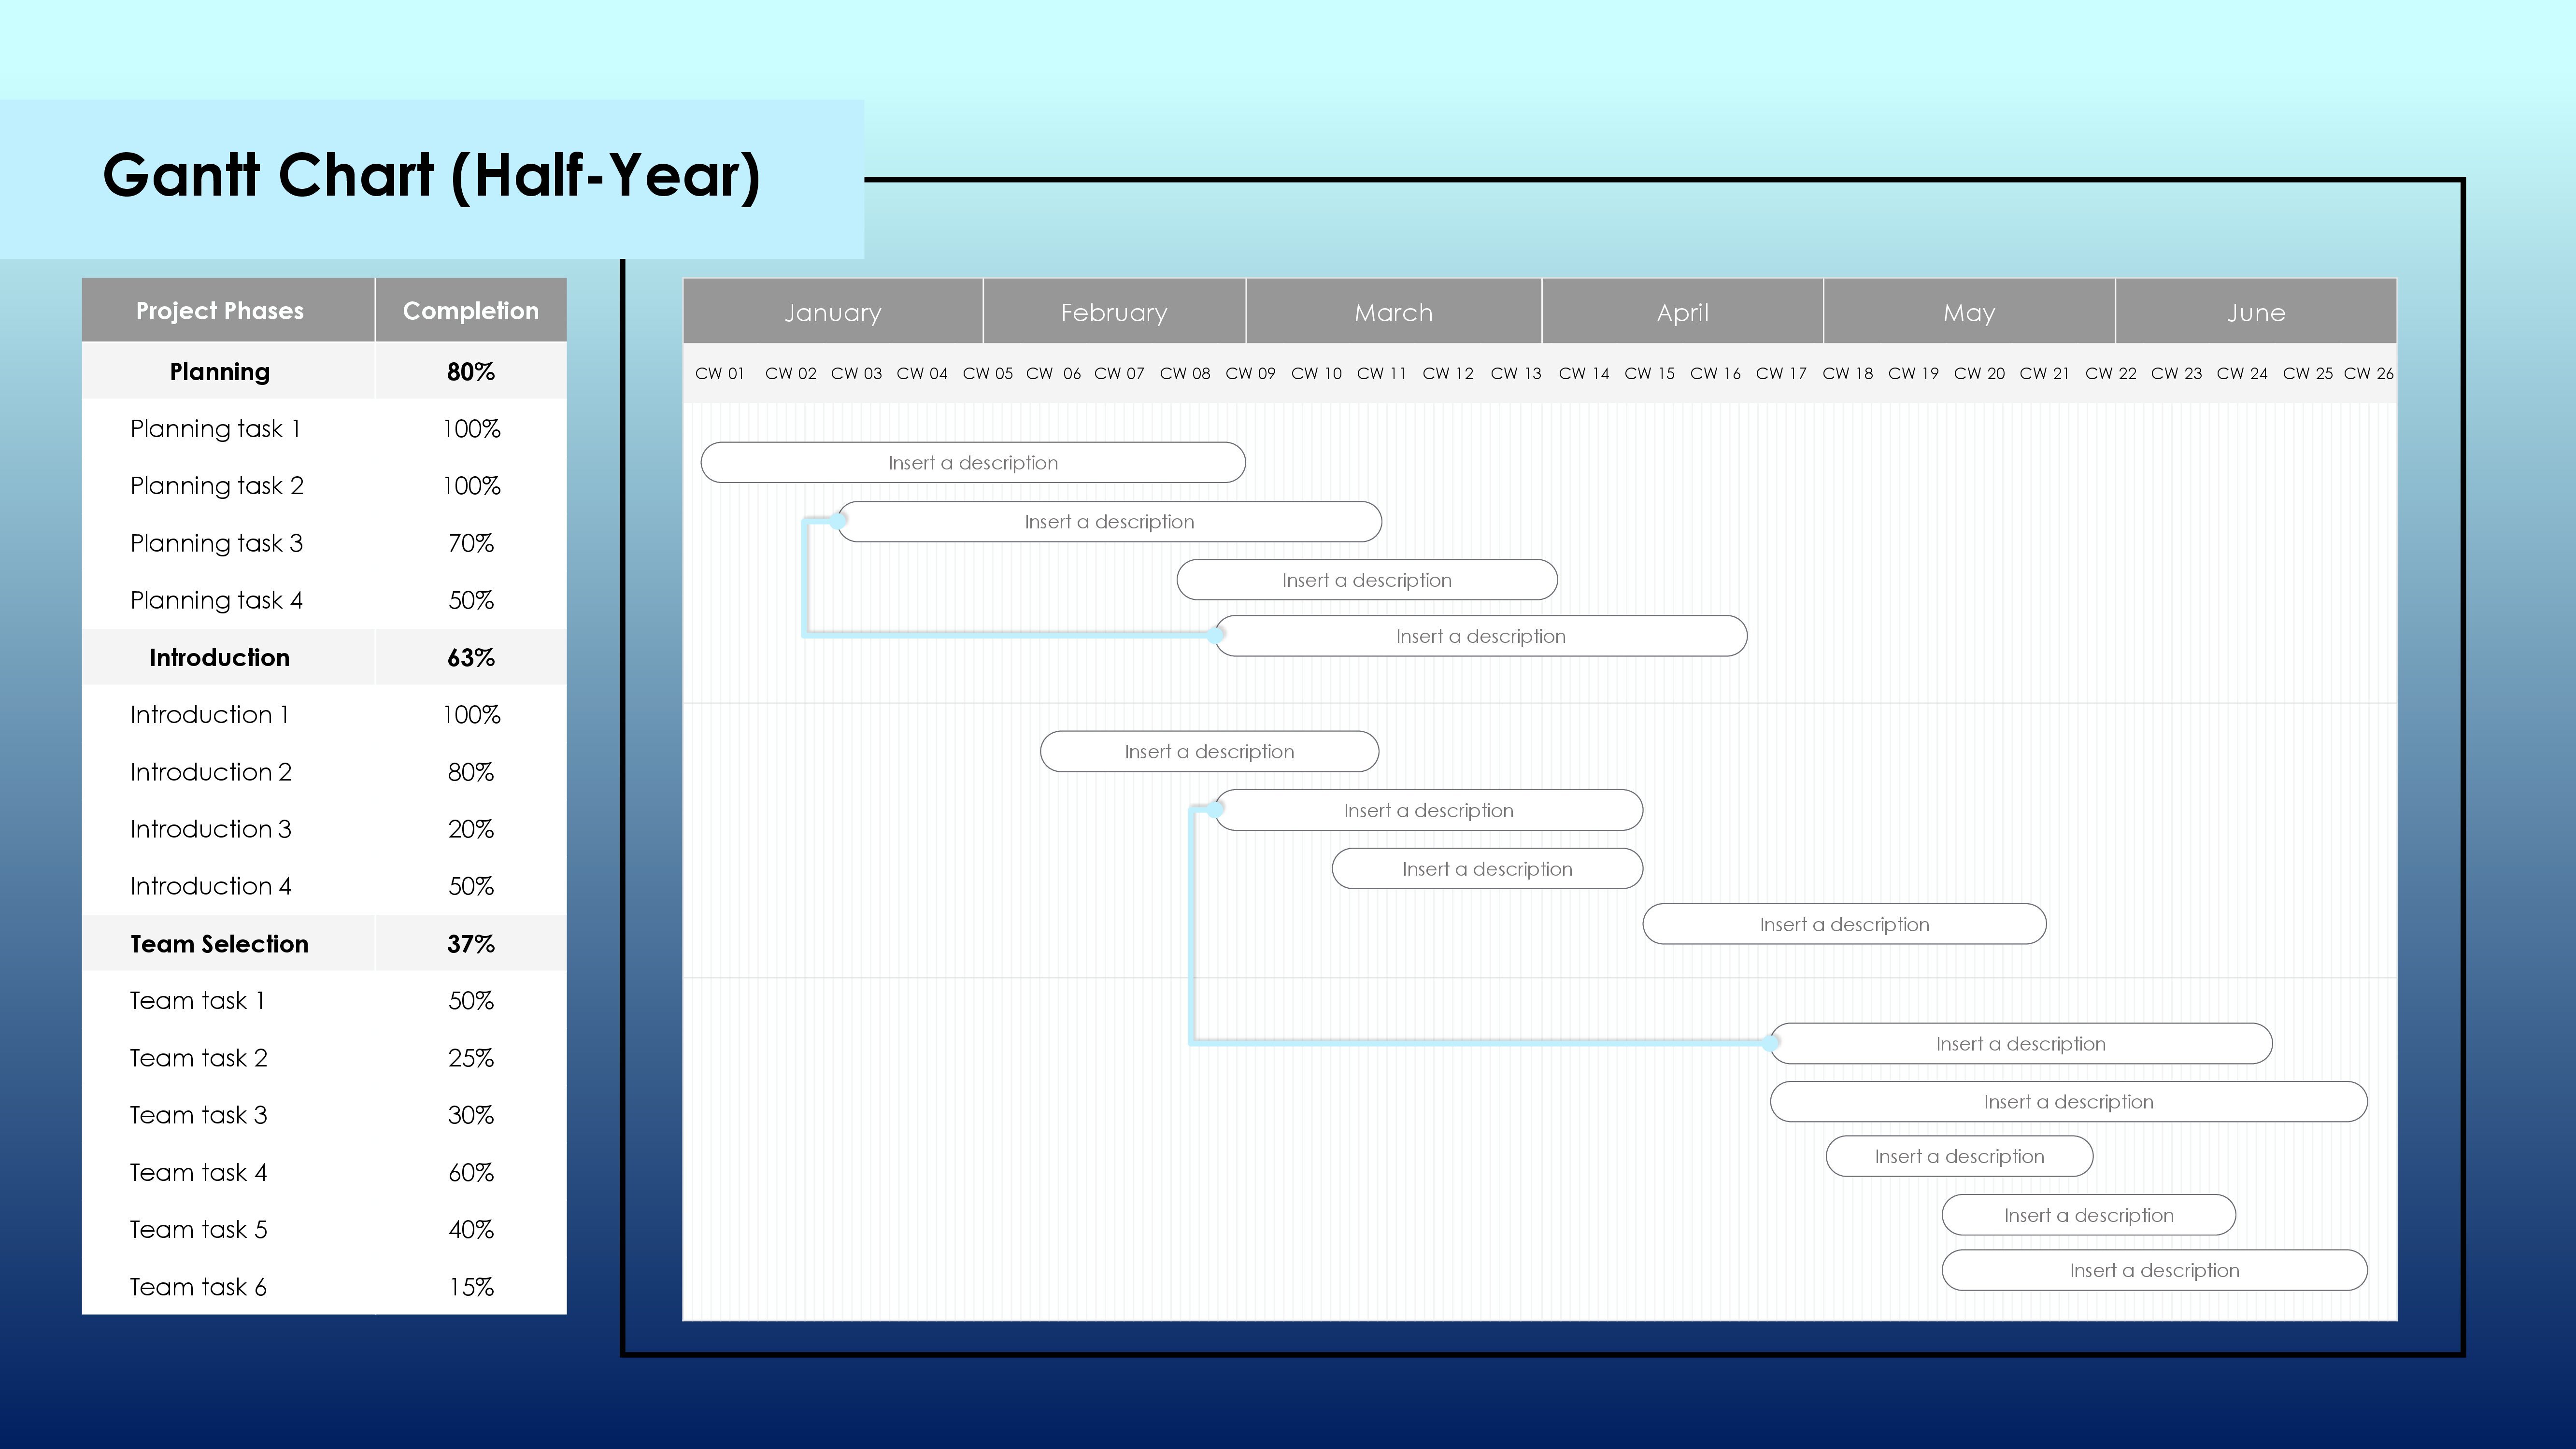
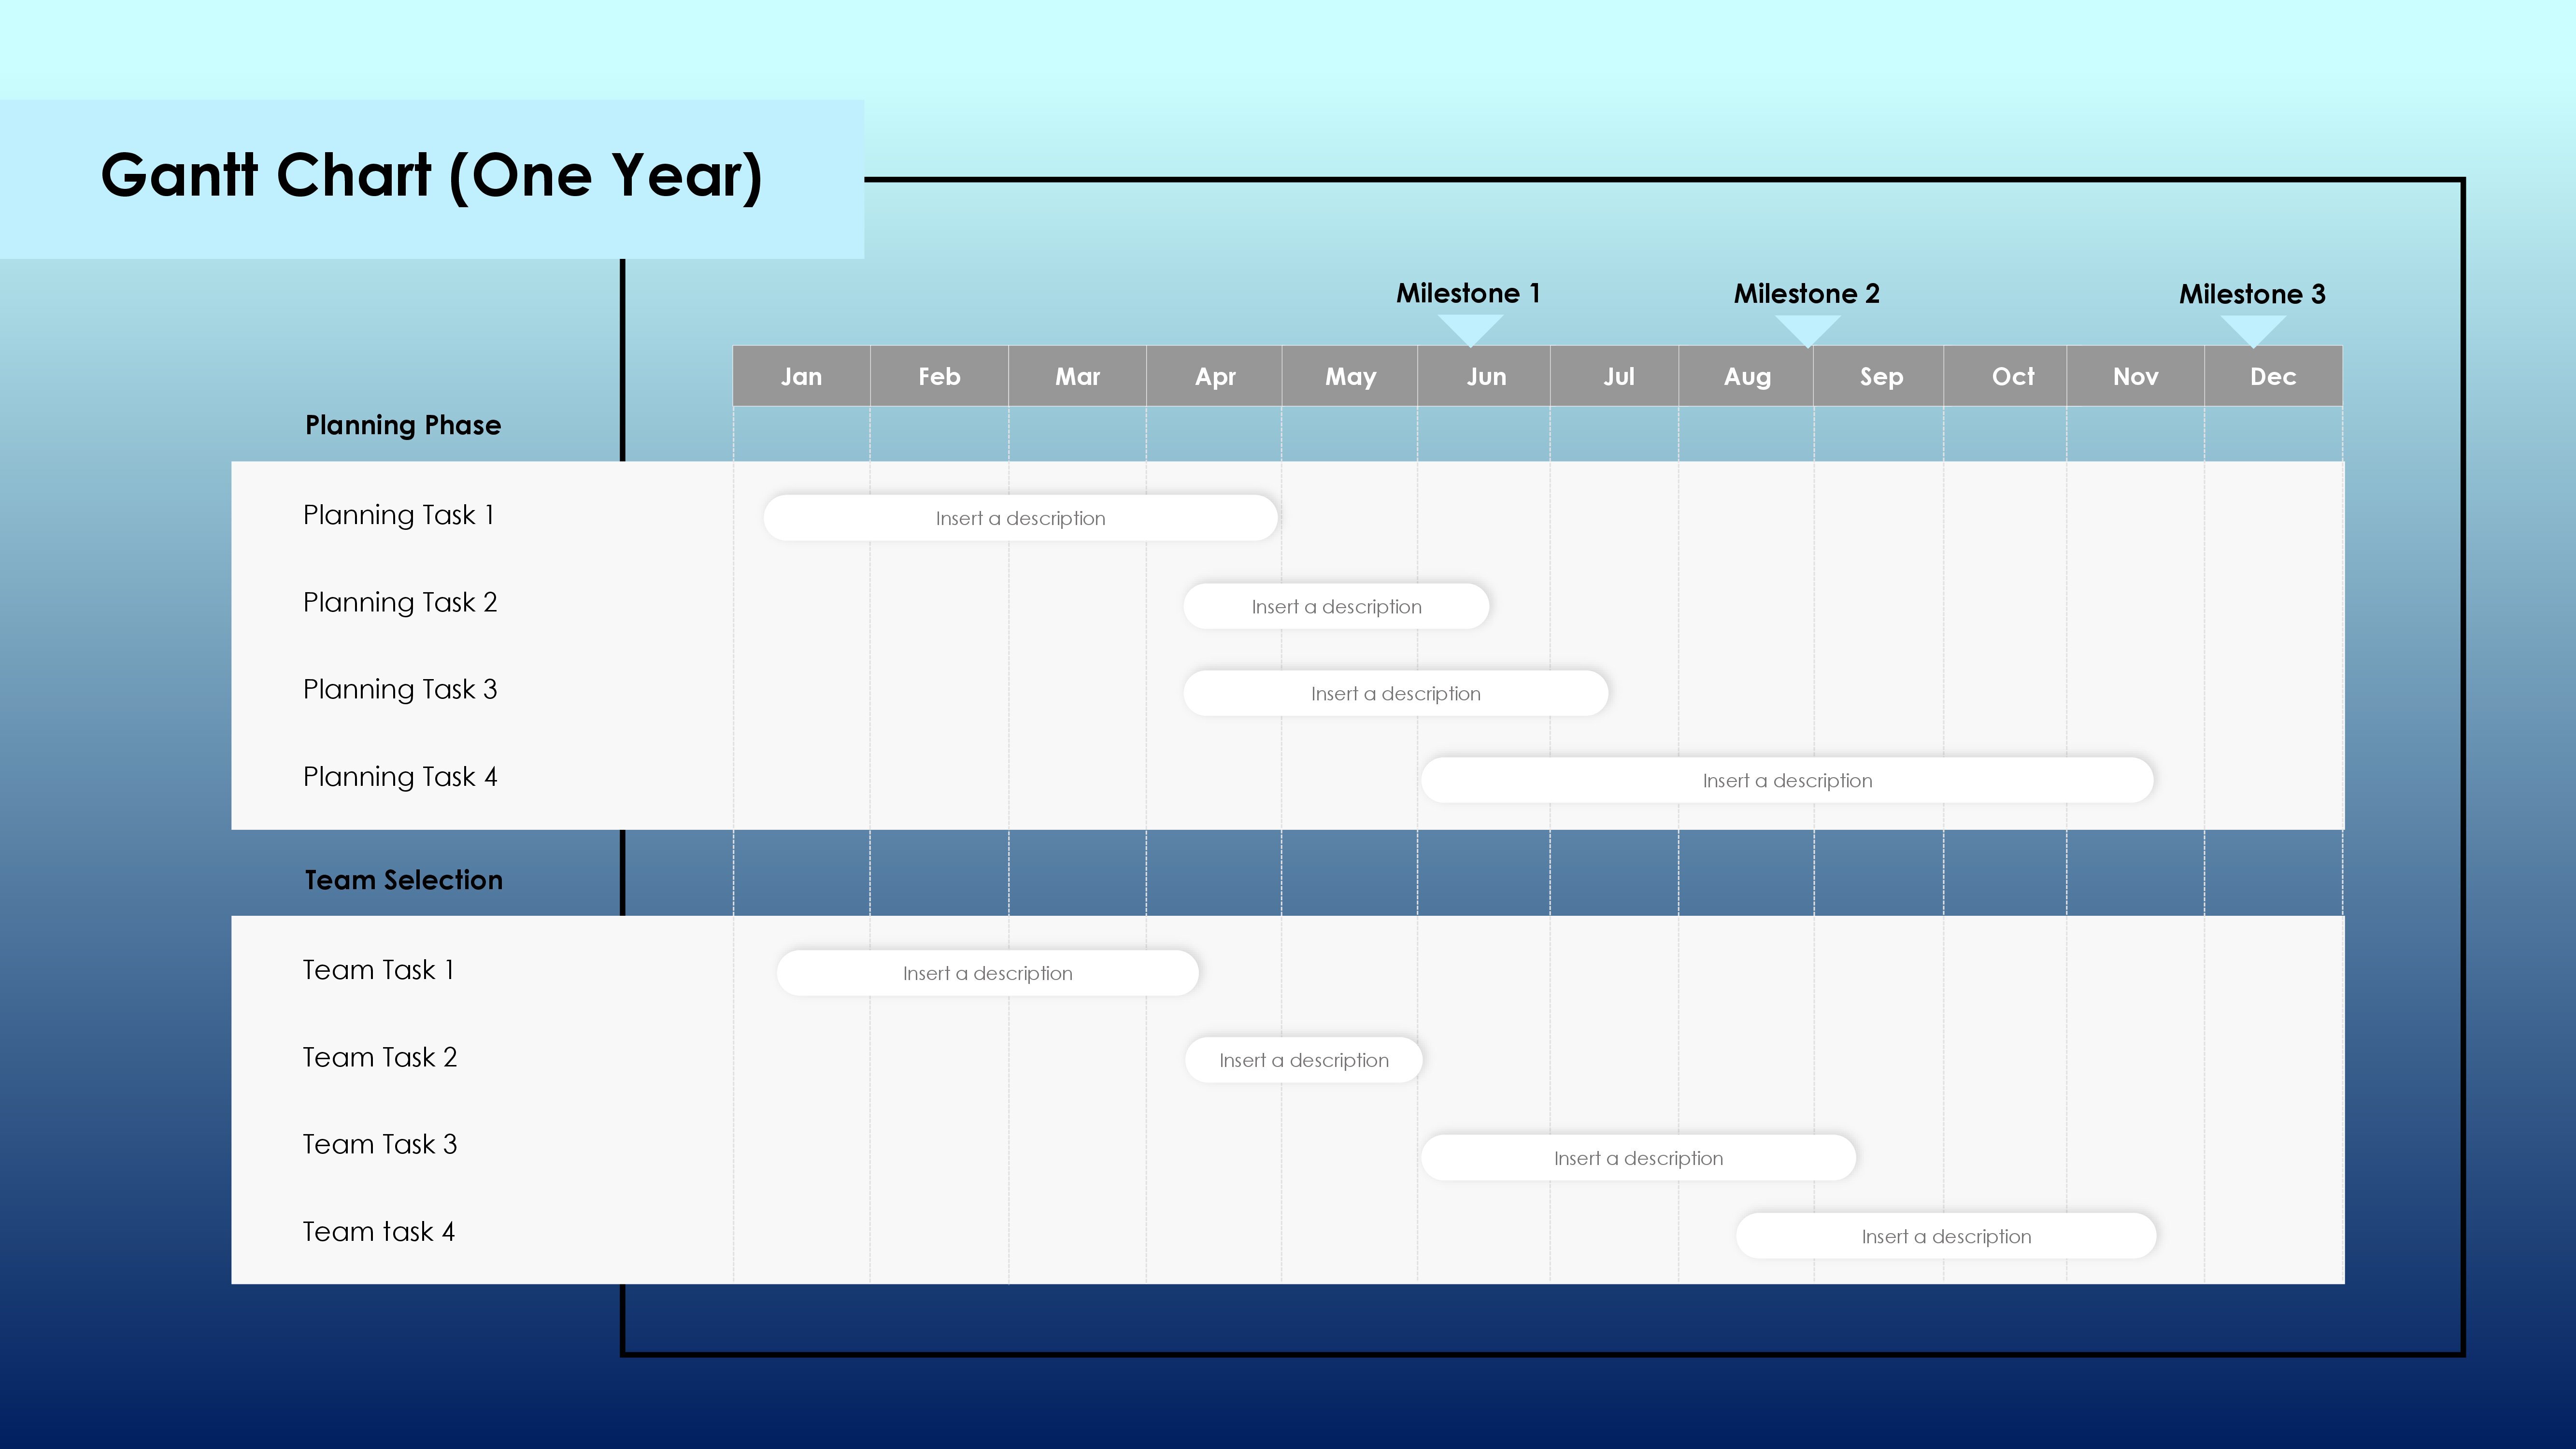
Project Status Report
A project status report will help you show your project status in an infographic presentation.
