

Originally published: 01/09/2021 08:41
Publication number: ELQ-37979-1
View all versions & Certificate
Publication number: ELQ-37979-1
View all versions & Certificate

Nursery Garden Excel Financial Model Template
This Model helps you to calculate the main relevant financial performance ratios and KPIs required by banks and investors to estimate business profitability.
Our mission is to be the industrial leader and pioneer in our business domainFollow 12
nursery garden financial modelnursery garden financial planfinancial modelfinancial analysisfinancial plandashboardthree statement financial modelbalance sheetcash flow statement
Description
Nursery Garden Excel Financial Model Template
Everybody would want to live in a lively surrounding especially in the days of Corona. You can easily plant a nursery garden earn money and be profitable in less time. This is because people are becoming more and more aware of health and fitness. If you have this business, you have plenty of options to earn revenue from the membership packages. You can increase your income by having sponsors or advertising and sell your products to other sellers, architects, or raw materials.
The success of this entrepreneur idea depends on the efficiency with which you run the business. The first step you can take is to have a proper Nursery Garden Excel Financial Model template consisting of all relevant financial statements. It will enable the user to make sound decisions by considering all operational and financial risk factors.
The Financial Model is highly adaptable and dynamic for forming a 5 year monthly and yearly 3 statement ( Income Statement, Balance sheet, and Cash Flow Statement) financial projection for a startup or existing agency. This model also consolidates a discounted cash flow valuation calculation by using the projected Free Cash Flows.
The Nursery Garden Financial Model also calculates the main relevant financial performance ratios and KPIs required by banks and investors to estimate business profitability and liquidity.
# Key Inputs of the Nursery Garden Excel Financial Model Template
1: The growth rate Price and Expense.
2: Various Bouqerts with prices and segmentation of revenue.
3: Marketing Budget Sheet (which measures how many customers we get from marketing).
4: Revenue Assumptions.
5: Average Payable and Receivable days your business is following.
6: Cost of Goods.
7: Fixed Asset and Capital Expenditure.
8: Tax Rate
9: Investment table
10: Loan table
# Key Features of Nursery Garden Excel Financial Model Template
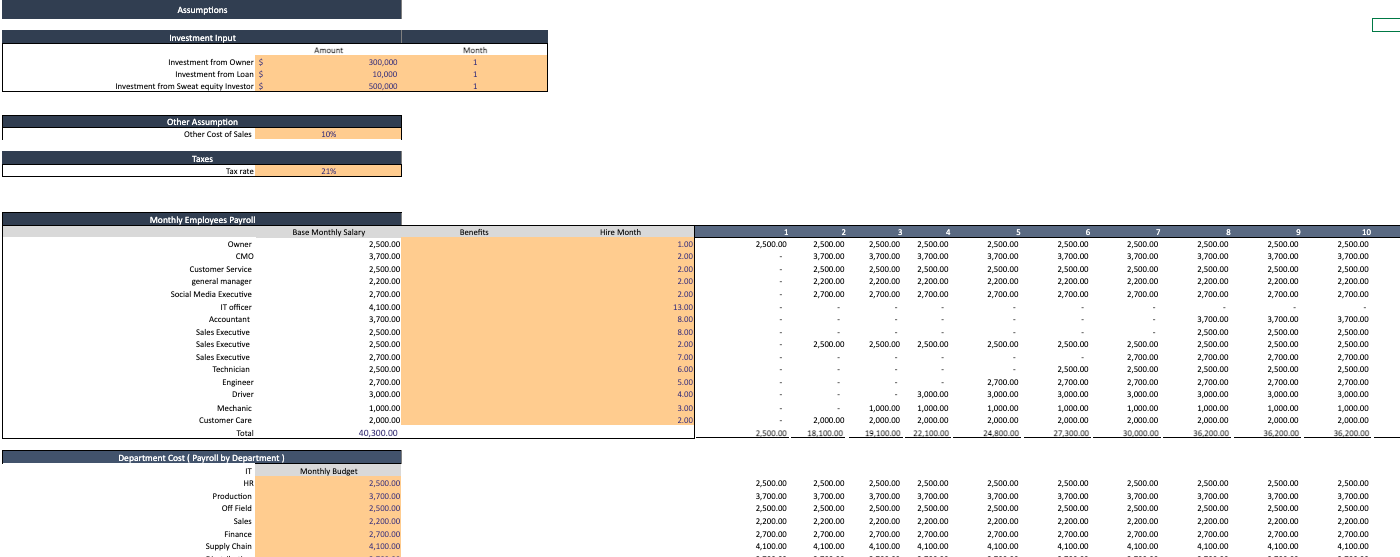
1: Input Sheet
This financial model template contains inputs that, when changed, impact the calculations and, therefore, the changes are applied to all relevant sheets. This financial model always has built-in flexibility to display different outcomes or final calculations based on this sheet’s changes.
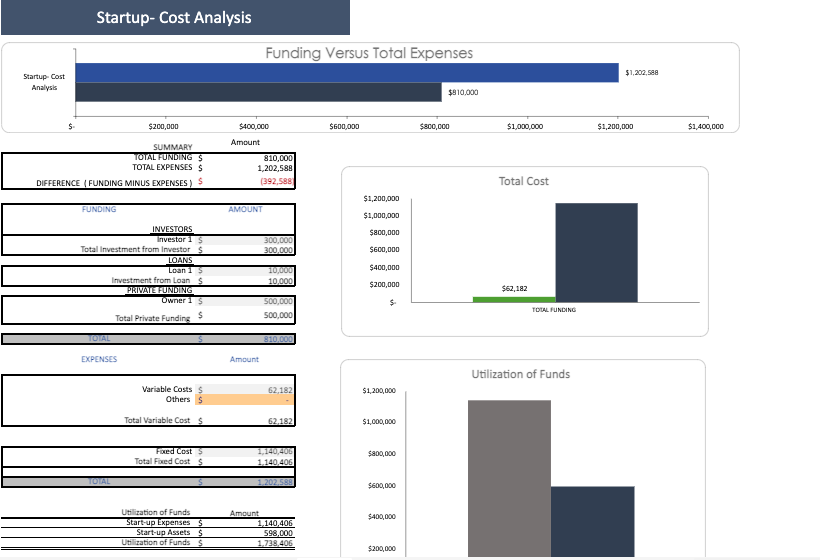
2: Startup Summary
A start-up summary tab includes the total cost incurred at the start of business and capital expenditure, how much cash injected by the company so far, and the amount of investment required is calculated based on the number of months.
A Startup Summary helps you take a realistic view of your idea and double-check whether the business has enough funds to support operations.
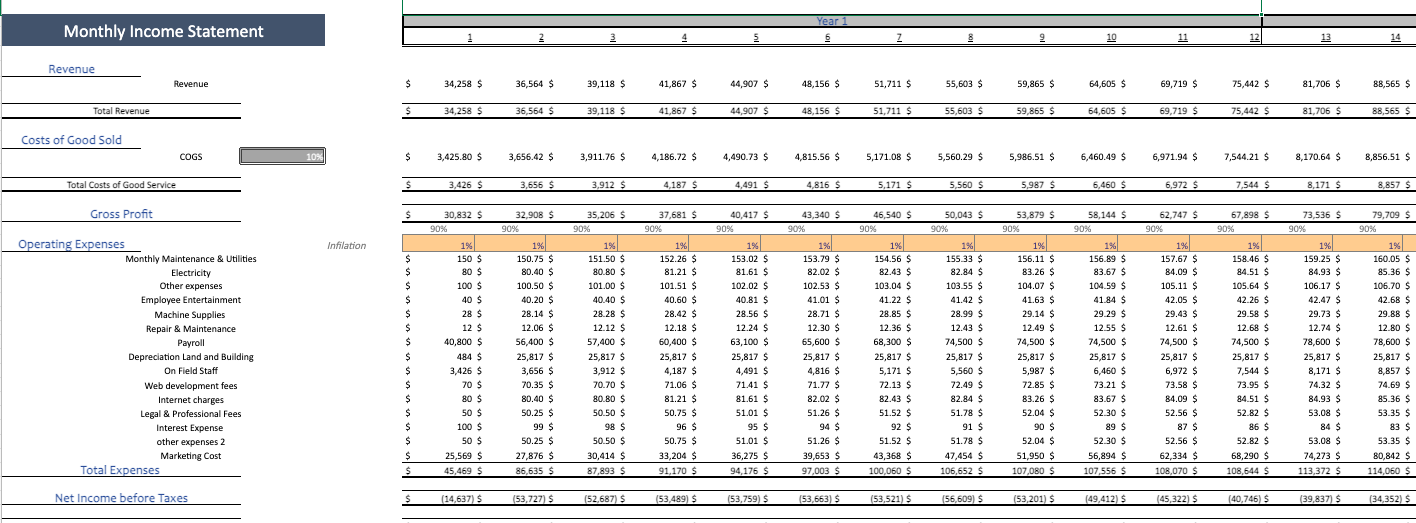
3: Monthly & Yearly Income Statement
The Nursery Garden Excel Financial Model provides the monthly as well as yearly income statement structure. The framework for creating a full corporate forecasting model tailored to your particular business.
An integrated financial model is powerful since it enables the Financial Model user to change any assumption in one part of the statement to see how it impacts all other parts of the statements accurately and consistently.
The monthly Income Statement sheet of the Financial Model is perfect for those who require regular reporting and details. Additionally, Income Statement contains all revenue streamlines with gross earnings, net earnings linked with a revenue analysis sheet to ensure accurate reporting.
Oak Business Consultants understands nursery garden business goals. Therefore, we have developed a mechanism that helps business owners determine whether they are making profits or otherwise.
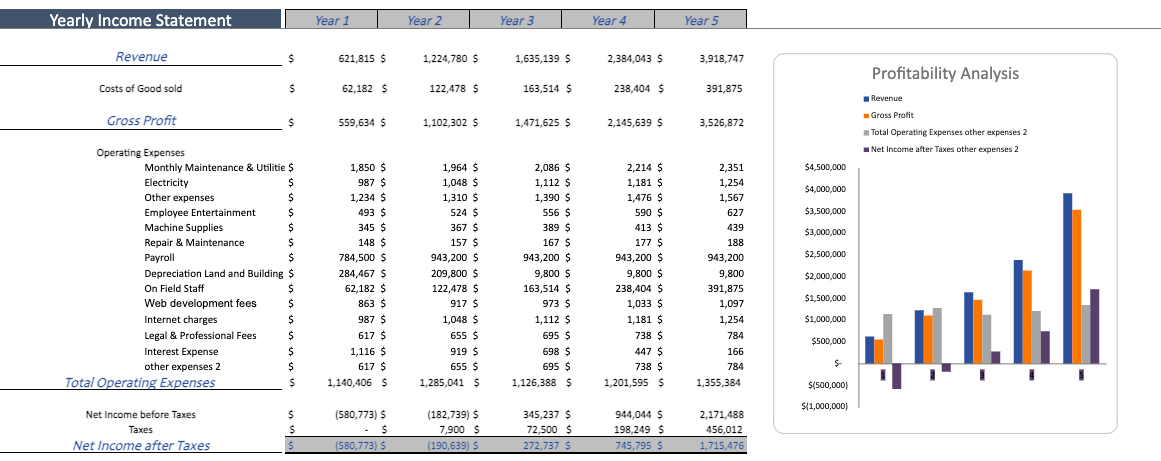
Furthermore, the Yearly Income Statement gives you complete insights into revenue and general & administrative expenses. The Yearly Income Statement also contains several graphs, assumptions, ratios, net profit, cost of services, and profit after tax.
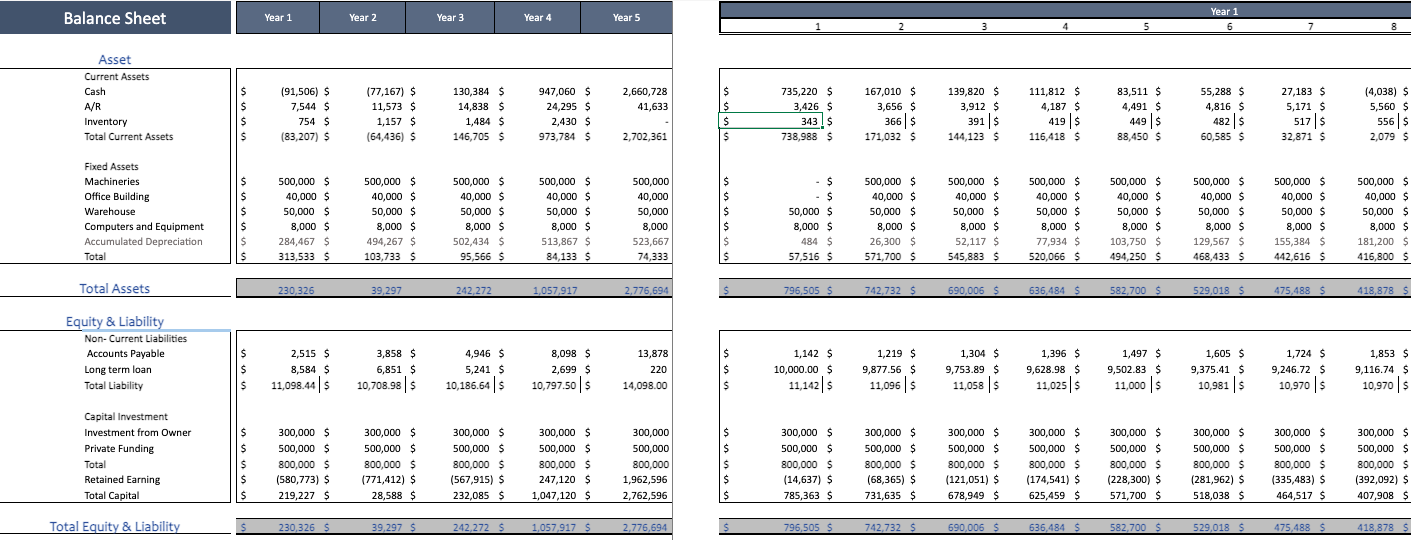
4: Balance Sheet
This balance sheet enables you to analyze your position of current assets, fixed assets, liabilities, and equity. This also allows you to monitor your accounts receivable, accounts payable, accrued expenses, etc. Therefore this specific, financial model gives you the perfect space to analyze your key financial balance accounts.
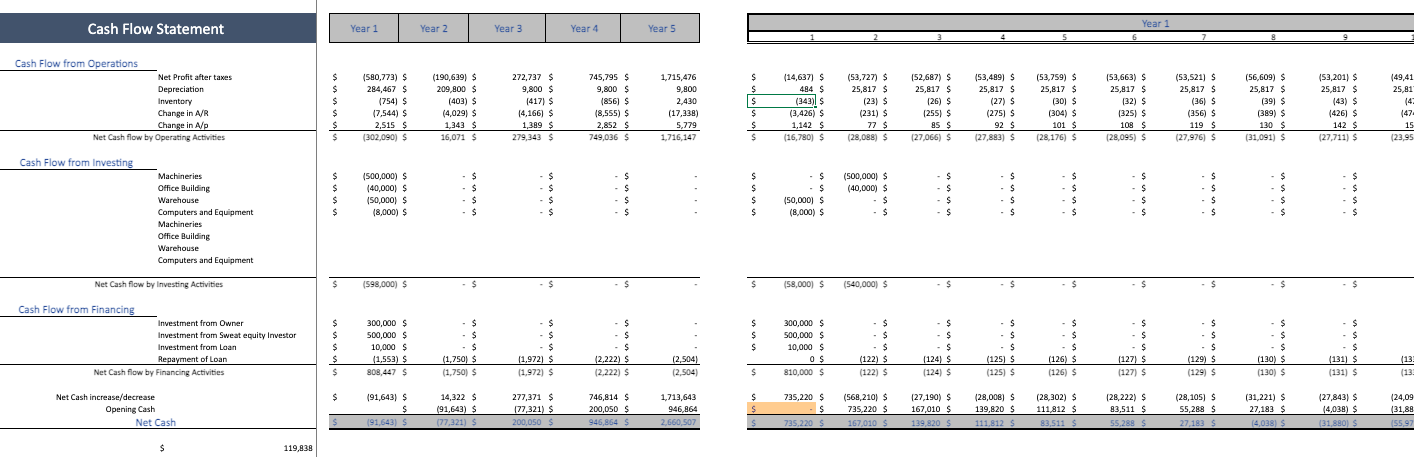
5: Cash Flow Statement
The Cash Flow Statement is the vital part of the three statements that report the cash spent and generated during a specific period. The Cash Flow Statements act as a bridge between the income statement and balance sheet by how money has moved in and out of business.
#Three main sections of Cashflow Statement:
1: Operating Activities: We have included all cash in and out related to the operations of the business.
2: Investing Activities: Any cash from the disposal of an asset and investments included in this section and linked to the inputs and fixed asset tab.
3: Financing Activities: We have separately made a loan-related tab where you can enter all loan-related information thee. The tab is linked to Financing Activities of Cashflow Statement.
The Cashflow Statement in our Model contains a dedicated sheet to monitor and analyze your company cash-ins and out. This cash flow statement is based on several key inputs: Payable and Receivable Days, yearly income, working capital, long-term debt, net cash, etc.
This calculation then computes your net cash flow, beginning and end cash balances. This is a perfect template for your company’s cash flow management.
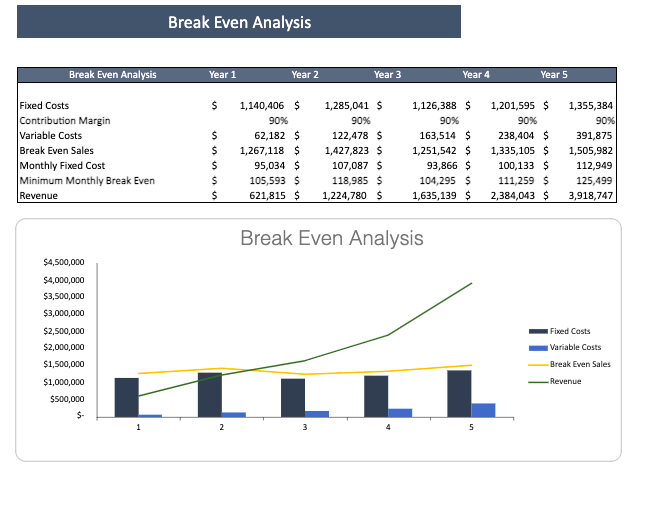
6: Break-Even Analysis
A break-even analysis can help you measure how different scenarios might play out financially. For example, if you increase the marketing budget or add another employee to the payroll, how many extra sales will be needed to recover that additional expense?
As a coup, we have included a Break-even analysis to our Financial Model, which will help the user determine sales. The break-even analysis will help you know at a glance the profits generated at the various sales levels. The Break-Even Analysis refers to the total sales contribution refers to fixed cost at zero profit and loss. This Technique is primarily based on marginal costing, which behaves differently at various levels of output activity.
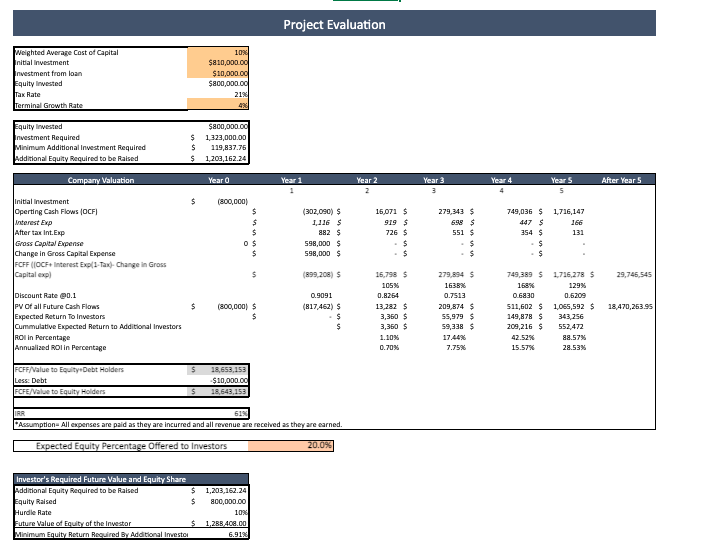
7: Project Evaluation
Since the table calculates Return on Investment, Investor’s Future Equity Share, and Cash Burn Rate Analysis, analyzing the company’s performance becomes easy to capture potential investors.
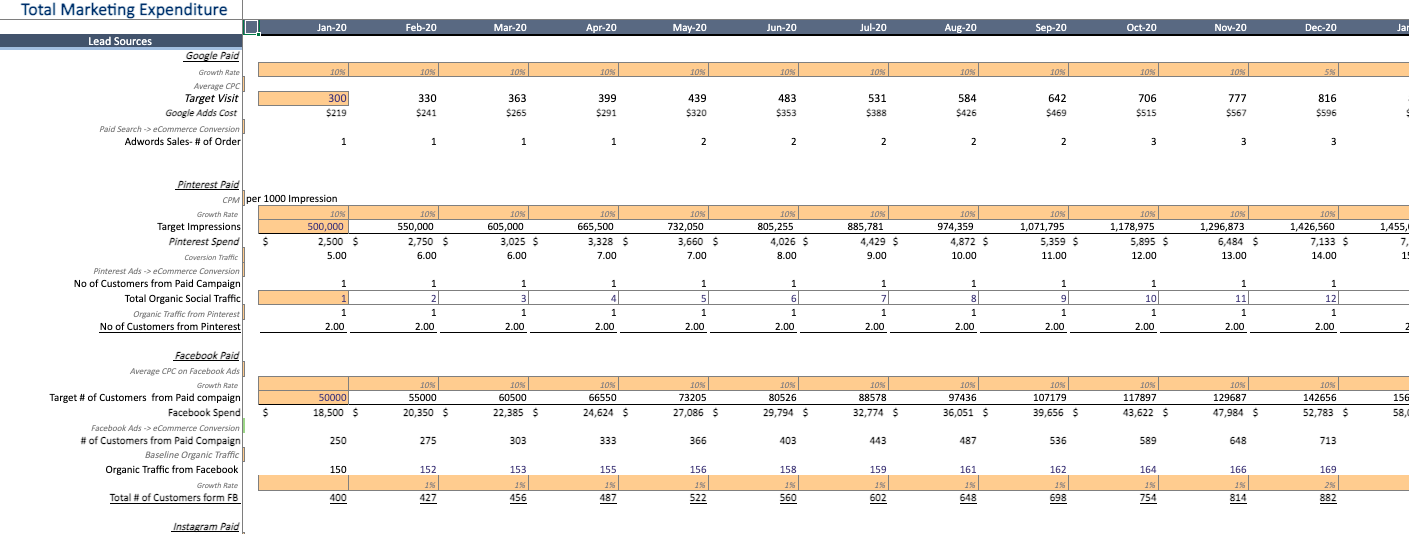
8: Marketing Sheet
There is a marketing sheet with all possible marketing channels. The Sheet tells you how many expected customers you will have with different channels. For example, spending $2000 on Facebook marketing will bring 1,000 active customers. Enter the conversion rates from the internet.
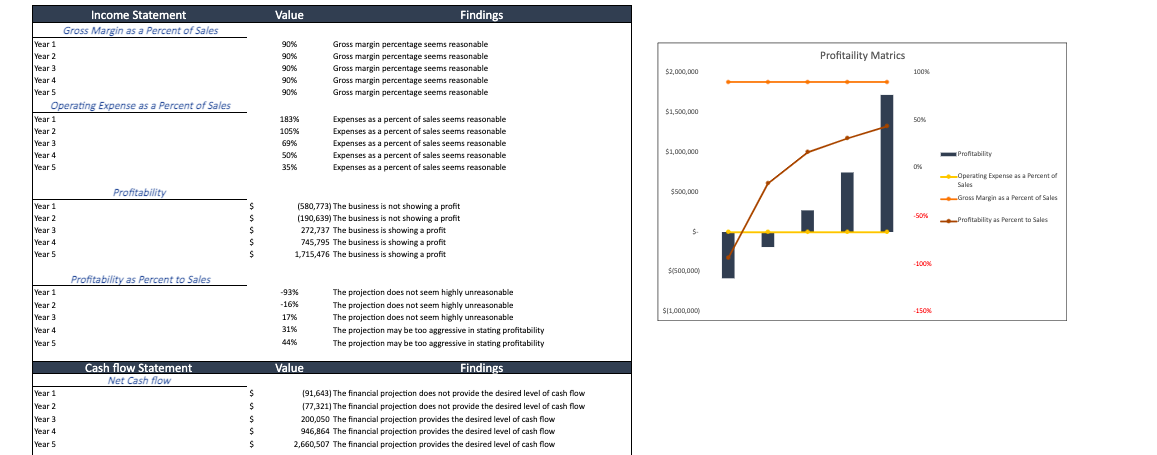
9: Diagnostic Sheet
This Diagnostic sheet is a new inclusion to our financial model. This automatically explains the condition of the business. For example, if your company’s profit is 30% of the total sales the sheet will include favorable comments.
The comments are automatically connected to the numbers of financial data in the income statement, balance sheet, and Cashflow. The Diagnostic Sheet is very helpful to give the company’s insights in just one line.
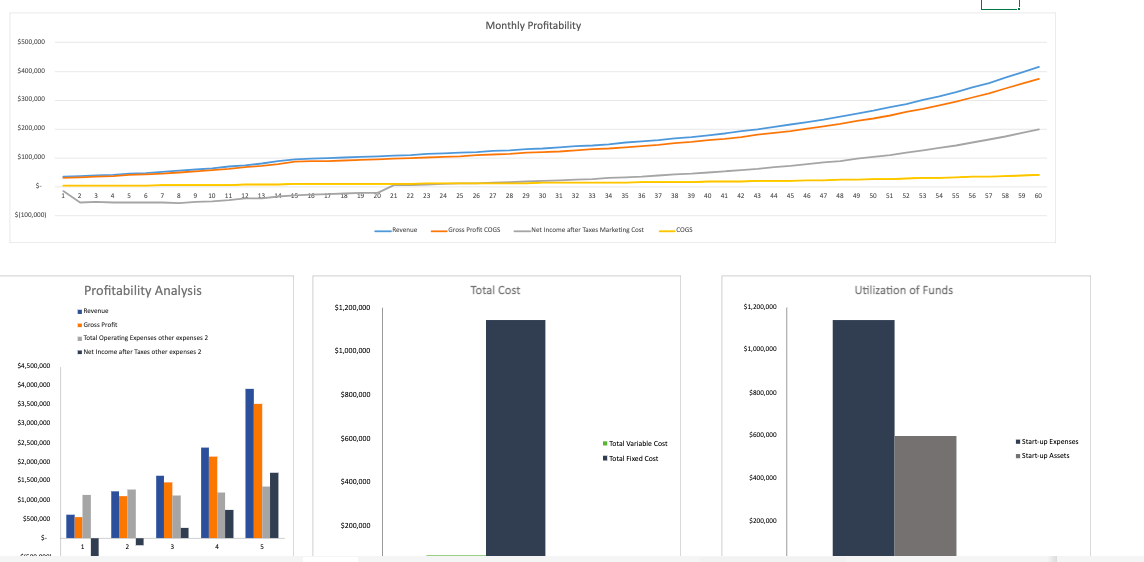
Dashboard
It enables you to track all your relevant financial KPIs, improve cash flow management, and track expenses, sales, and net revenue in detail to meet and outperform the financial objectives of your business.
# The Benefits Of Our Nursery Garden Excel Financial Model Template
1: Save Money & Time.
2: Easy To Use.
3: Understand the Viability of Each Single Item.
4: Graphical Visualization.
How To Use Nursery Garden Excel Financial Model Template
For the purpose of making this model easy to use, Oak Business Consultant has designed this Nursery Garden Excel Financial Model Template with maximum care. Each cell has a color code, and the input areas are all highlighted in peach color.
The User is only required to input data in color cells. All other cells are either helping calculations or results of the model. Therefore there is no need to change any other cell except colored cells.
# More About Financial Modelling:
Contact our expert if you are confused about buying our template. The experts can provide you a 15 min DEMO of the financial model.
# Consultation:
If you are not sure about the numbers, you can hire us as your consultants. We have a pool of Financial Experts who could advise numbers like growth rate, first-year operational expenses, employee headcount, sales capacity, etc.
Nursery Garden Excel Financial Model Template
Everybody would want to live in a lively surrounding especially in the days of Corona. You can easily plant a nursery garden earn money and be profitable in less time. This is because people are becoming more and more aware of health and fitness. If you have this business, you have plenty of options to earn revenue from the membership packages. You can increase your income by having sponsors or advertising and sell your products to other sellers, architects, or raw materials.
The success of this entrepreneur idea depends on the efficiency with which you run the business. The first step you can take is to have a proper Nursery Garden Excel Financial Model template consisting of all relevant financial statements. It will enable the user to make sound decisions by considering all operational and financial risk factors.
The Financial Model is highly adaptable and dynamic for forming a 5 year monthly and yearly 3 statement ( Income Statement, Balance sheet, and Cash Flow Statement) financial projection for a startup or existing agency. This model also consolidates a discounted cash flow valuation calculation by using the projected Free Cash Flows.
The Nursery Garden Financial Model also calculates the main relevant financial performance ratios and KPIs required by banks and investors to estimate business profitability and liquidity.
# Key Inputs of the Nursery Garden Excel Financial Model Template
1: The growth rate Price and Expense.
2: Various Bouqerts with prices and segmentation of revenue.
3: Marketing Budget Sheet (which measures how many customers we get from marketing).
4: Revenue Assumptions.
5: Average Payable and Receivable days your business is following.
6: Cost of Goods.
7: Fixed Asset and Capital Expenditure.
8: Tax Rate
9: Investment table
10: Loan table
# Key Features of Nursery Garden Excel Financial Model Template
1: Input Sheet
This financial model template contains inputs that, when changed, impact the calculations and, therefore, the changes are applied to all relevant sheets. This financial model always has built-in flexibility to display different outcomes or final calculations based on this sheet’s changes.
2: Startup Summary
A start-up summary tab includes the total cost incurred at the start of business and capital expenditure, how much cash injected by the company so far, and the amount of investment required is calculated based on the number of months.
A Startup Summary helps you take a realistic view of your idea and double-check whether the business has enough funds to support operations.
3: Monthly & Yearly Income Statement
The Nursery Garden Excel Financial Model provides the monthly as well as yearly income statement structure. The framework for creating a full corporate forecasting model tailored to your particular business.
An integrated financial model is powerful since it enables the Financial Model user to change any assumption in one part of the statement to see how it impacts all other parts of the statements accurately and consistently.
The monthly Income Statement sheet of the Financial Model is perfect for those who require regular reporting and details. Additionally, Income Statement contains all revenue streamlines with gross earnings, net earnings linked with a revenue analysis sheet to ensure accurate reporting.
Oak Business Consultants understands nursery garden business goals. Therefore, we have developed a mechanism that helps business owners determine whether they are making profits or otherwise.
Furthermore, the Yearly Income Statement gives you complete insights into revenue and general & administrative expenses. The Yearly Income Statement also contains several graphs, assumptions, ratios, net profit, cost of services, and profit after tax.
4: Balance Sheet
This balance sheet enables you to analyze your position of current assets, fixed assets, liabilities, and equity. This also allows you to monitor your accounts receivable, accounts payable, accrued expenses, etc. Therefore this specific, financial model gives you the perfect space to analyze your key financial balance accounts.
5: Cash Flow Statement
The Cash Flow Statement is the vital part of the three statements that report the cash spent and generated during a specific period. The Cash Flow Statements act as a bridge between the income statement and balance sheet by how money has moved in and out of business.
#Three main sections of Cashflow Statement:
1: Operating Activities: We have included all cash in and out related to the operations of the business.
2: Investing Activities: Any cash from the disposal of an asset and investments included in this section and linked to the inputs and fixed asset tab.
3: Financing Activities: We have separately made a loan-related tab where you can enter all loan-related information thee. The tab is linked to Financing Activities of Cashflow Statement.
The Cashflow Statement in our Model contains a dedicated sheet to monitor and analyze your company cash-ins and out. This cash flow statement is based on several key inputs: Payable and Receivable Days, yearly income, working capital, long-term debt, net cash, etc.
This calculation then computes your net cash flow, beginning and end cash balances. This is a perfect template for your company’s cash flow management.
6: Break-Even Analysis
A break-even analysis can help you measure how different scenarios might play out financially. For example, if you increase the marketing budget or add another employee to the payroll, how many extra sales will be needed to recover that additional expense?
As a coup, we have included a Break-even analysis to our Financial Model, which will help the user determine sales. The break-even analysis will help you know at a glance the profits generated at the various sales levels. The Break-Even Analysis refers to the total sales contribution refers to fixed cost at zero profit and loss. This Technique is primarily based on marginal costing, which behaves differently at various levels of output activity.
7: Project Evaluation
Since the table calculates Return on Investment, Investor’s Future Equity Share, and Cash Burn Rate Analysis, analyzing the company’s performance becomes easy to capture potential investors.
8: Marketing Sheet
There is a marketing sheet with all possible marketing channels. The Sheet tells you how many expected customers you will have with different channels. For example, spending $2000 on Facebook marketing will bring 1,000 active customers. Enter the conversion rates from the internet.
9: Diagnostic Sheet
This Diagnostic sheet is a new inclusion to our financial model. This automatically explains the condition of the business. For example, if your company’s profit is 30% of the total sales the sheet will include favorable comments.
The comments are automatically connected to the numbers of financial data in the income statement, balance sheet, and Cashflow. The Diagnostic Sheet is very helpful to give the company’s insights in just one line.
Dashboard
It enables you to track all your relevant financial KPIs, improve cash flow management, and track expenses, sales, and net revenue in detail to meet and outperform the financial objectives of your business.
# The Benefits Of Our Nursery Garden Excel Financial Model Template
1: Save Money & Time.
2: Easy To Use.
3: Understand the Viability of Each Single Item.
4: Graphical Visualization.
How To Use Nursery Garden Excel Financial Model Template
For the purpose of making this model easy to use, Oak Business Consultant has designed this Nursery Garden Excel Financial Model Template with maximum care. Each cell has a color code, and the input areas are all highlighted in peach color.
The User is only required to input data in color cells. All other cells are either helping calculations or results of the model. Therefore there is no need to change any other cell except colored cells.
# More About Financial Modelling:
Contact our expert if you are confused about buying our template. The experts can provide you a 15 min DEMO of the financial model.
# Consultation:
If you are not sure about the numbers, you can hire us as your consultants. We have a pool of Financial Experts who could advise numbers like growth rate, first-year operational expenses, employee headcount, sales capacity, etc.
This Best Practice includes
Excel File
