Dynamic Gantt Chart in Microsoft Excel
Originally published: 12/08/2021 09:09
Publication number: ELQ-69722-1
View all versions & Certificate
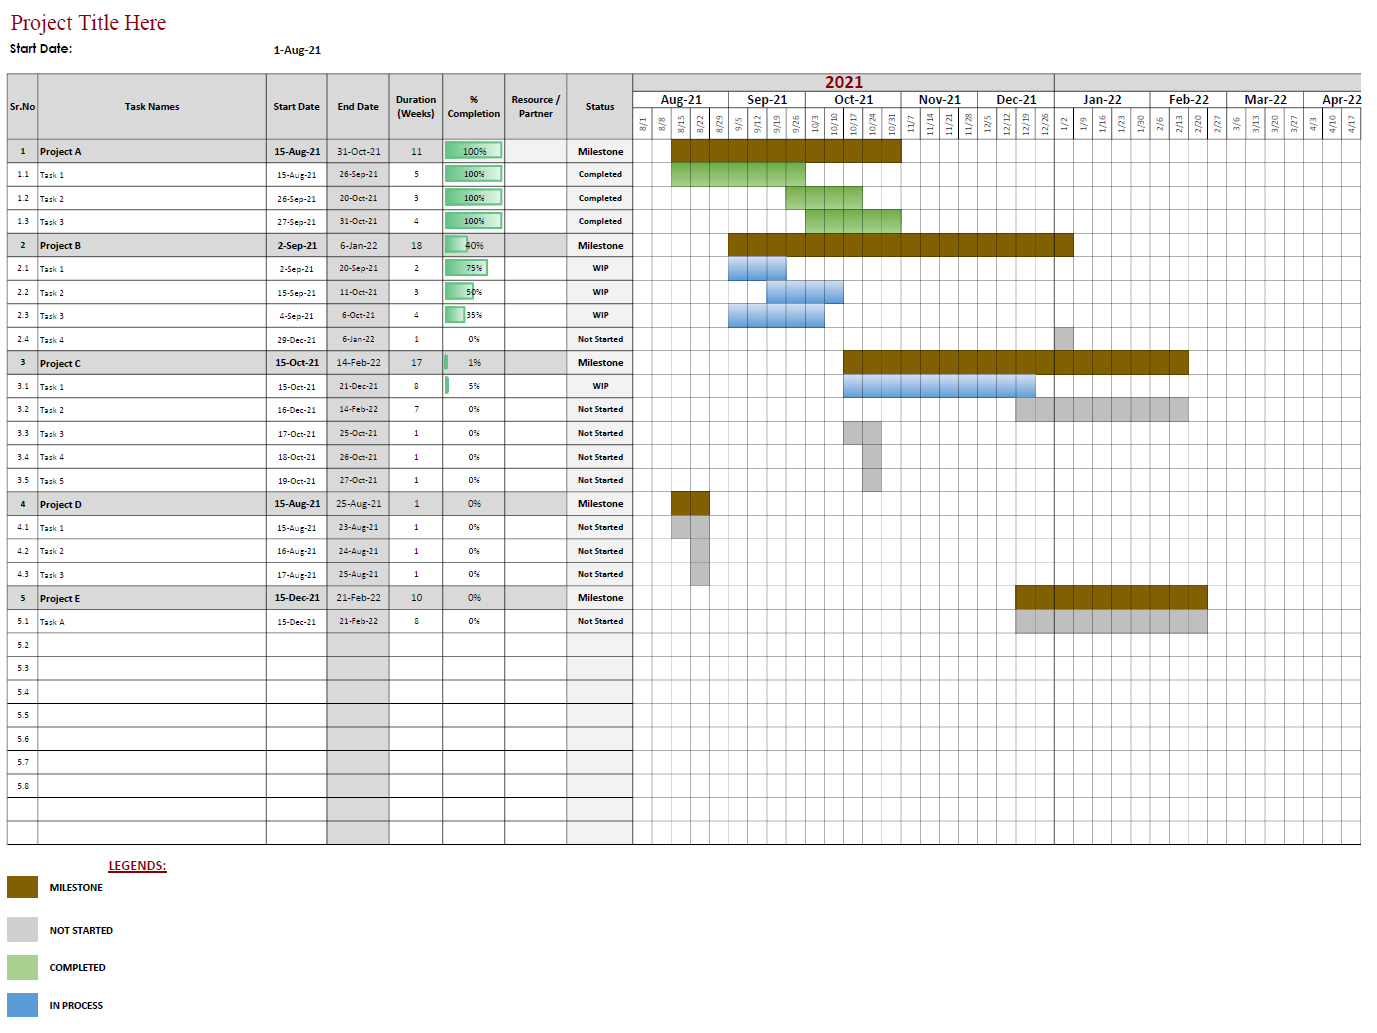
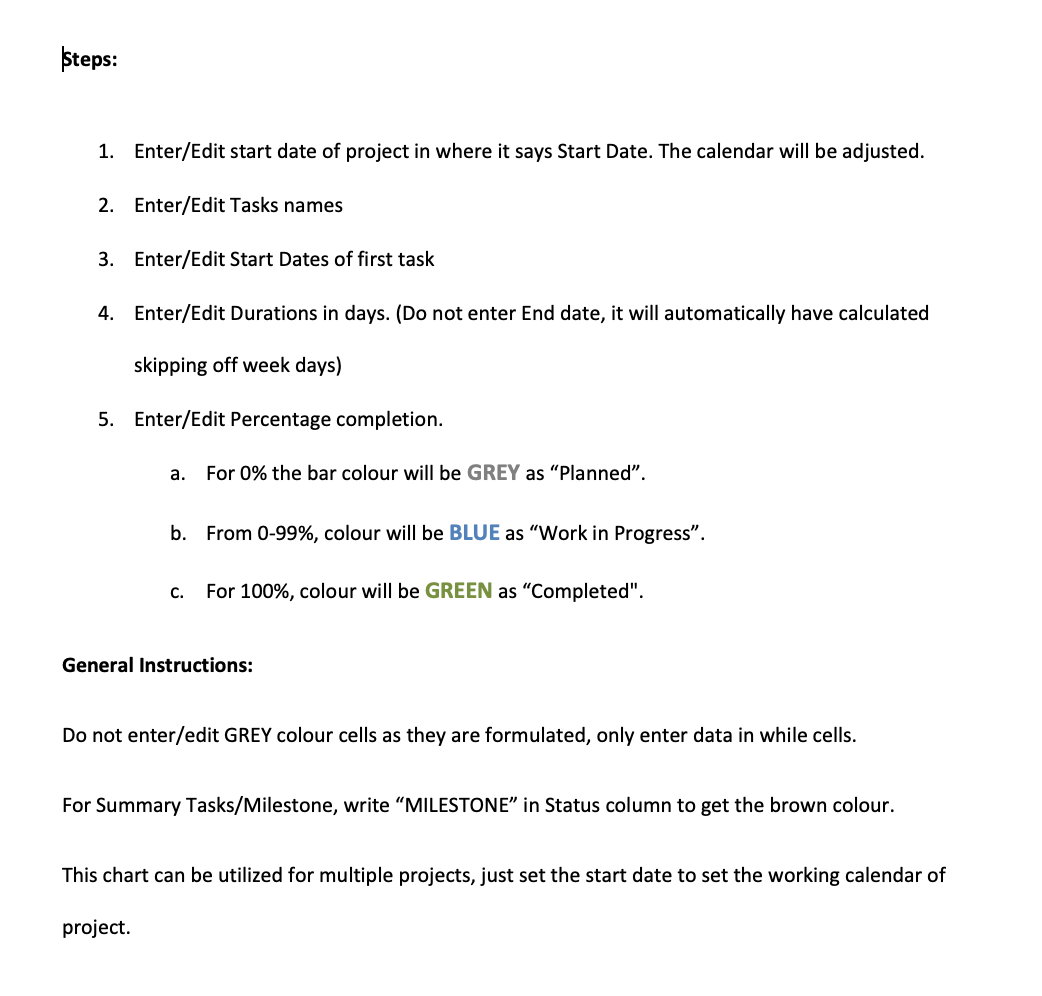
certified

Dynamic Gantt Chart in Microsoft Excel

Dynamic Gantt Chart in Microsoft Excel

Description
By breaking down your project tasks into subtasks and keeping realistic timelines in mind, you can see issues early on before they become major issues. you will be able to track your activities Plan Vs Actual. The BEST PRACTICE in this regard in Project Management is GANTT CHART.

But to save time we wanted that to make a really quick Gantt Chart in Excel that must be Dynamic? That means, we just enter the Project Start Date and Tentative duration against each task in Weeks the Gantt chart will give you graphical representation and completion date! This chart can be utilized for multiple projects individually or can handle multiple projects at the same time.

The Gantt Chart will be started with the Start Date of Your Project.

The Gantt Chart will skip Saturday/Sundays as off days.

Entering % Completion against tasks picks colors for Gantt Bars as default:
a. For 0% the bar color will be GREY as “Planned”.
b. From 0-99%, the color will be BLUE as “Work in Progress”.
c. For 100%, the color will be GREEN as “Completed".

This Excel Dynamic Gantt Chart can be extended to any amount of weeks and can enter any amount of tasks or projects.


Can be extended for multiple tasks and time duration.

This Best Practice includes
1 x Dynamic Gantt Chart , 1 x Documents with instructions

Acquire business license for $10.00

Add to cart

Add to bookmarks

Discuss

Further information

To provide simple and fast project scheduling ability without multiple calculations in the head. Getting beautiful representation of project works.


4.5 / 5 (2 votes)

please wait...