Publication number: ELQ-53324-1
View all versions & Certificate

Project Dashboard V3.0
Comprehensive dashboard tracking project status, timelines, tasks, and KPIs.

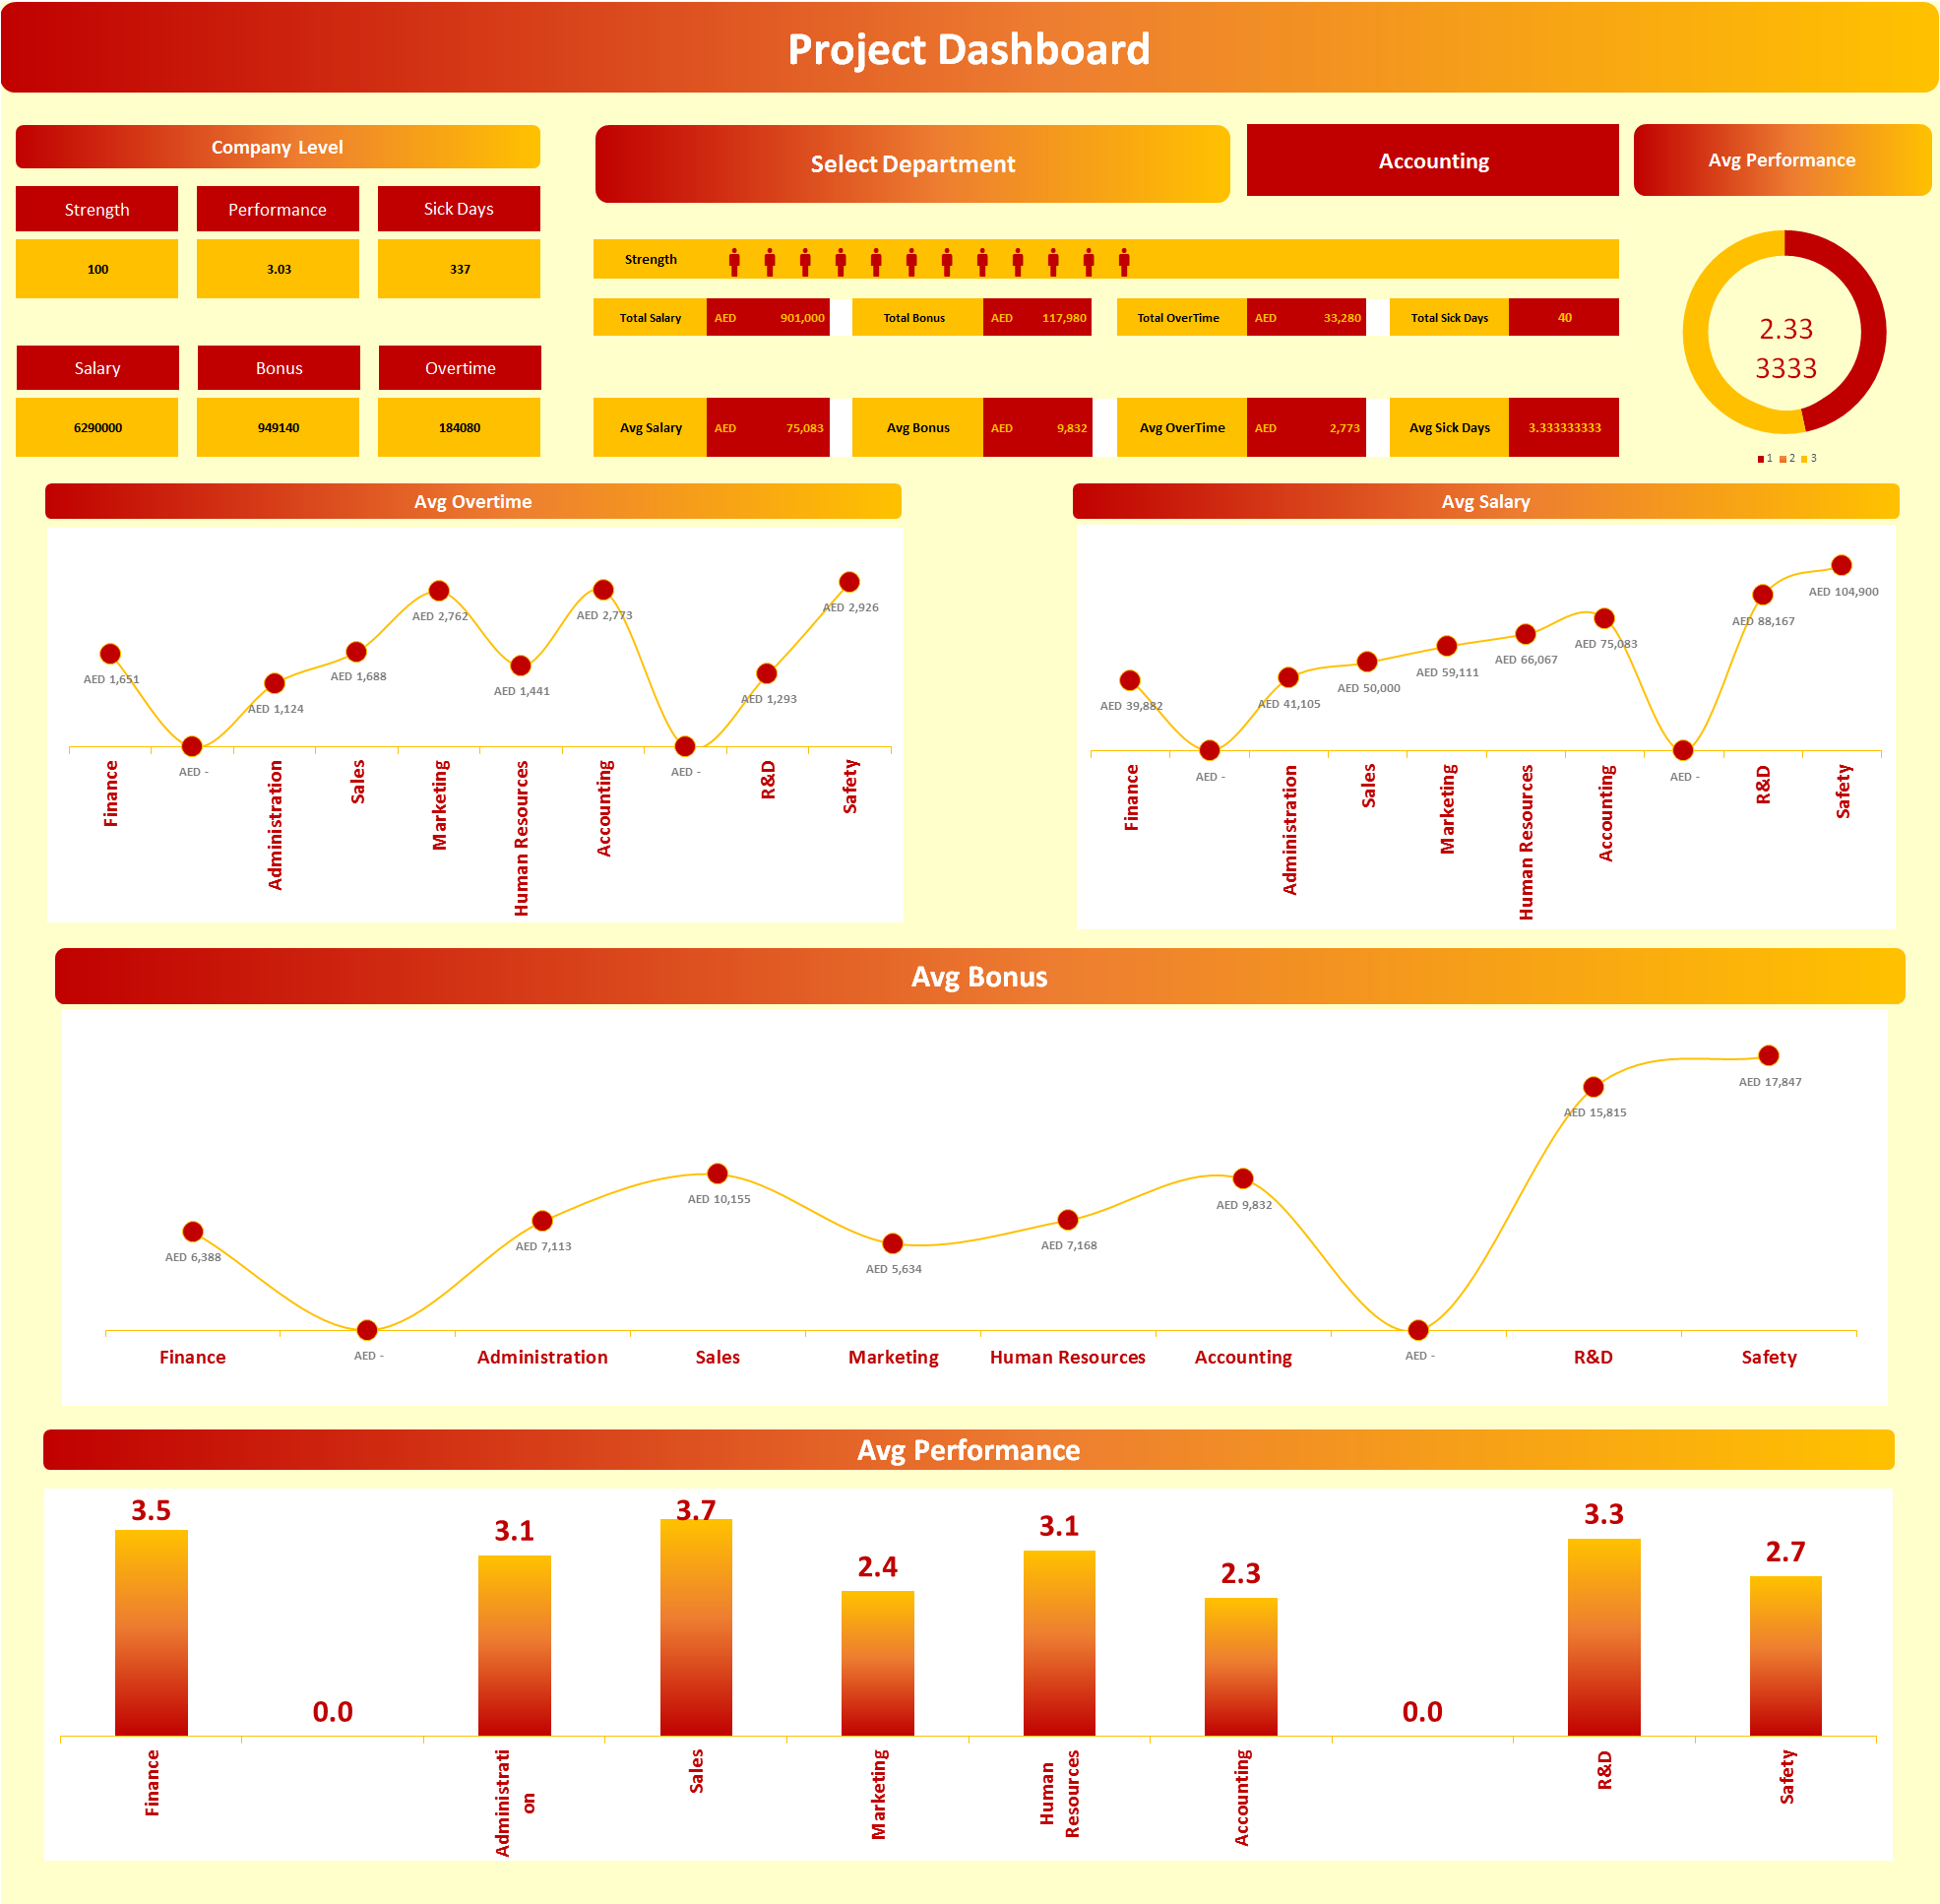
The Project Dashboard V3.0 is a comprehensive, Excel-based project management tool specifically designed to help teams efficiently manage, monitor, and track multiple aspects of project execution in a structured and visually intuitive manner. This advanced dashboard offers a centralized platform that consolidates critical project performance indicators (KPIs), including task progress, upcoming deadlines, resource utilization, milestone achievement, and overall project health.
With its clear visualizations — such as interactive charts, dynamic progress bars, and color-coded status indicators — the dashboard empowers stakeholders at all levels to assess the real-time status of various project activities at a glance. This visibility ensures prompt identification of potential delays, resource constraints, and project risks, enabling more effective and proactive decision-making.
Typically organized into multiple interconnected sheets, the Project Dashboard V3.0 includes a dedicated Task Tracker, where users can input essential details like task names, responsible owners, start and end dates, priorities, and current status. Additionally, a Timeline View or Gantt Chart offers a graphical representation of project phases, dependencies, and delivery schedules, aiding in clear planning and communication.
Complementary sections, such as Risk Logs, Issue Tracking, and Resource Management, enable early detection of bottlenecks, efficient capacity planning, and improved accountability. Enhanced navigation, streamlined formulas, and automated data visualization make Version 3.0 a powerful tool for improving collaboration, maintaining control over project lifecycles
This Best Practice includes
1 Excel template
