Beverage (Drinks) Manufacturer Financial Model
Originally published: 06/02/2025 07:57
Publication number: ELQ-24424-1
View all versions & Certificate
certified

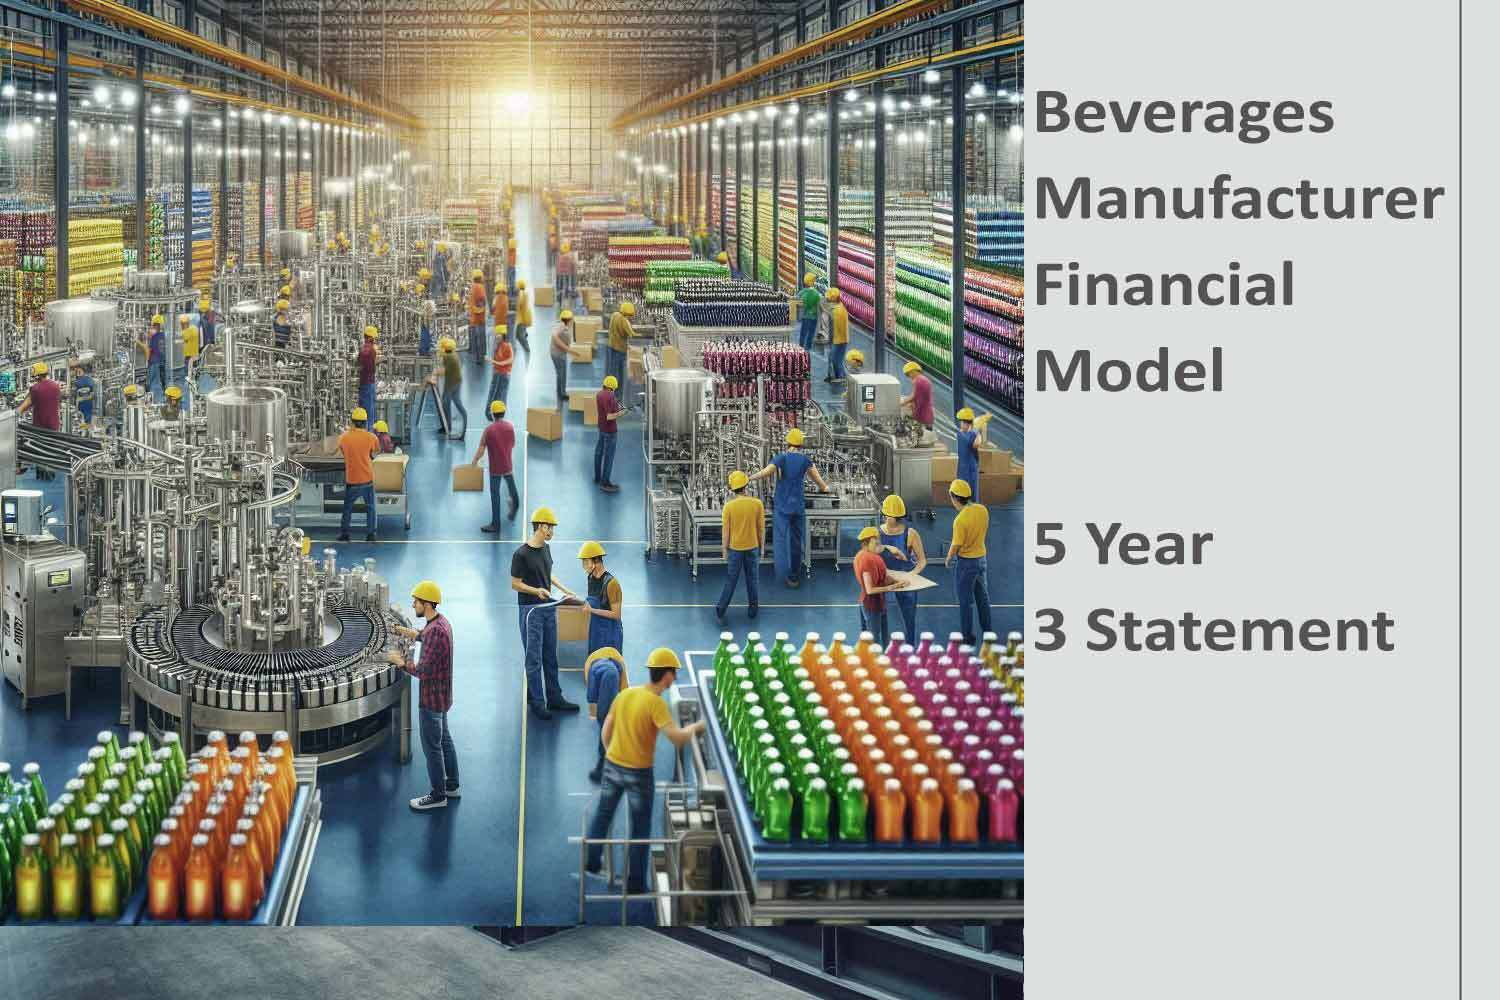
Beverage (Drinks) Manufacturer Financial Model

A comprehensive editable 5-year 3-statement, MS Excel spreadsheet for tracking beverages manufacturing finances.

Description
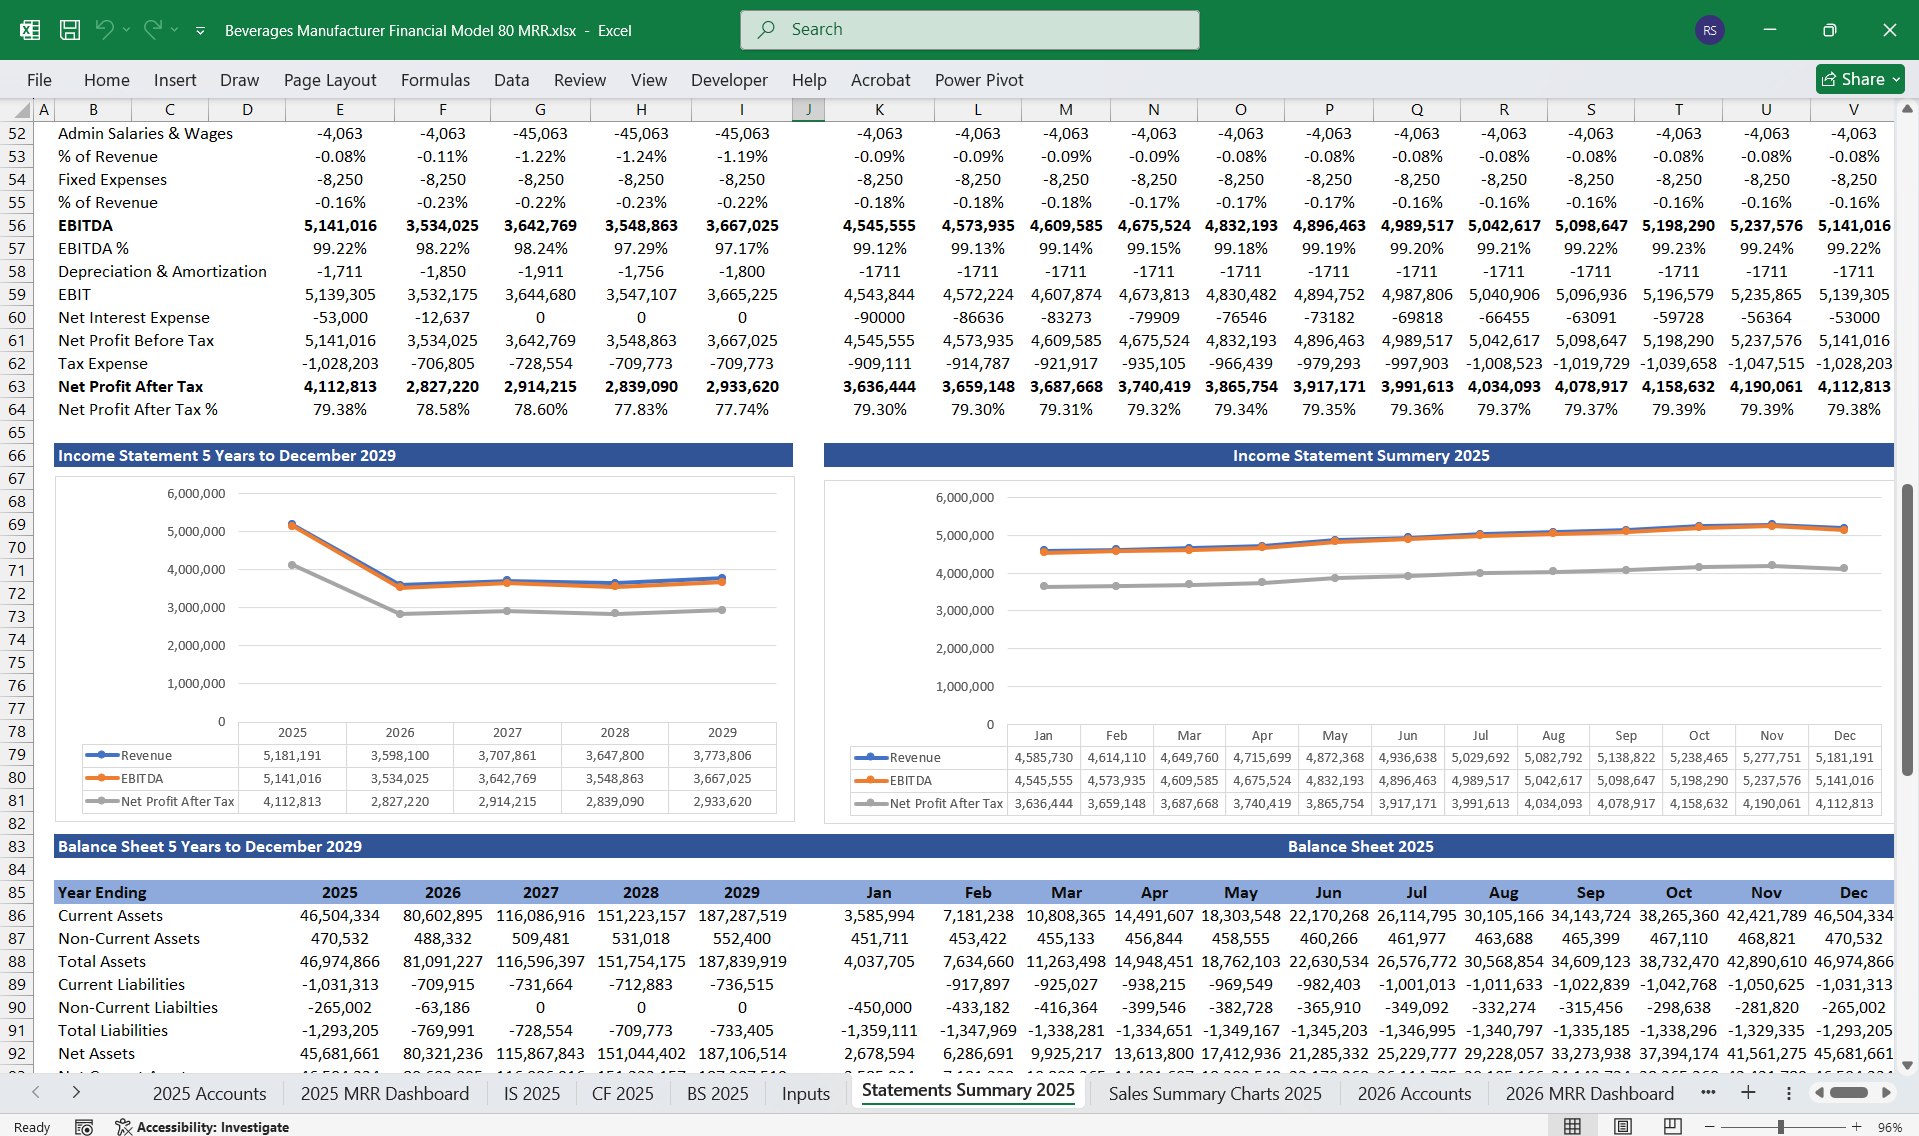
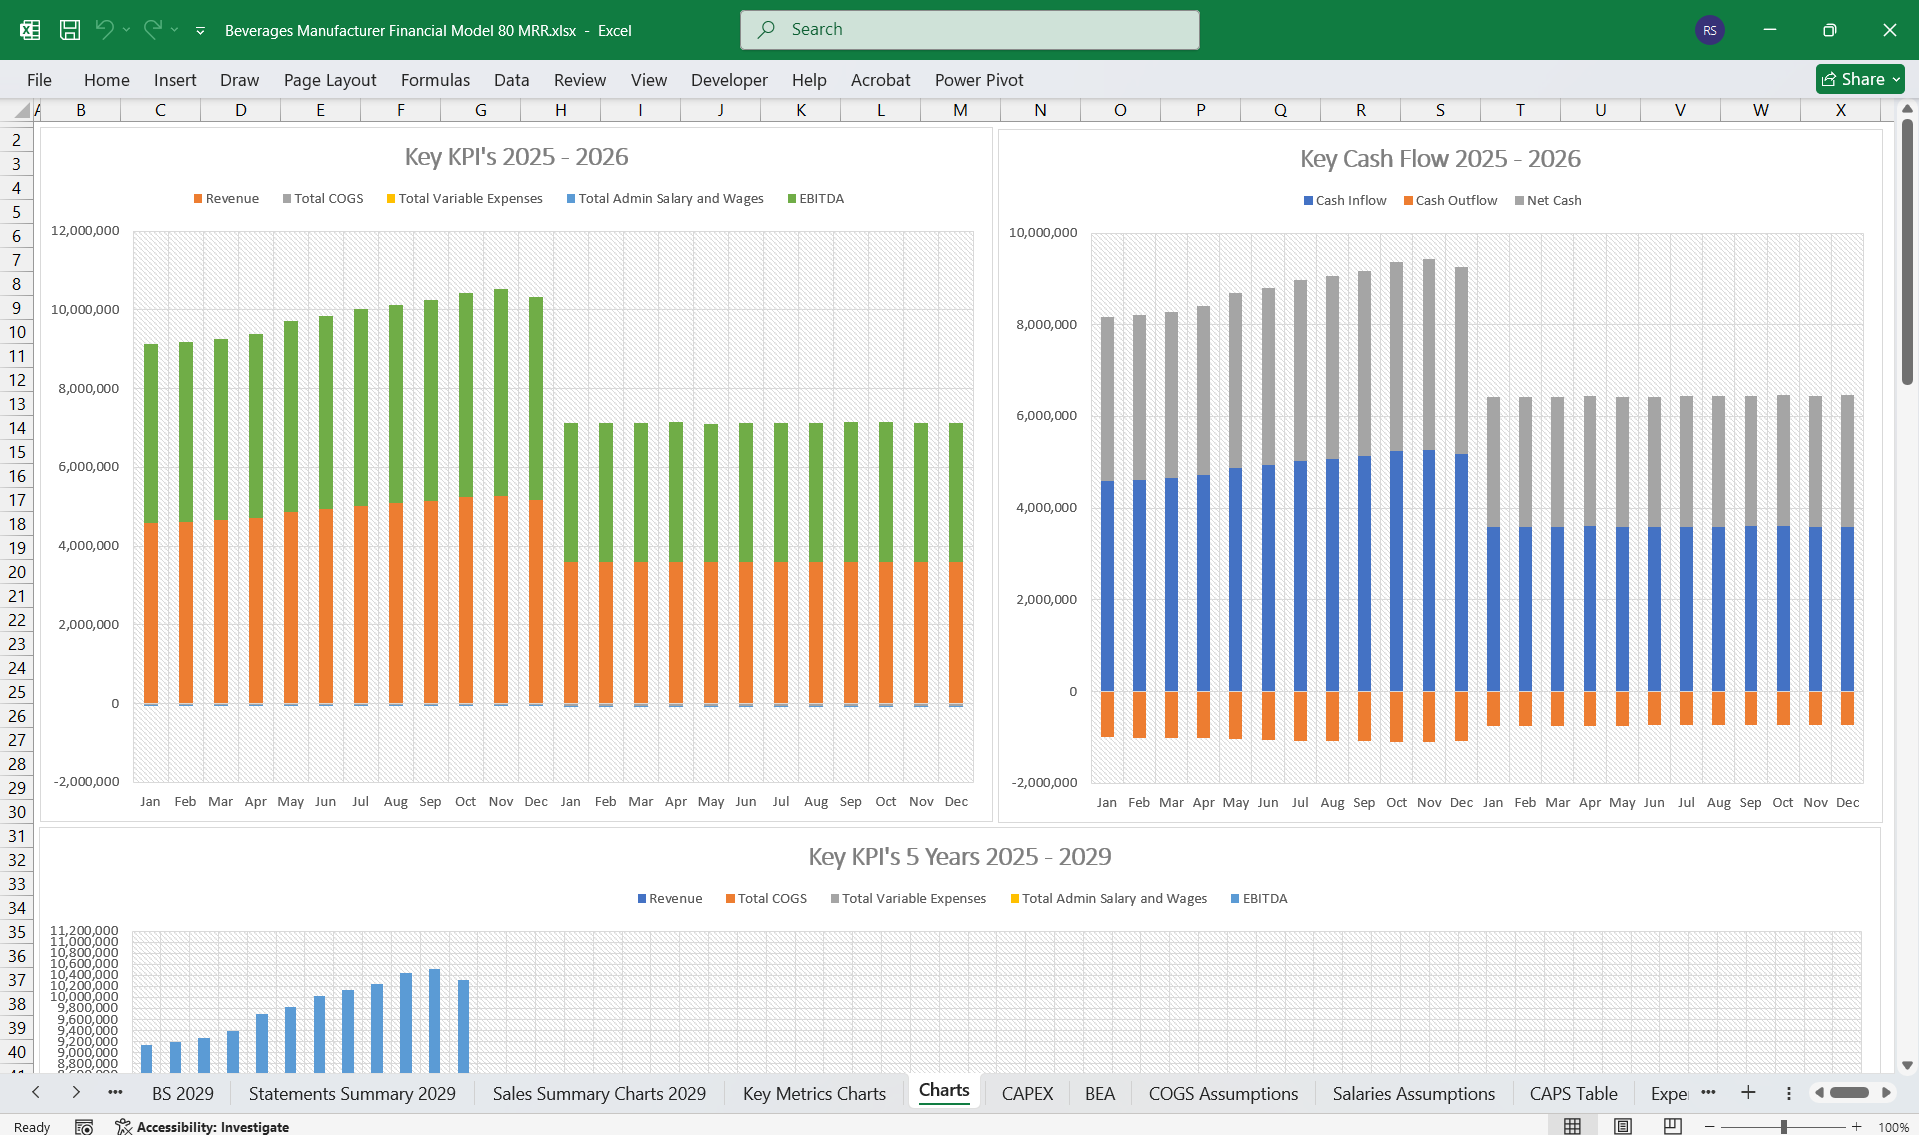
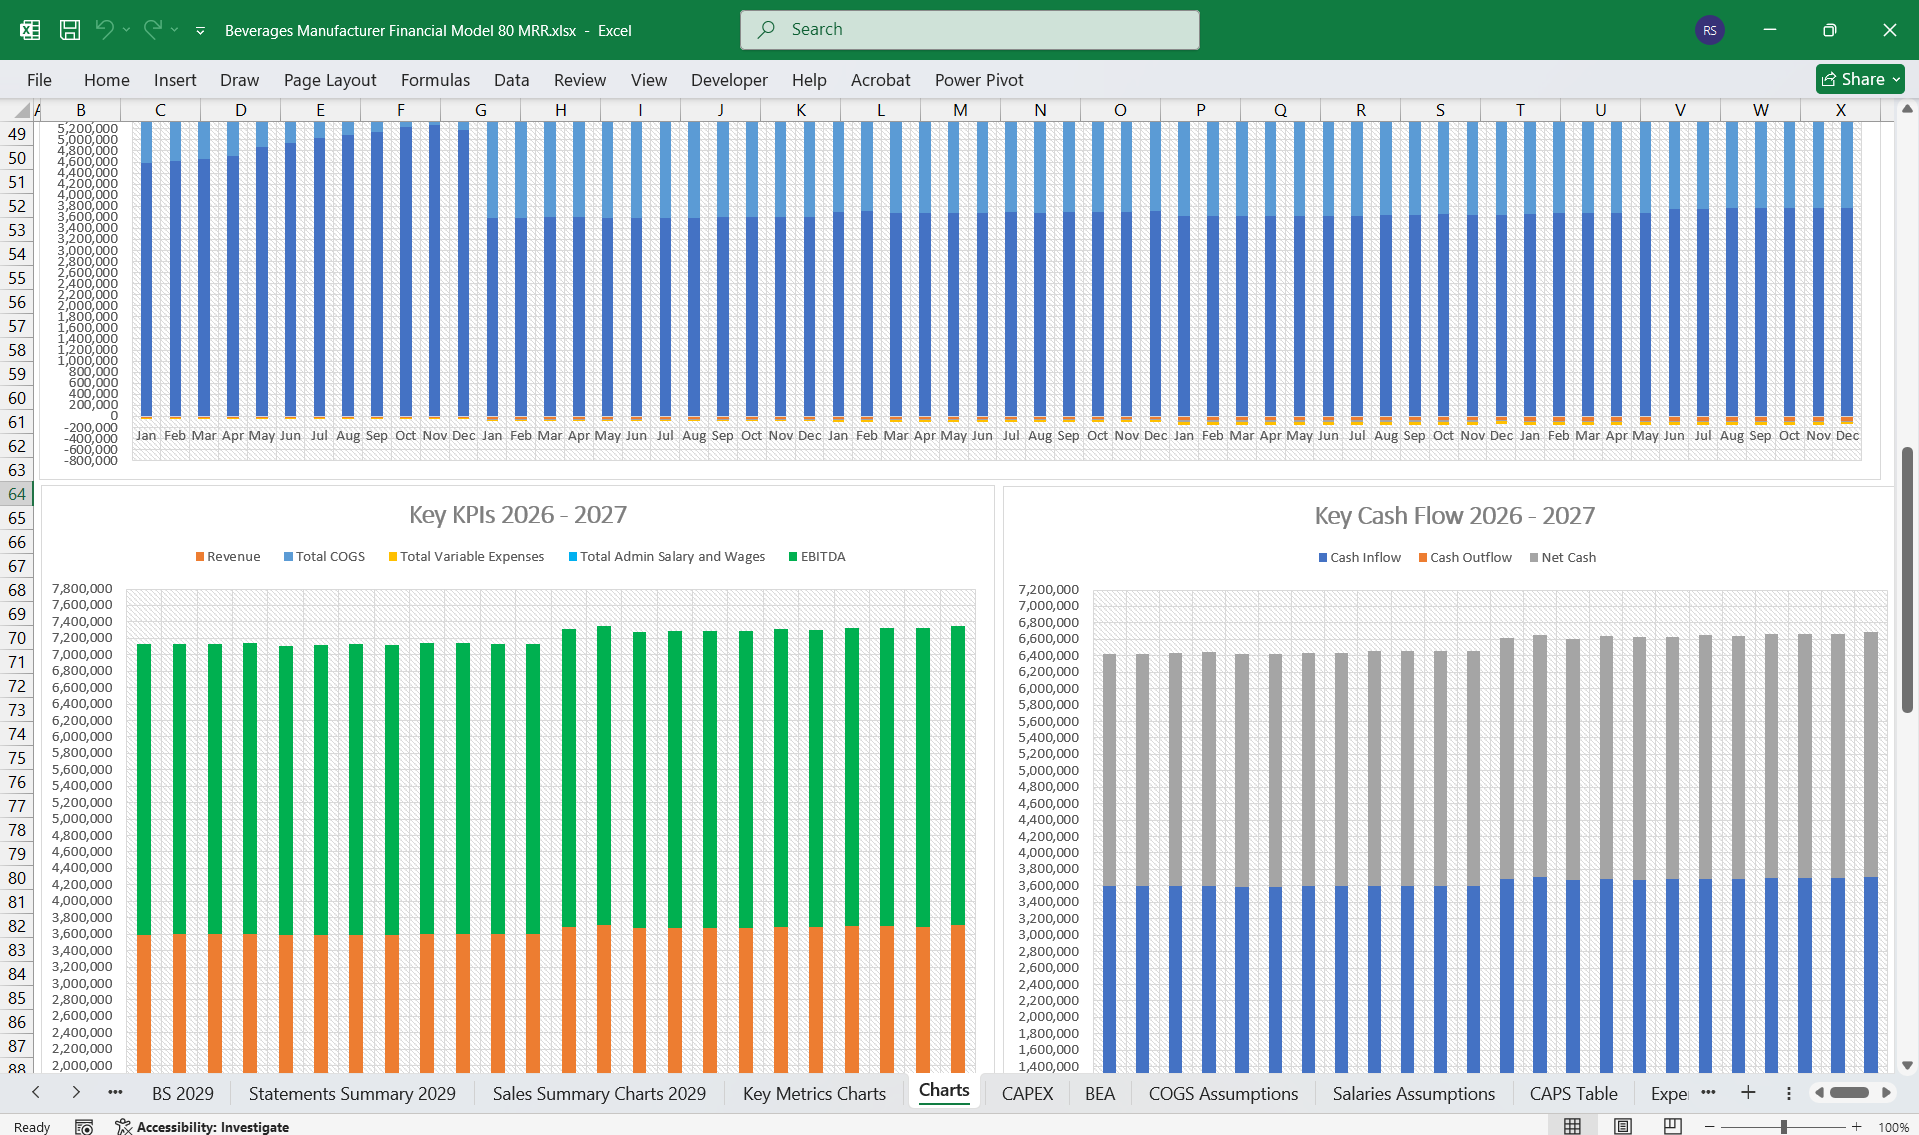
This 3-Statement Financial Model includes an Income Statement, Balance Sheet, and Cash Flow Statement, interconnected to reflect the company’s financial health. 
The models account for various revenue streams, cost structures, inventory, and capital investments.
This model also includes:
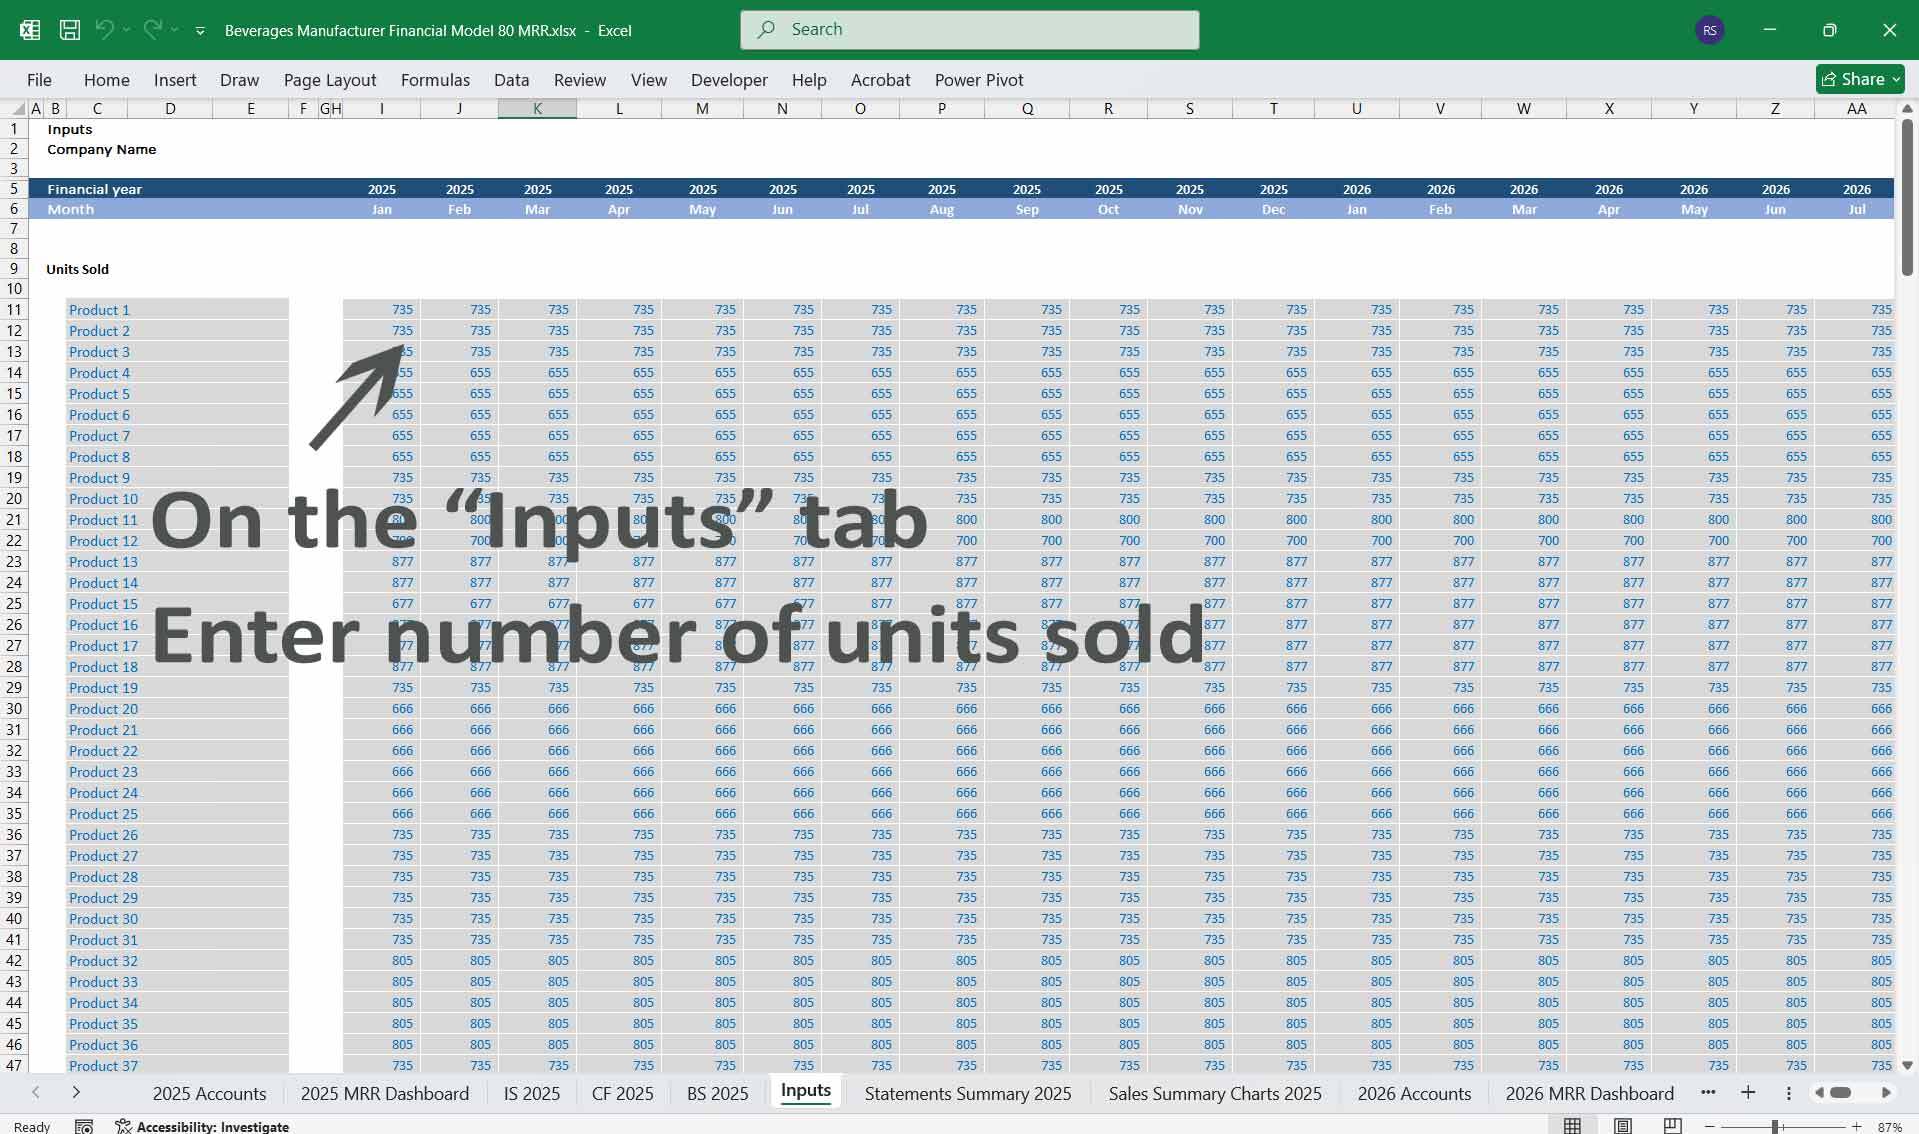
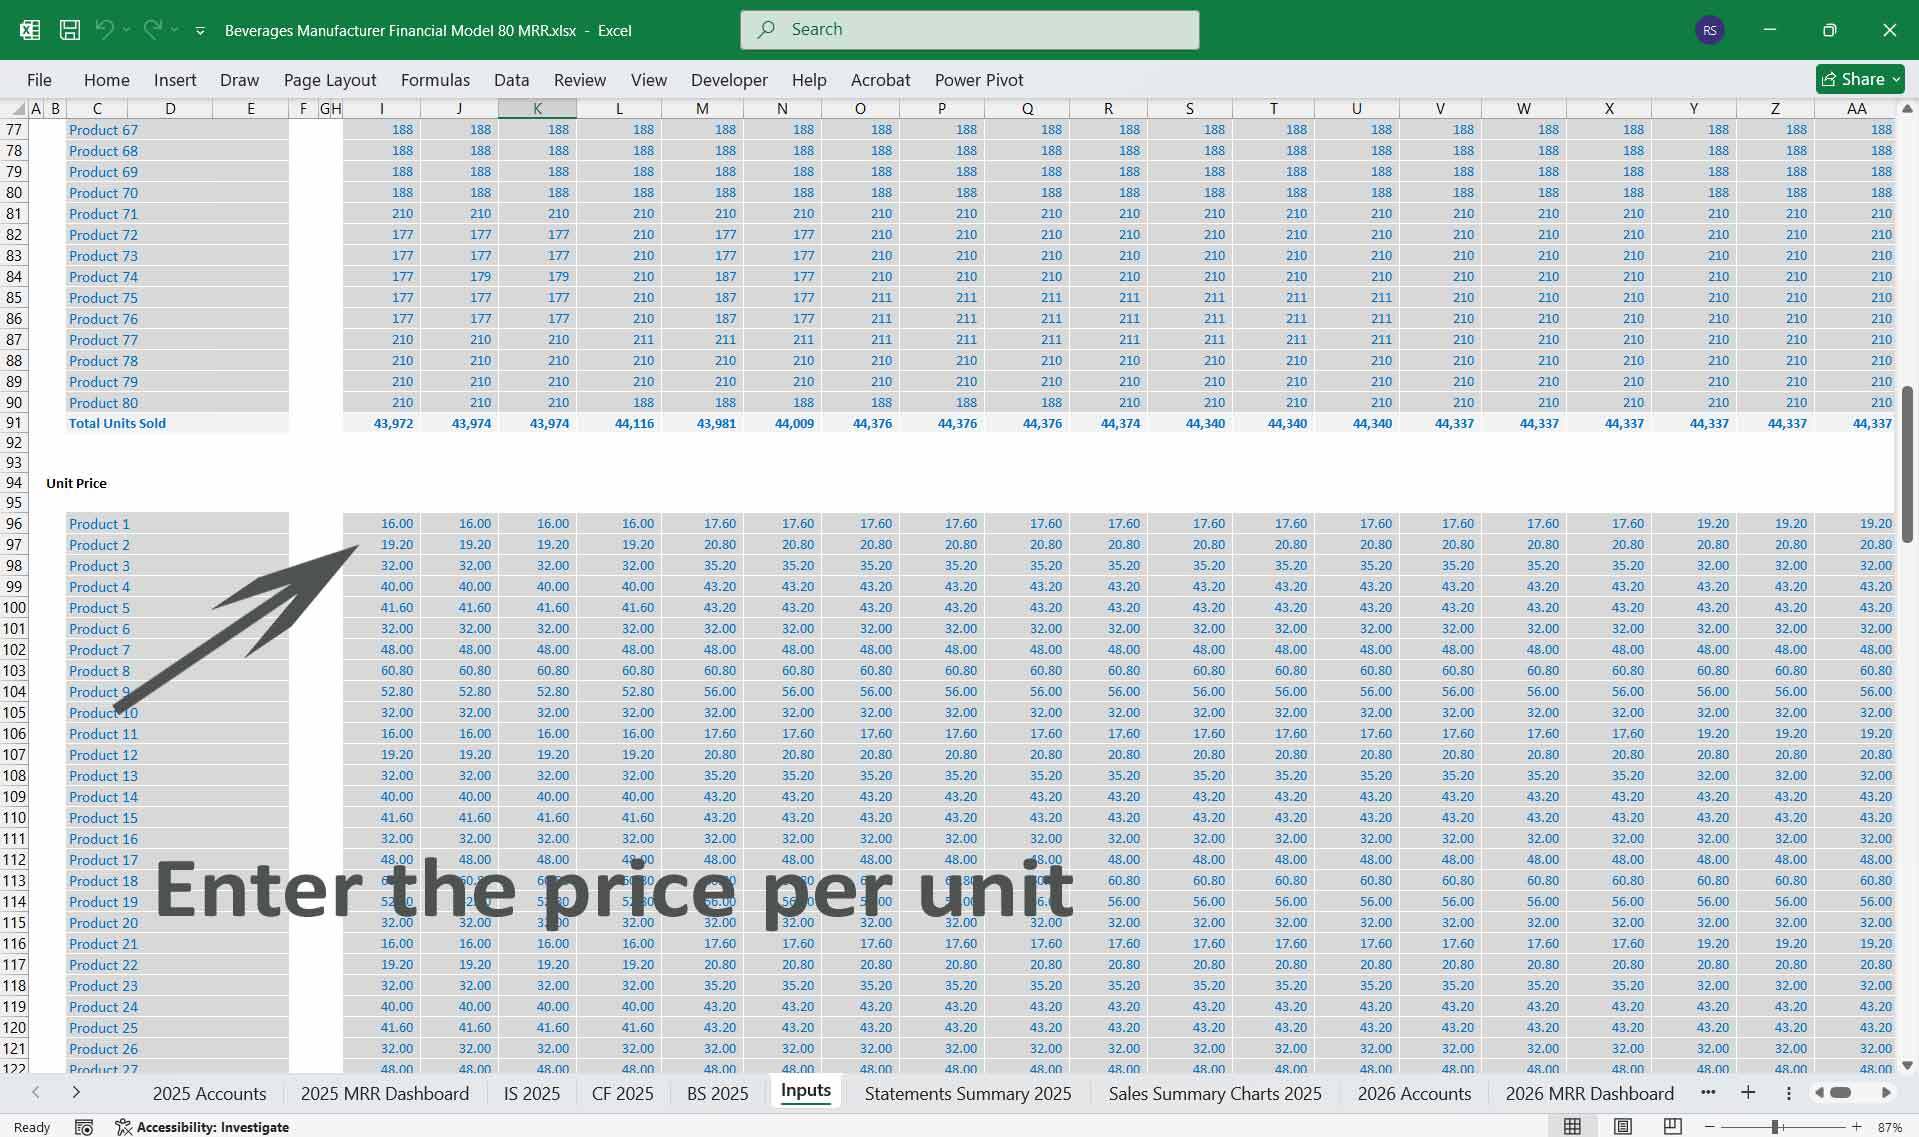
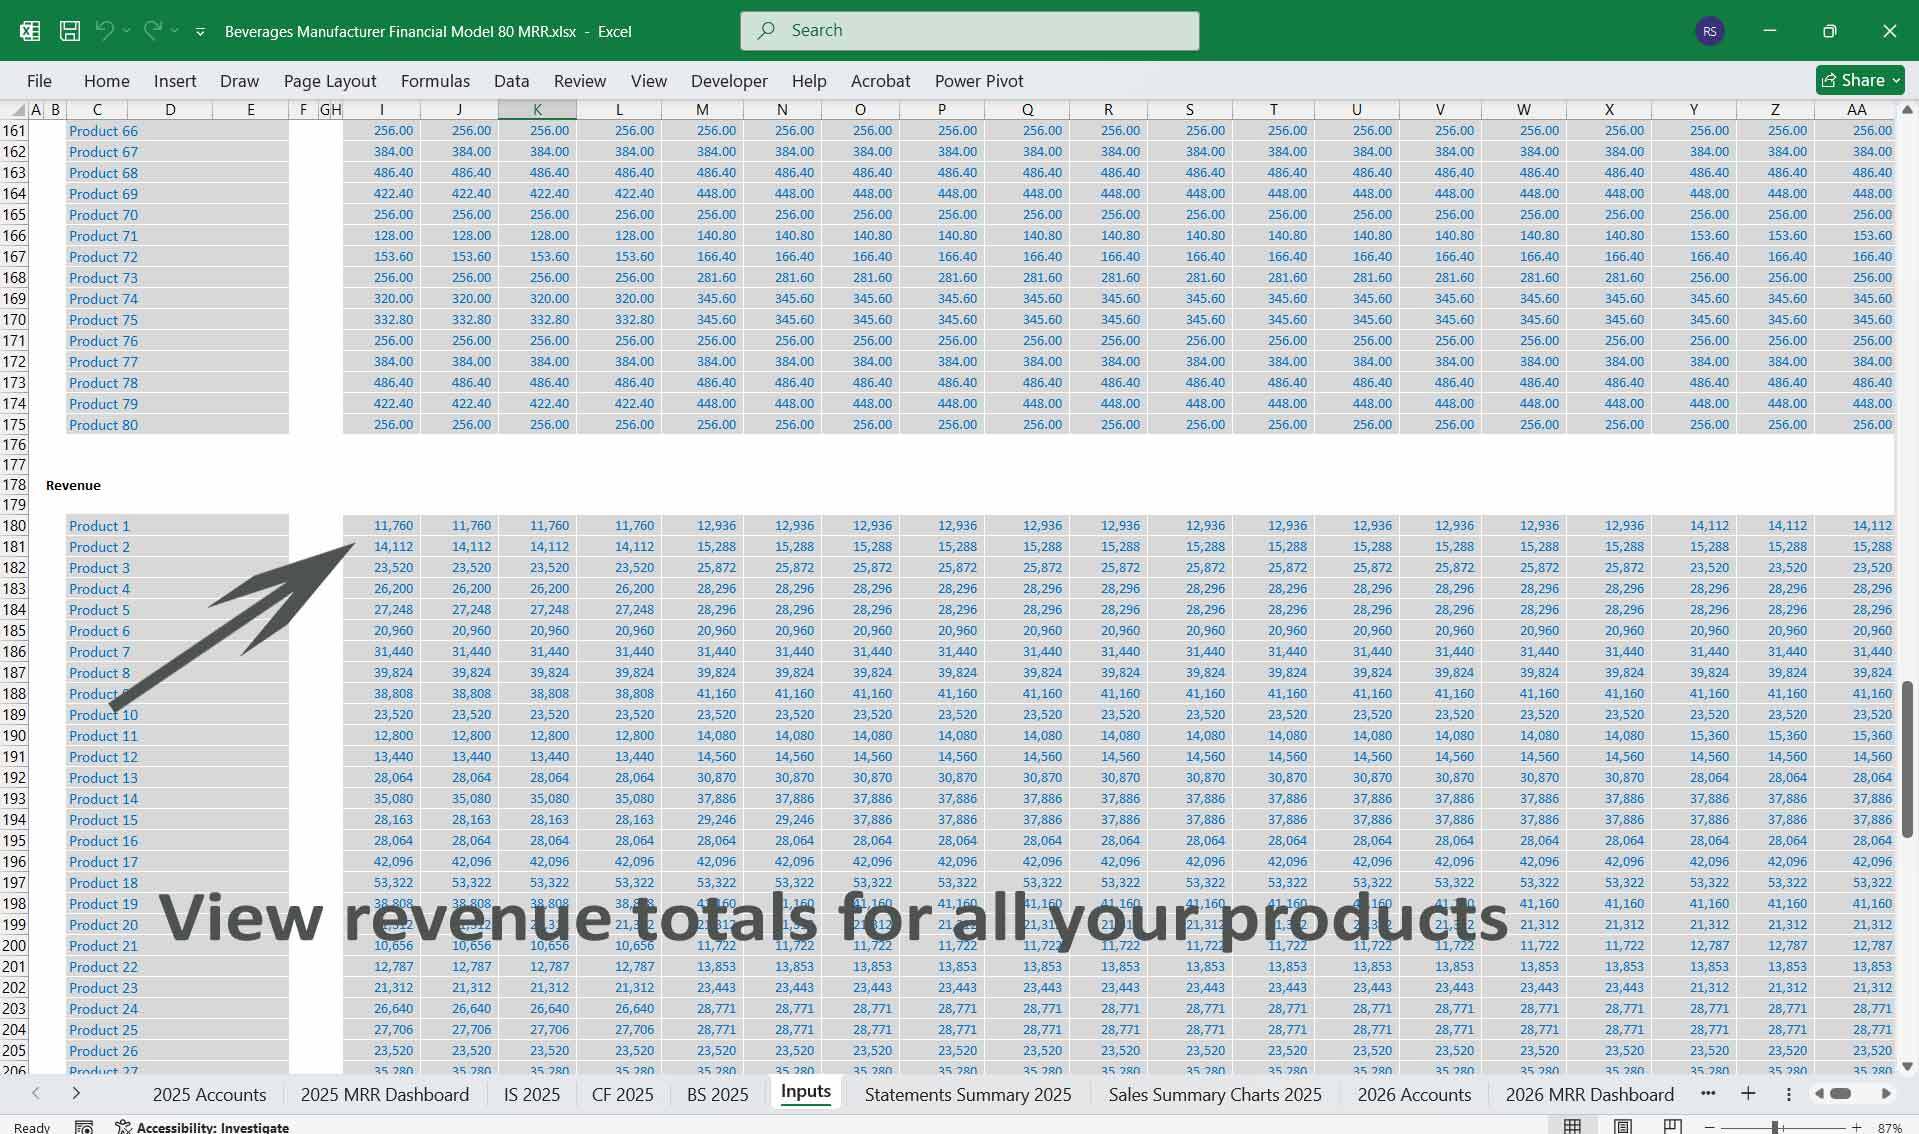
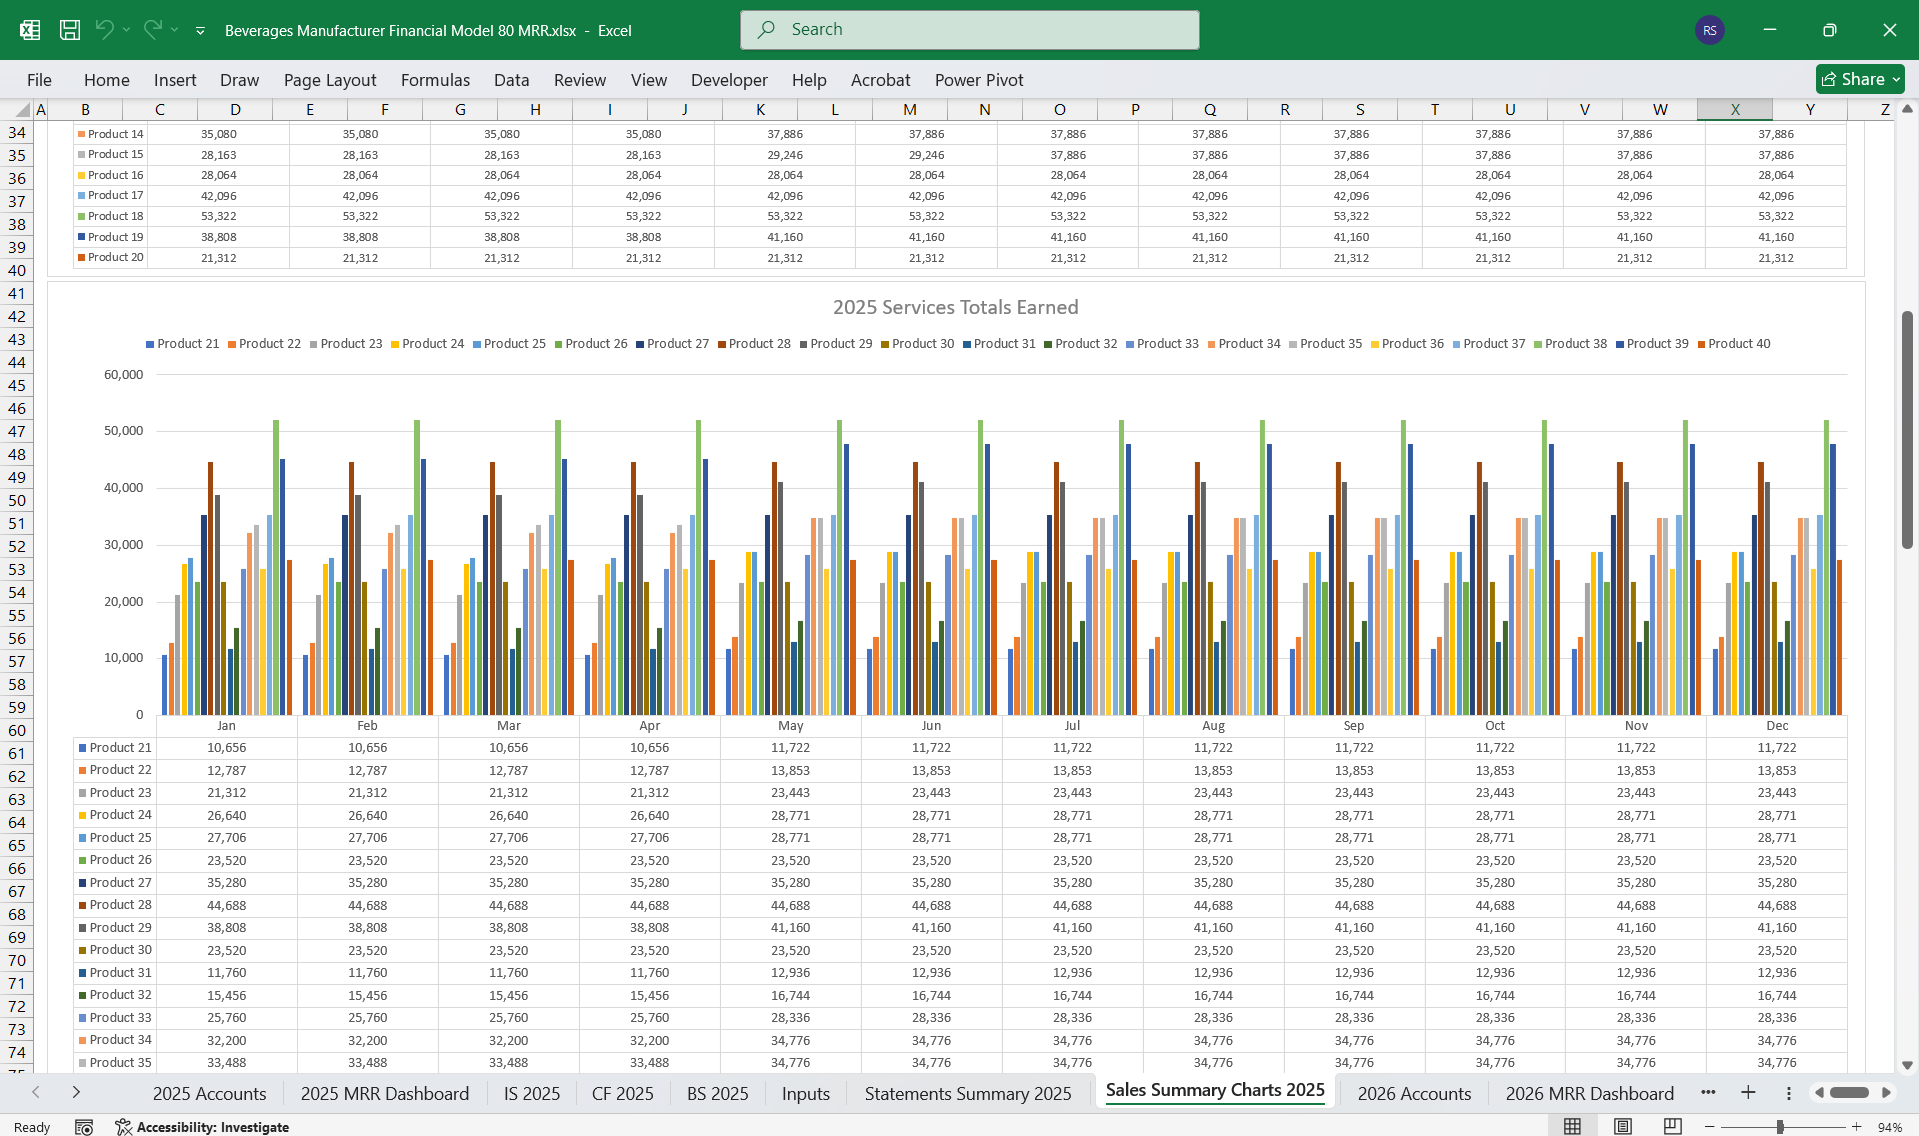
  1. 80 Product Variants – Different SKU-based revenue, cost allocation, and inventory management.
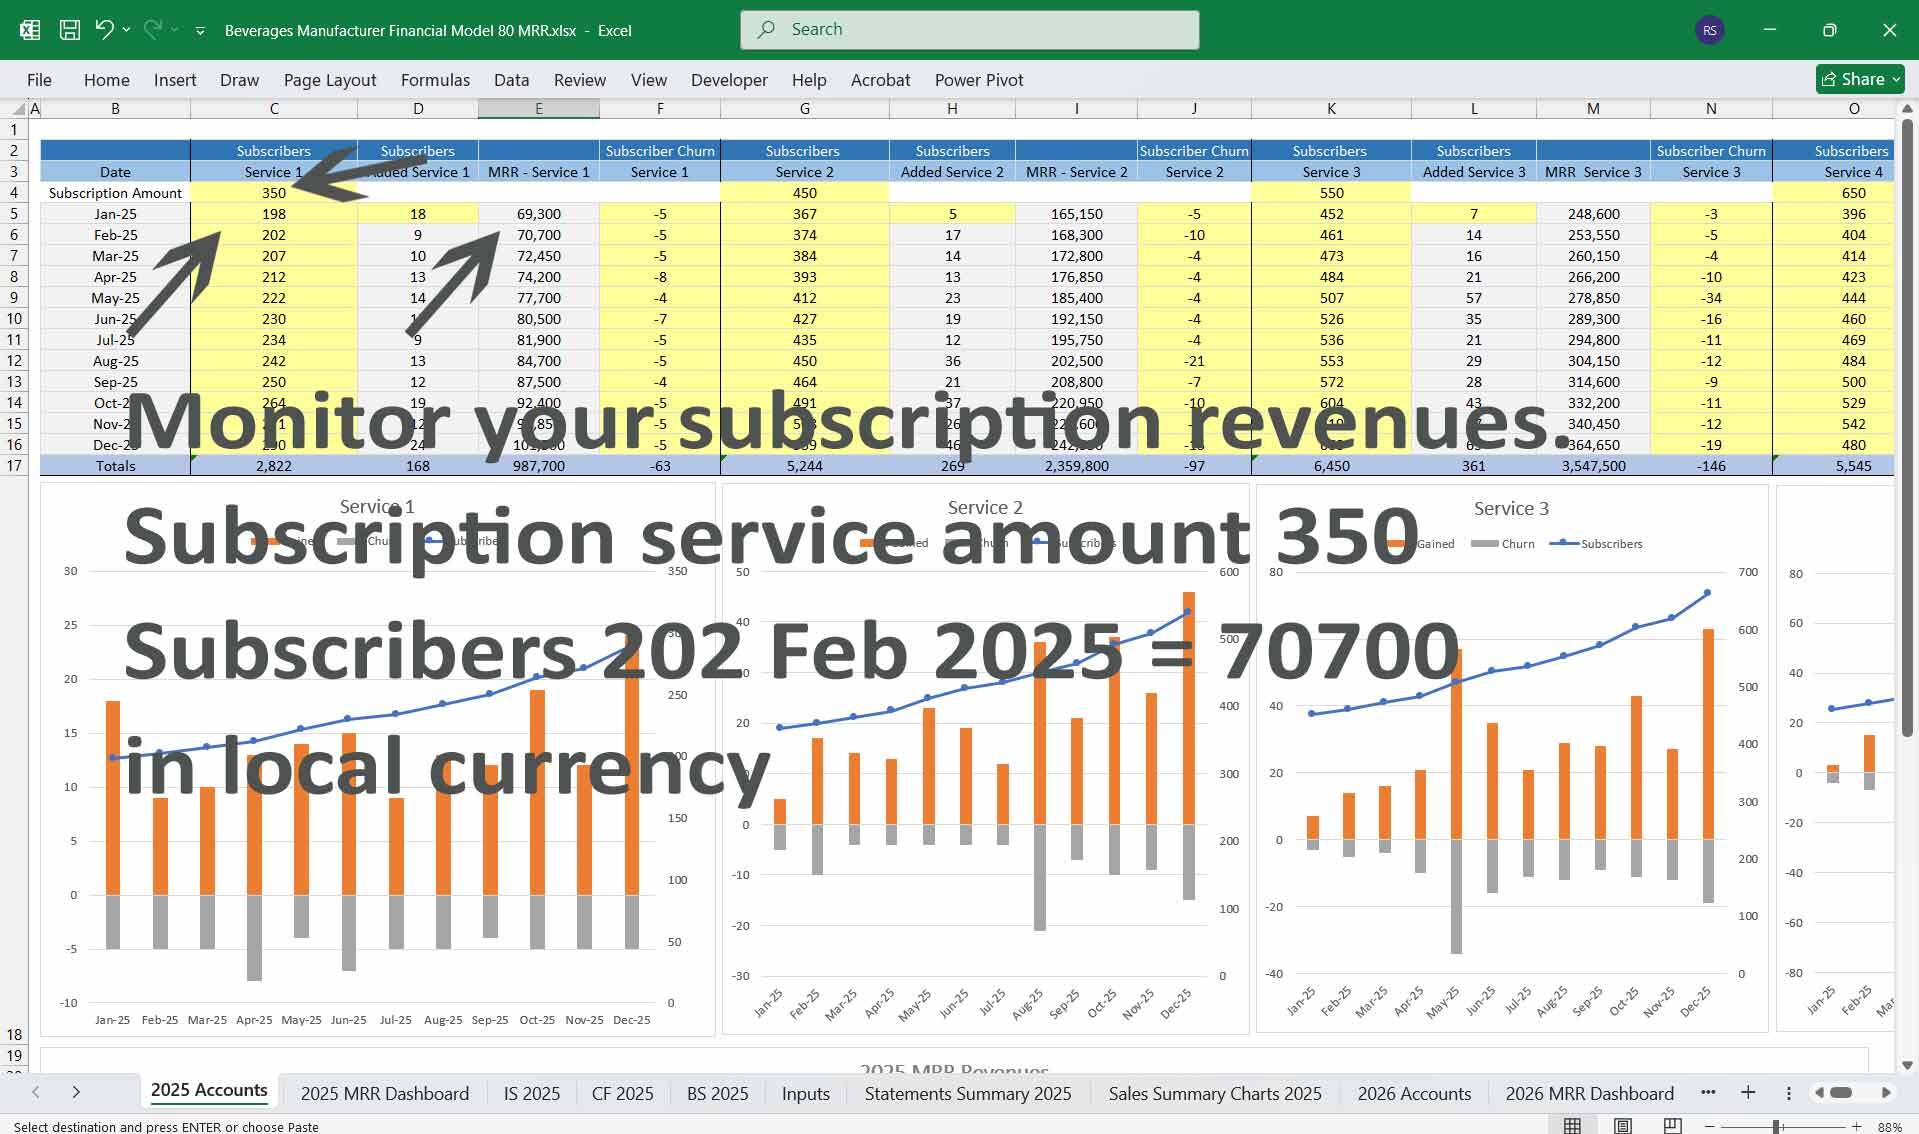
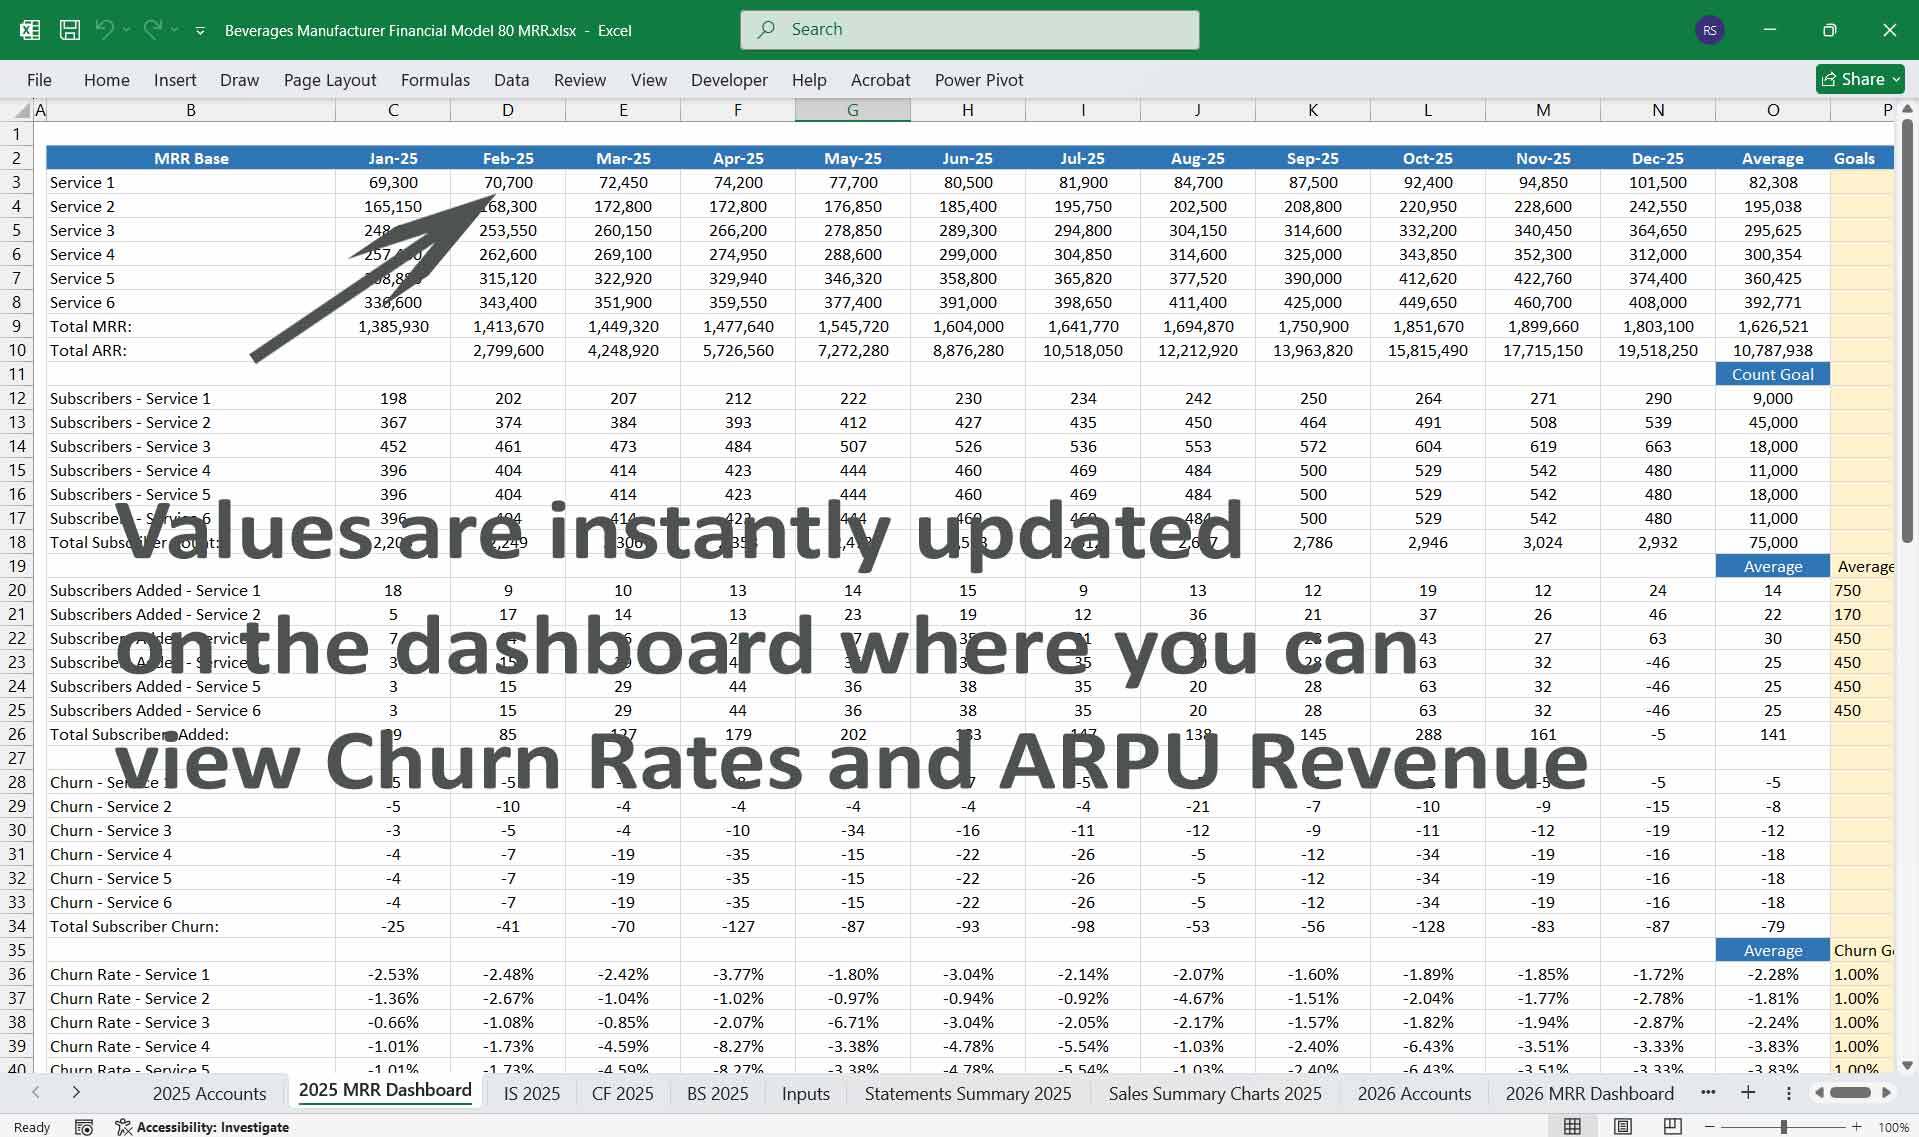
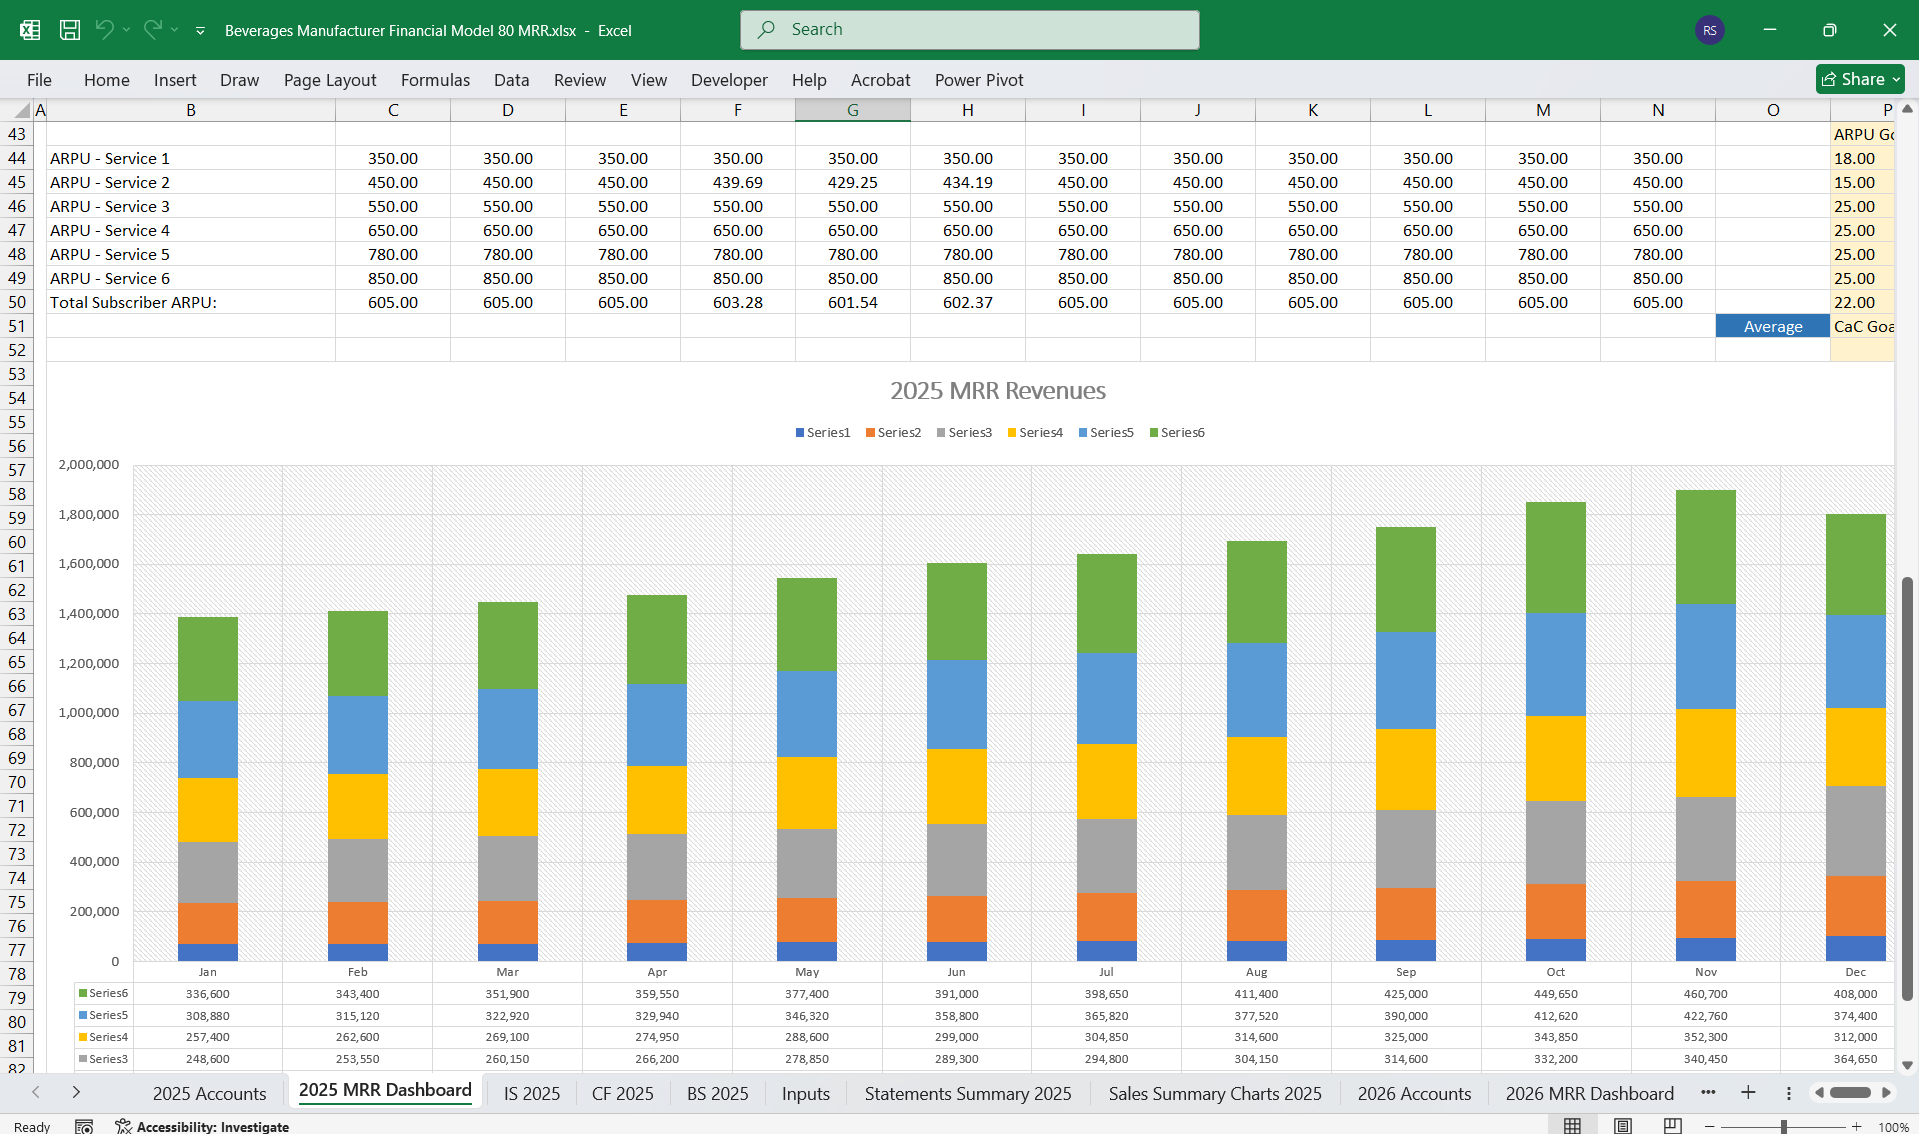
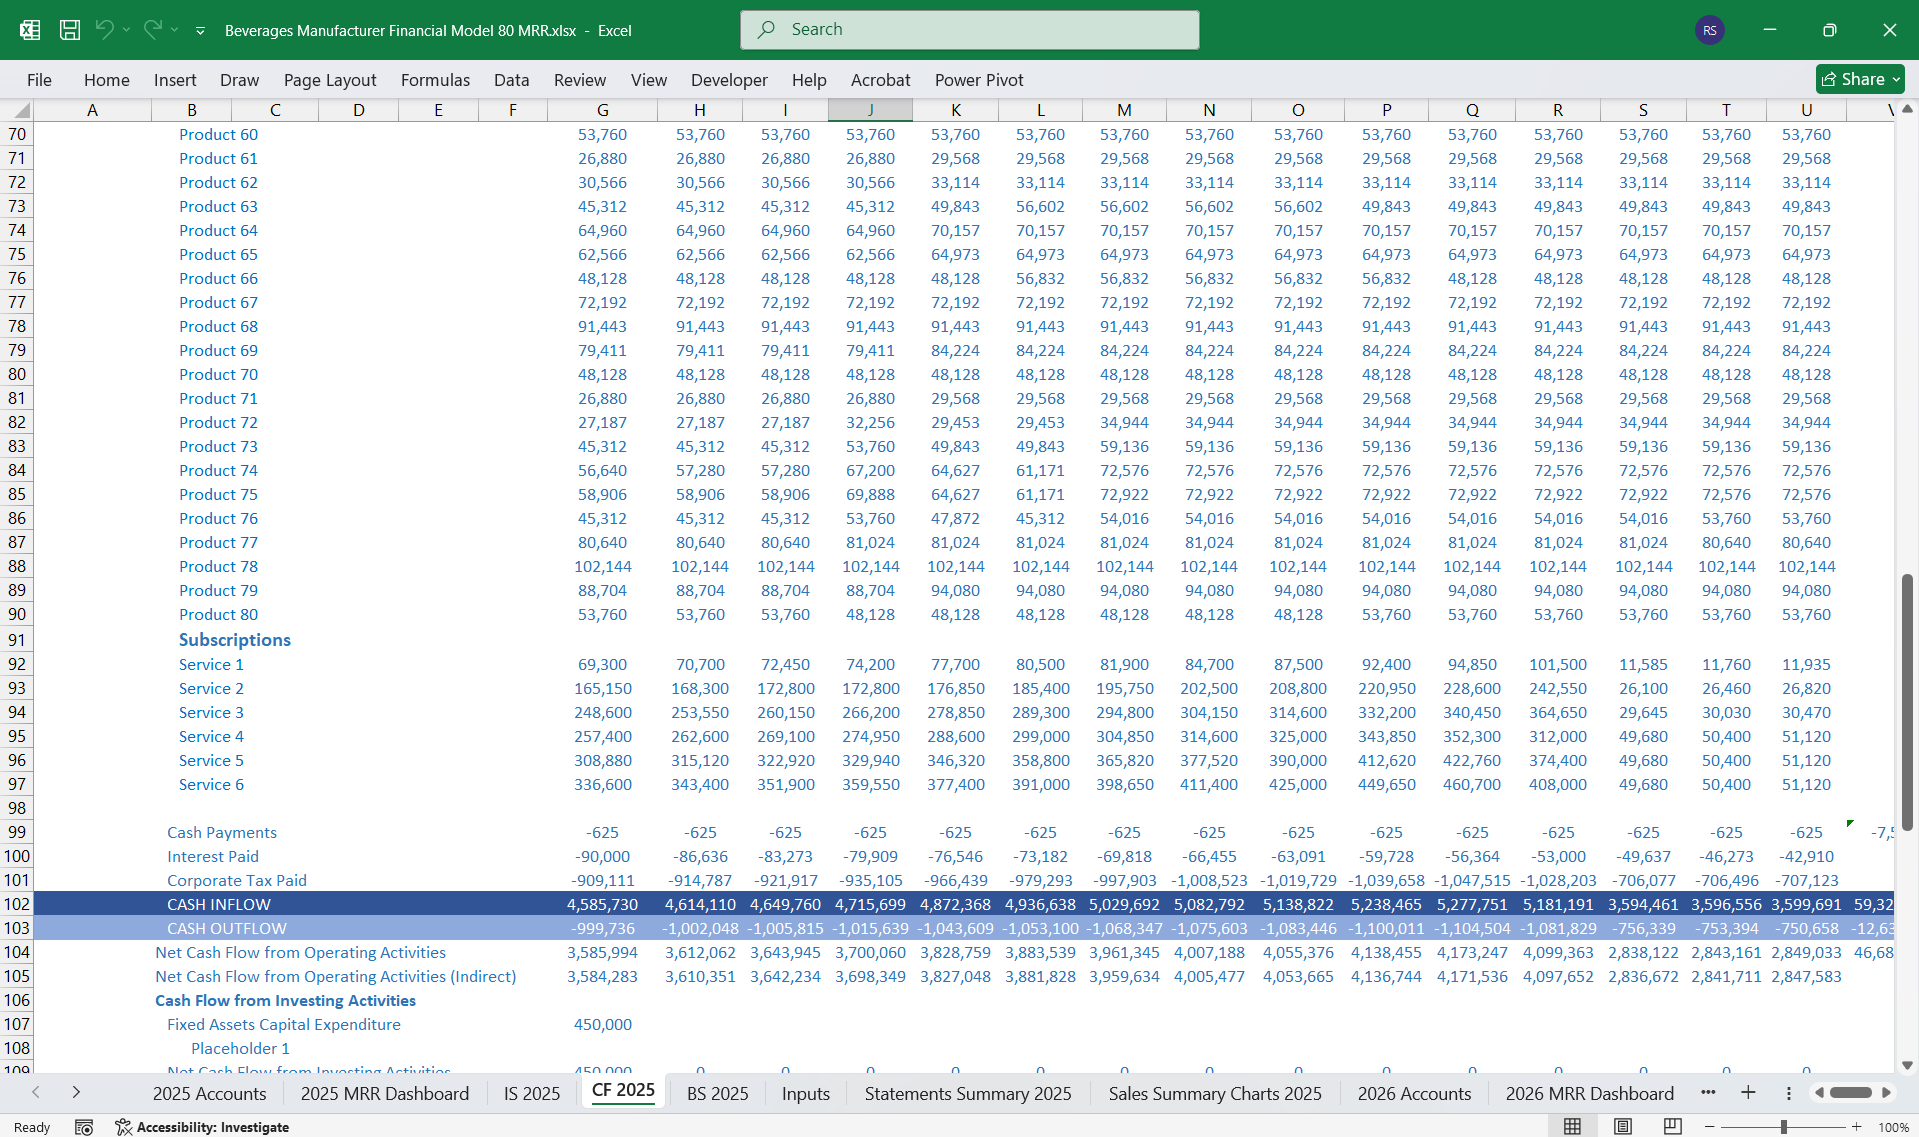
  2. 6-Tier Subscription Model Add-on – Recurring revenue based on subscription tiers with different pricing and benefits.


1. Income StatementThe Income Statement (Profit & Loss Statement) reflects revenues, expenses, and net income. It includes:
Revenue Streams
  • Retail Sales Revenue (Supermarkets, convenience stores, direct-to-consumer sales)
  • Wholesale Revenue (Bulk sales to distributors, cafes, restaurants)
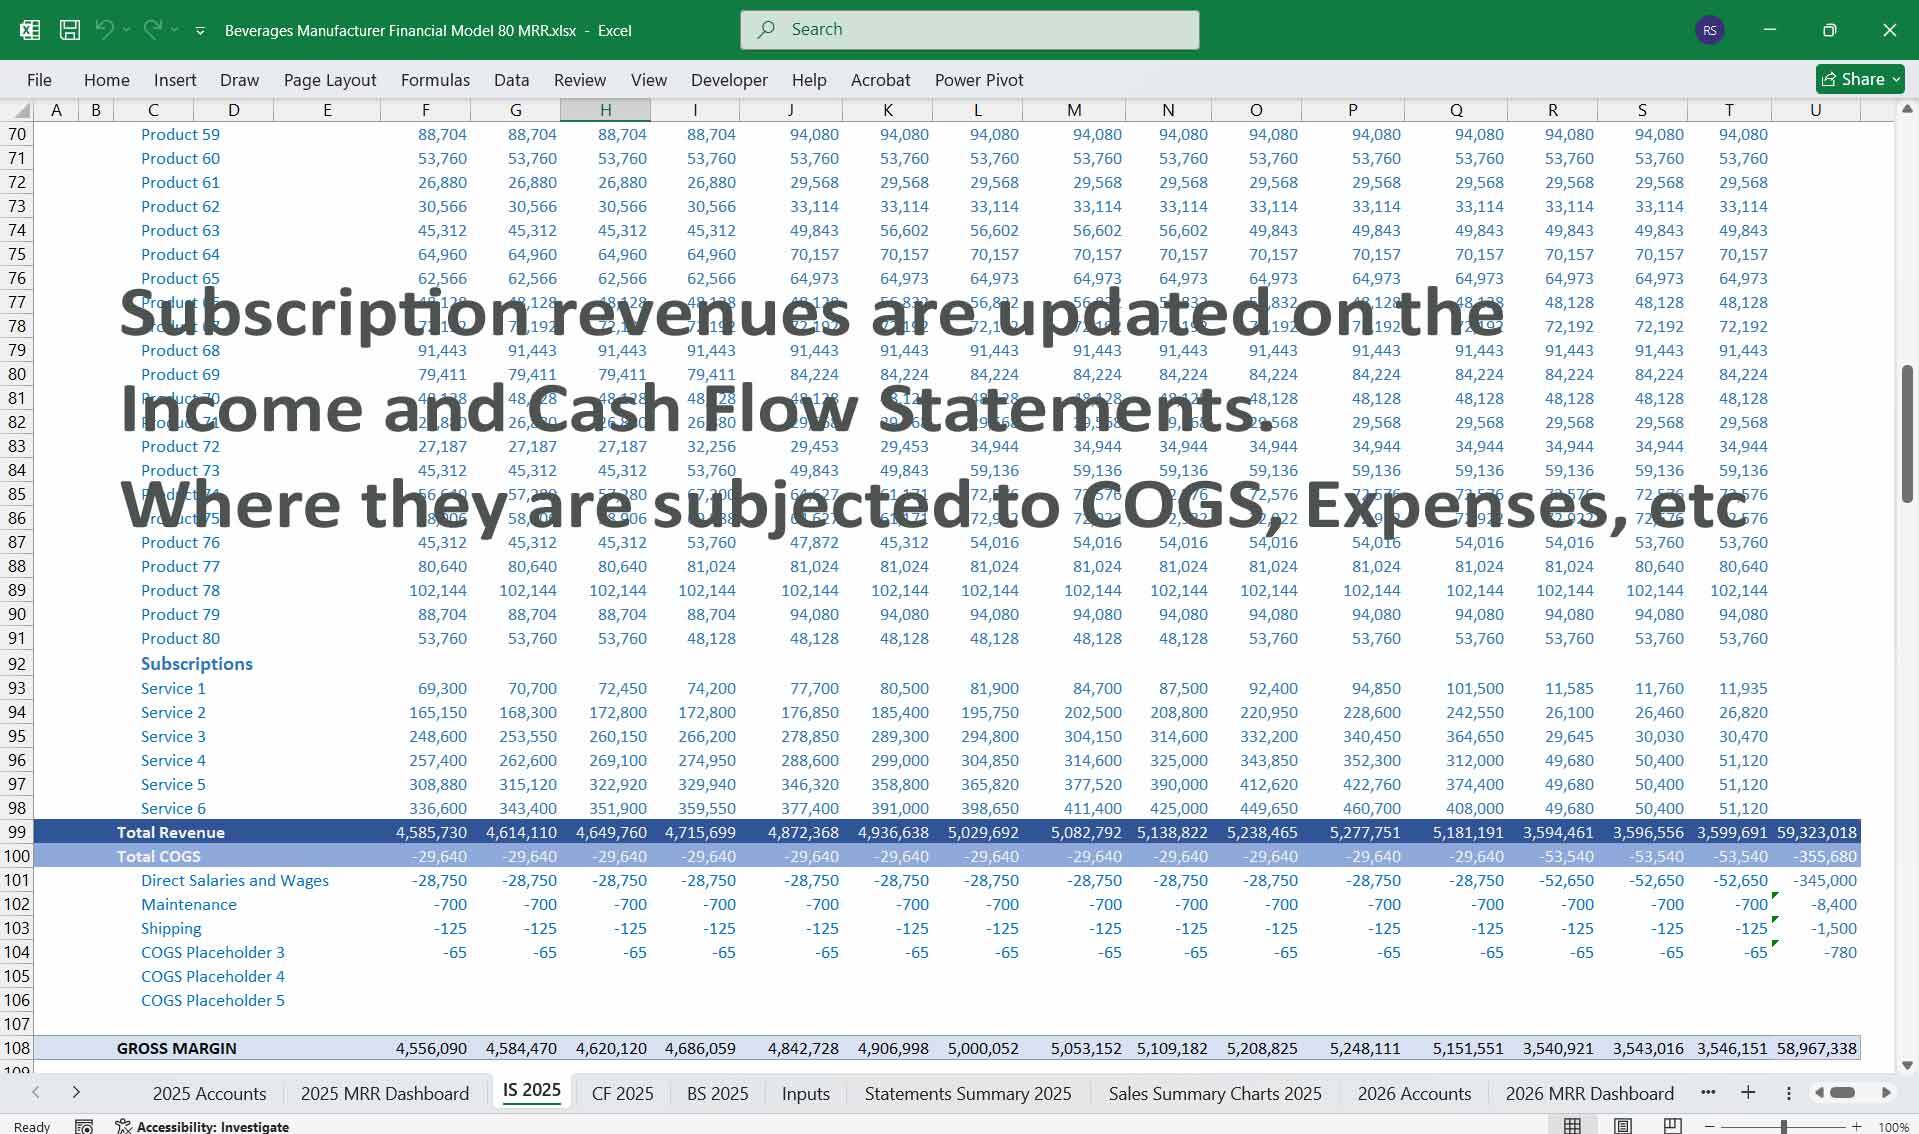
  • Subscription Revenue (Customers subscribing to beverage delivery)
  • Private Label & White Label Sales (Selling beverages to other brands)
  • Export Sales Revenue (Selling to international distributors)
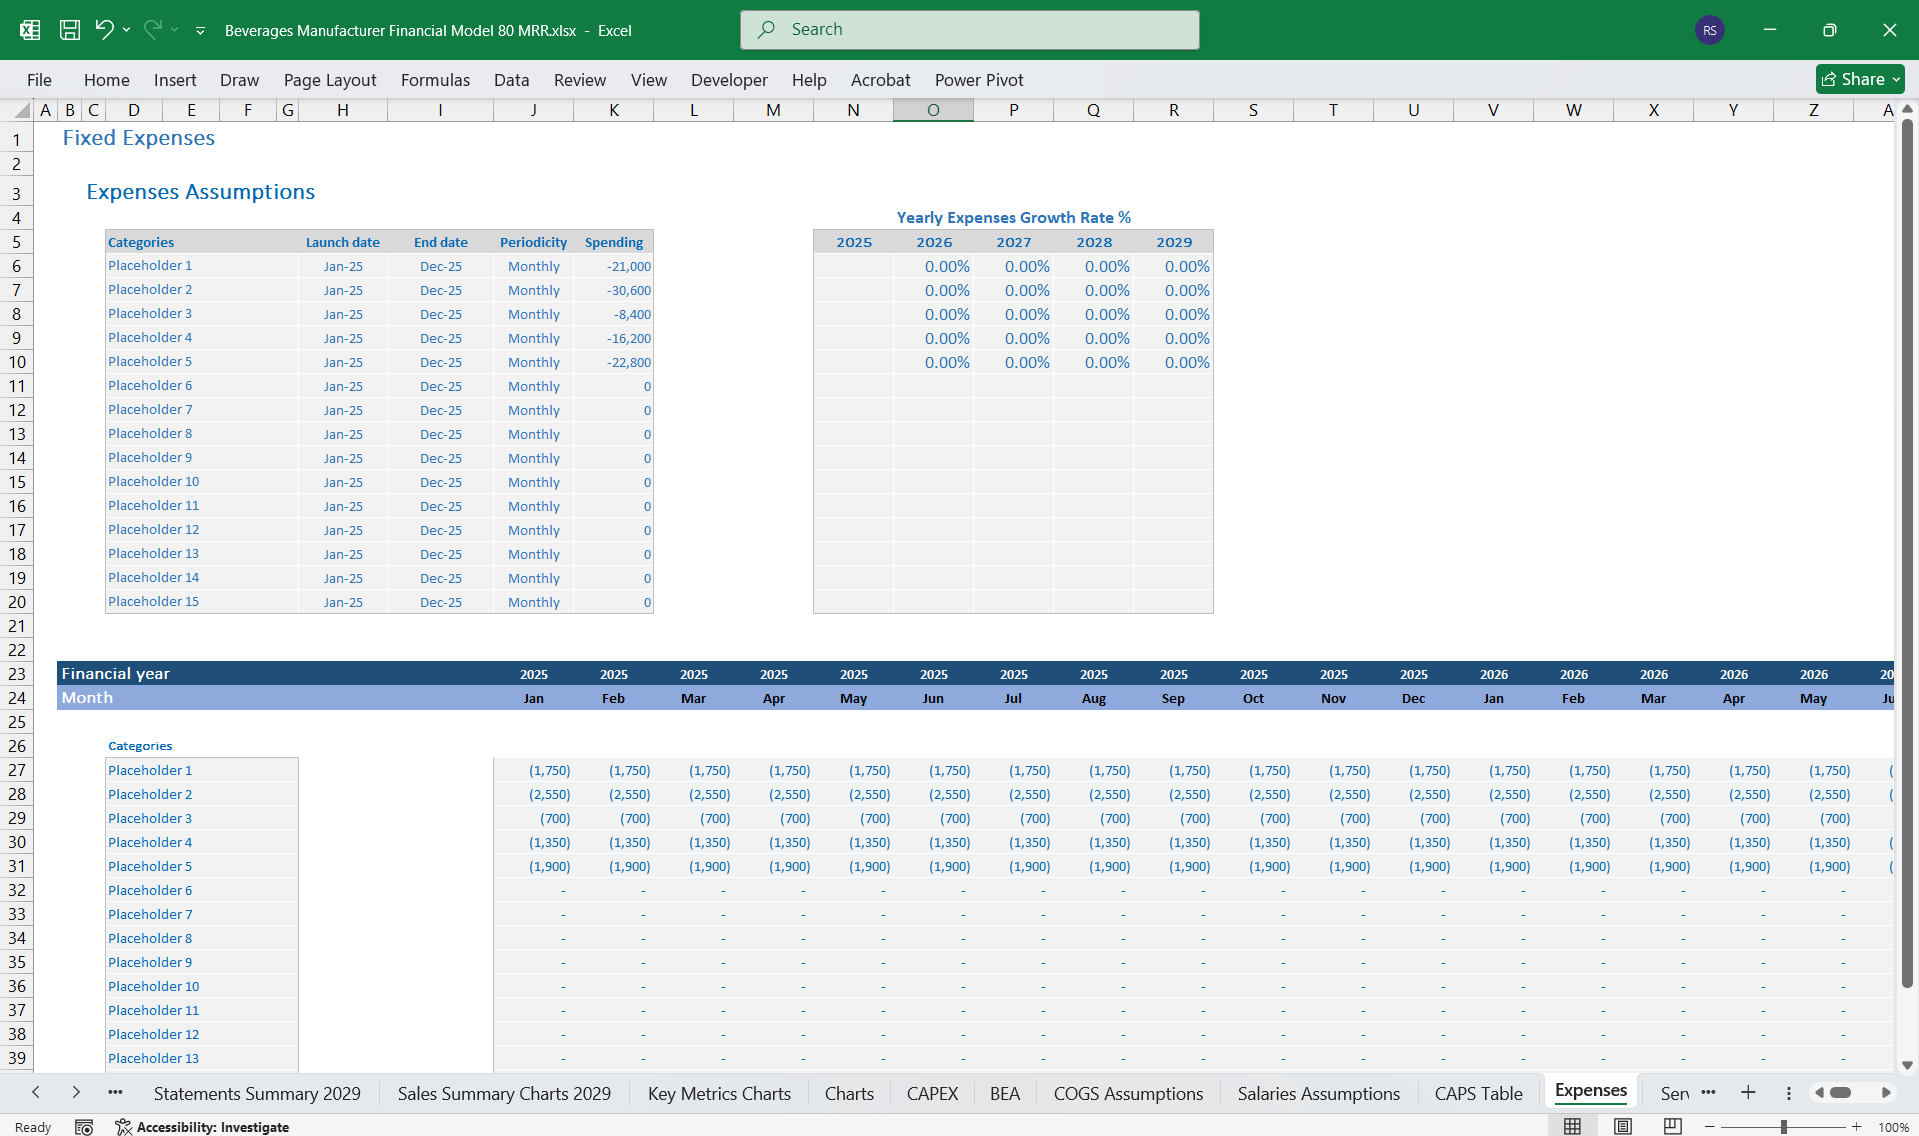
Revenue Breakdown for 80 Product Variants
  • 80 Variants: More diverse SKU portfolio with additional flavors, packaging options, and specialty beverages.
Revenue Breakdown for Subscription Model (6 Tiers)
  1. Basic Plan – Monthly supply of limited beverages (e.g., 10 units)
  2. Silver Plan – More variety, 20 units/month
  3. Gold Plan – Premium beverages, 30 units/month
  4. Platinum Plan – Exclusive flavors, 50 units/month
  5. Enterprise Plan – Bulk subscription for offices/restaurants
  6. Custom Plan – Fully customizable mix of beverages
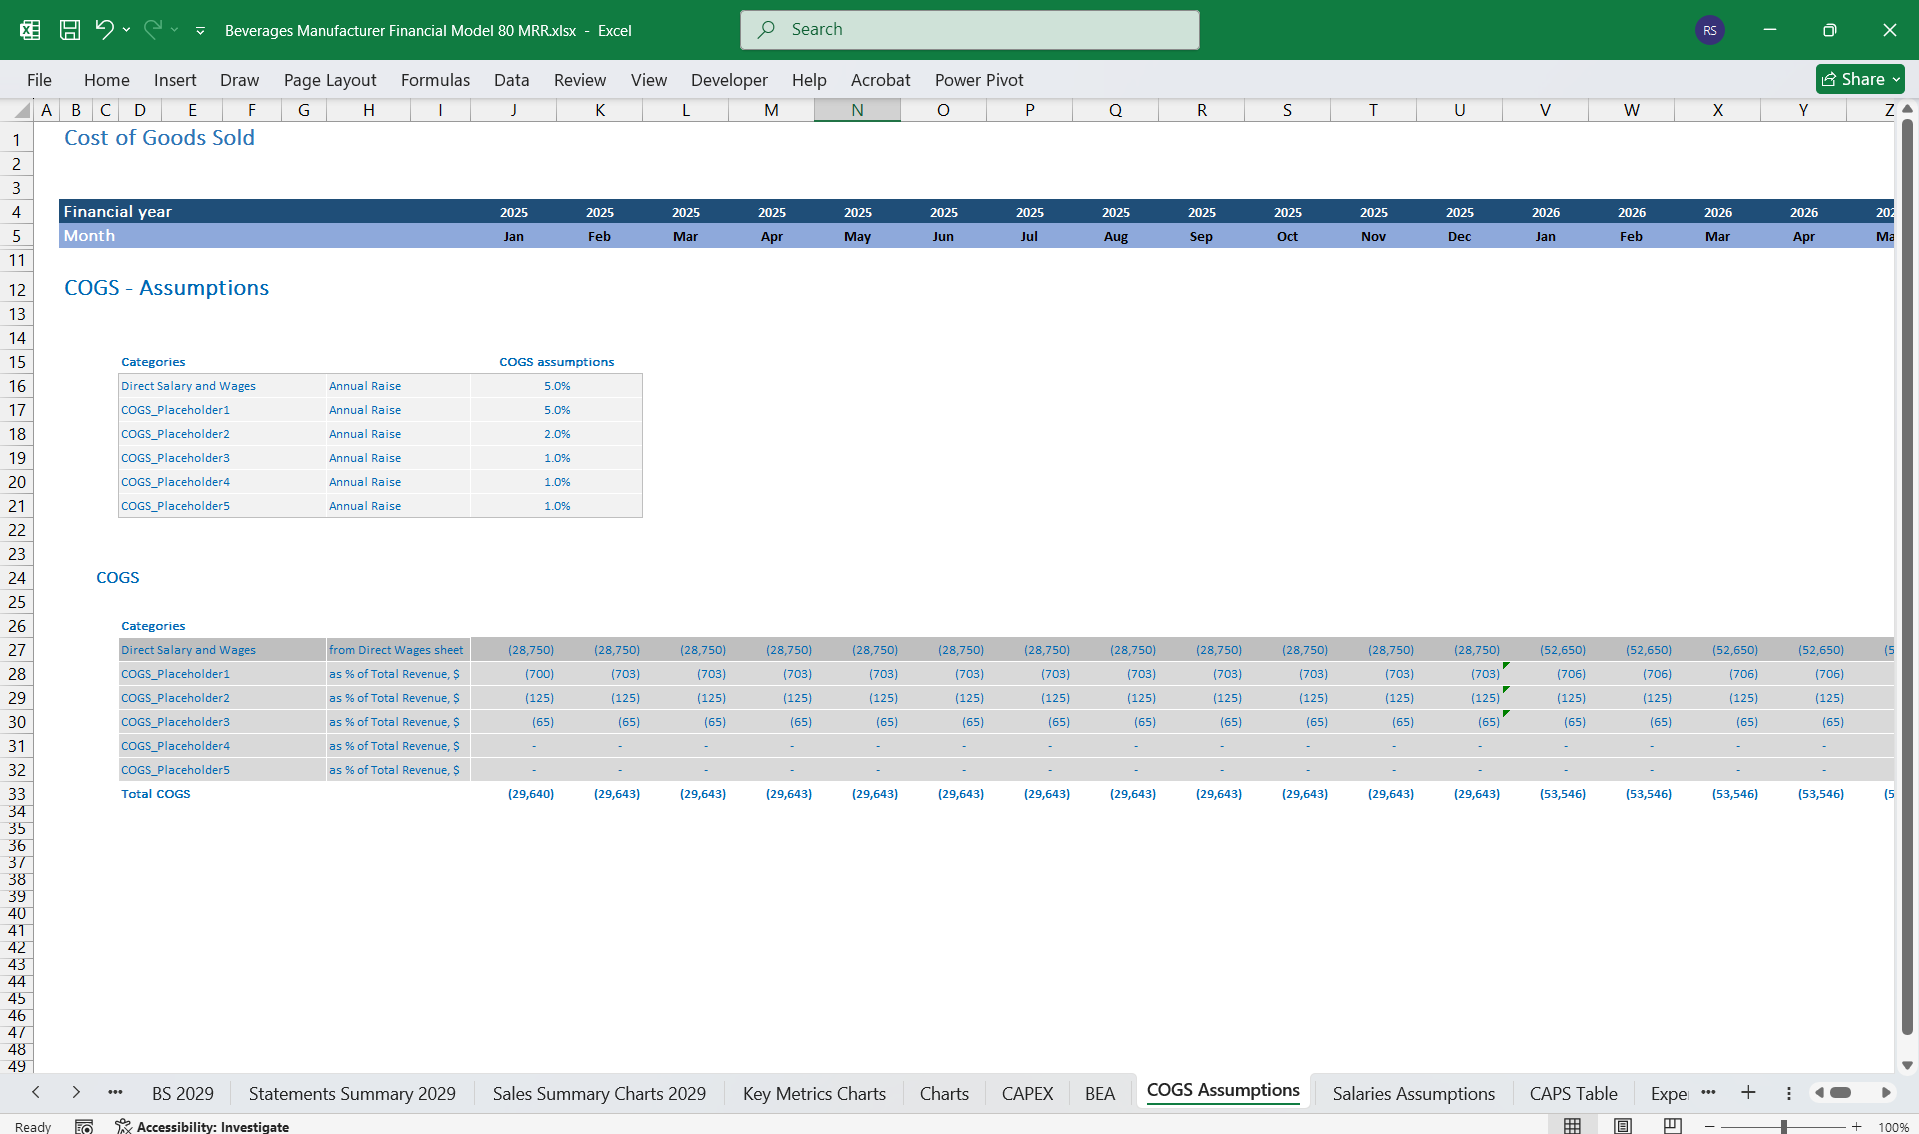
Cost of Goods Sold (COGS)
  • Raw Material Costs (Fruits, sweeteners, carbonated water, packaging)
  • Production Costs (Labor, factory overheads)
  • Distribution & Logistics (Warehousing, transport, fuel)
  • Quality Control & Testing
Operating Expenses (OPEX)
  • Sales & Marketing (Advertising, promotions, influencer campaigns)
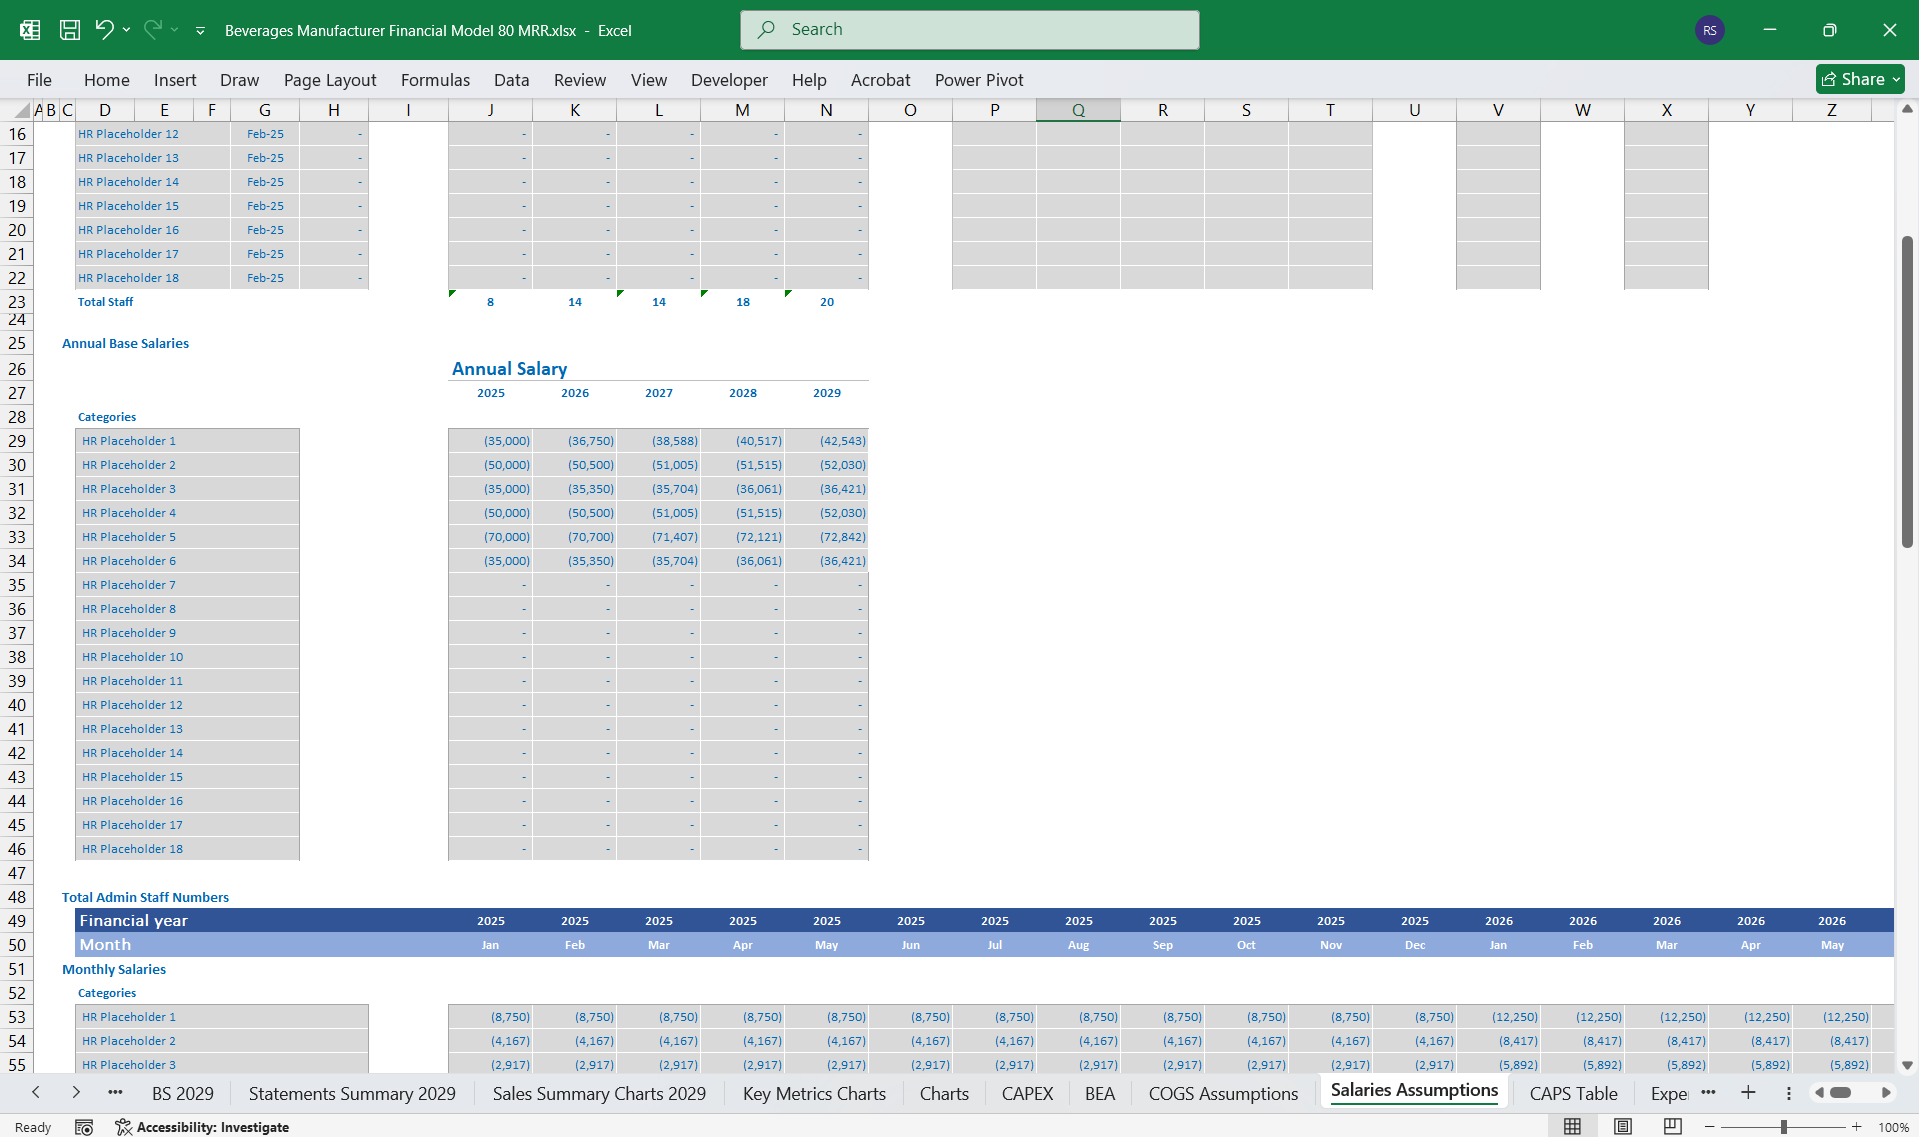
  • Administrative Costs (HR, office expenses)
  • R&D & Product Development (New flavors, packaging innovations)
Profitability Metrics
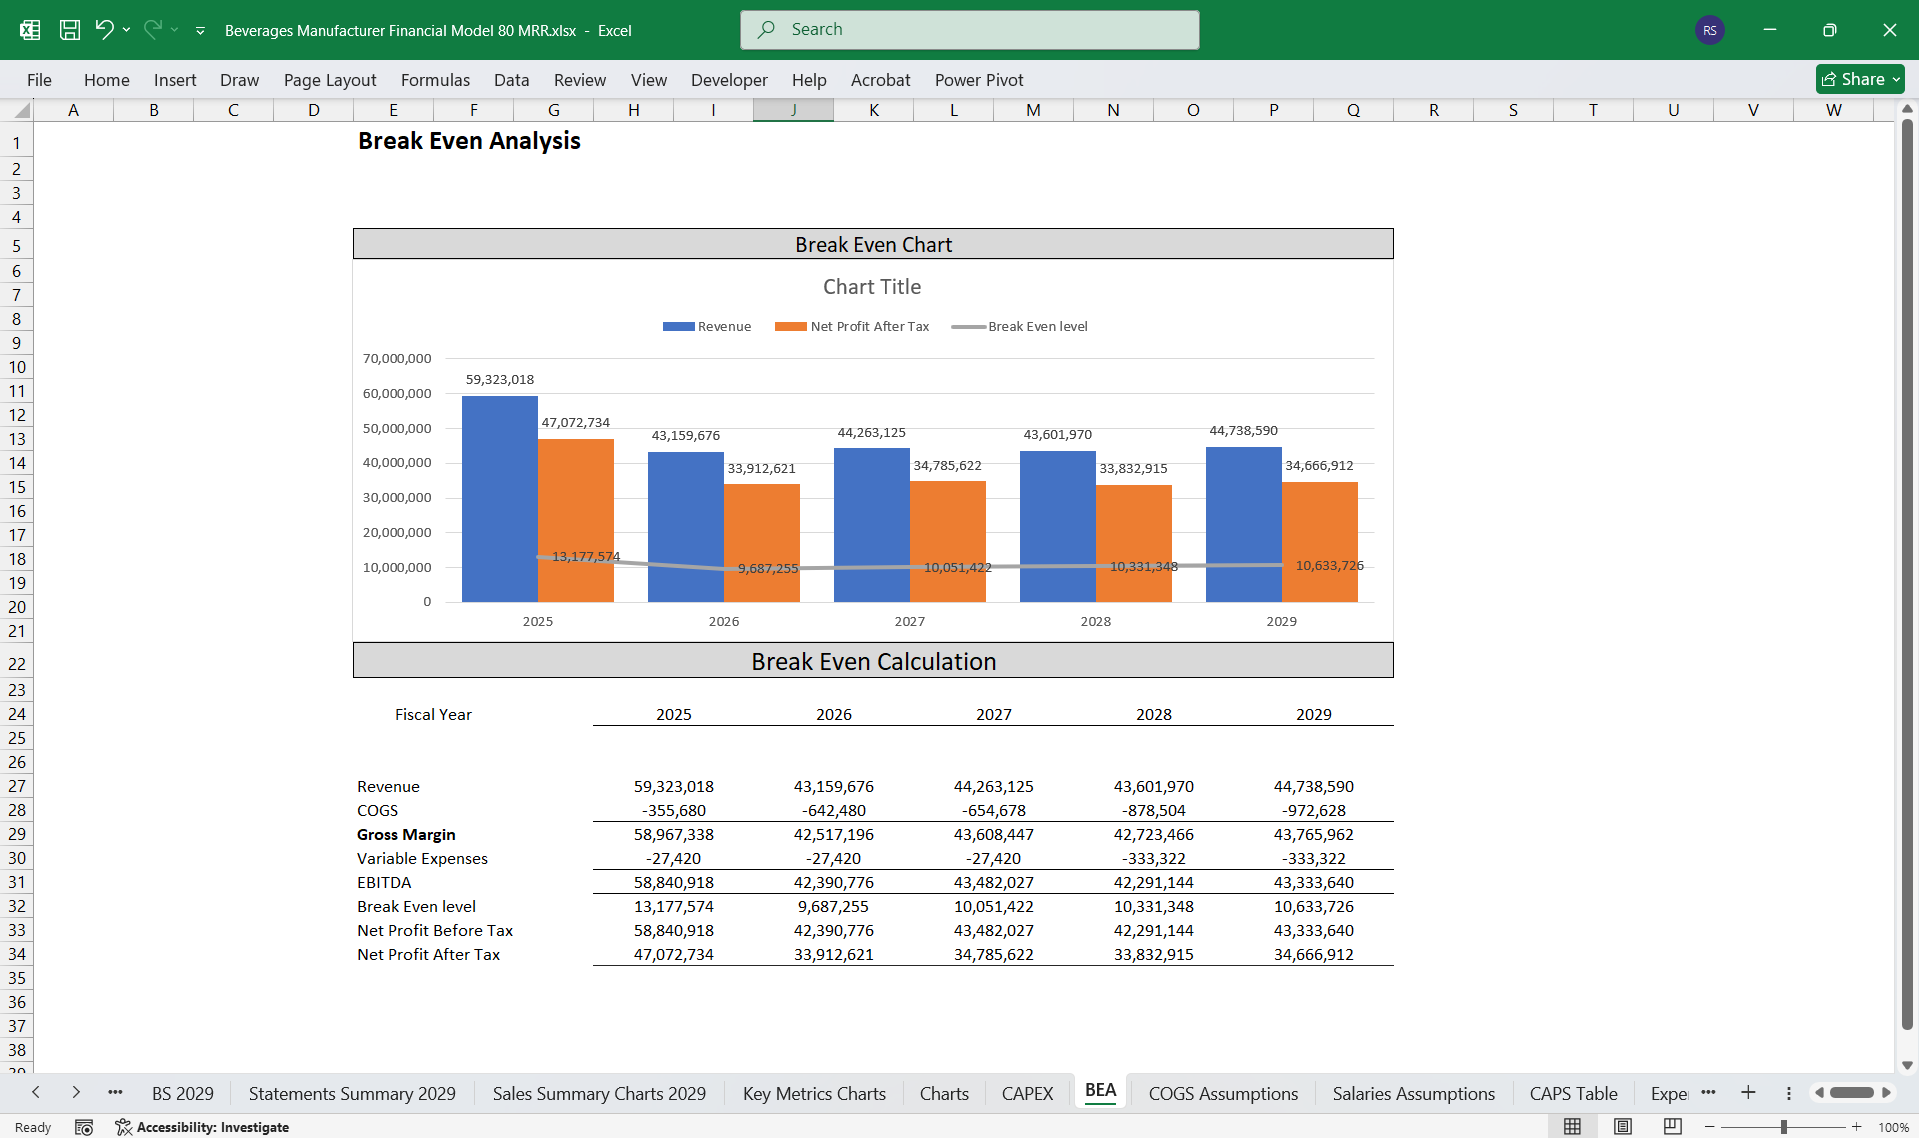
  • Gross Profit = Revenue - COGS
  • EBITDA = Operating Profit Before Depreciation & Amortization
  • Net Income = Revenue - All Expenses - Taxes


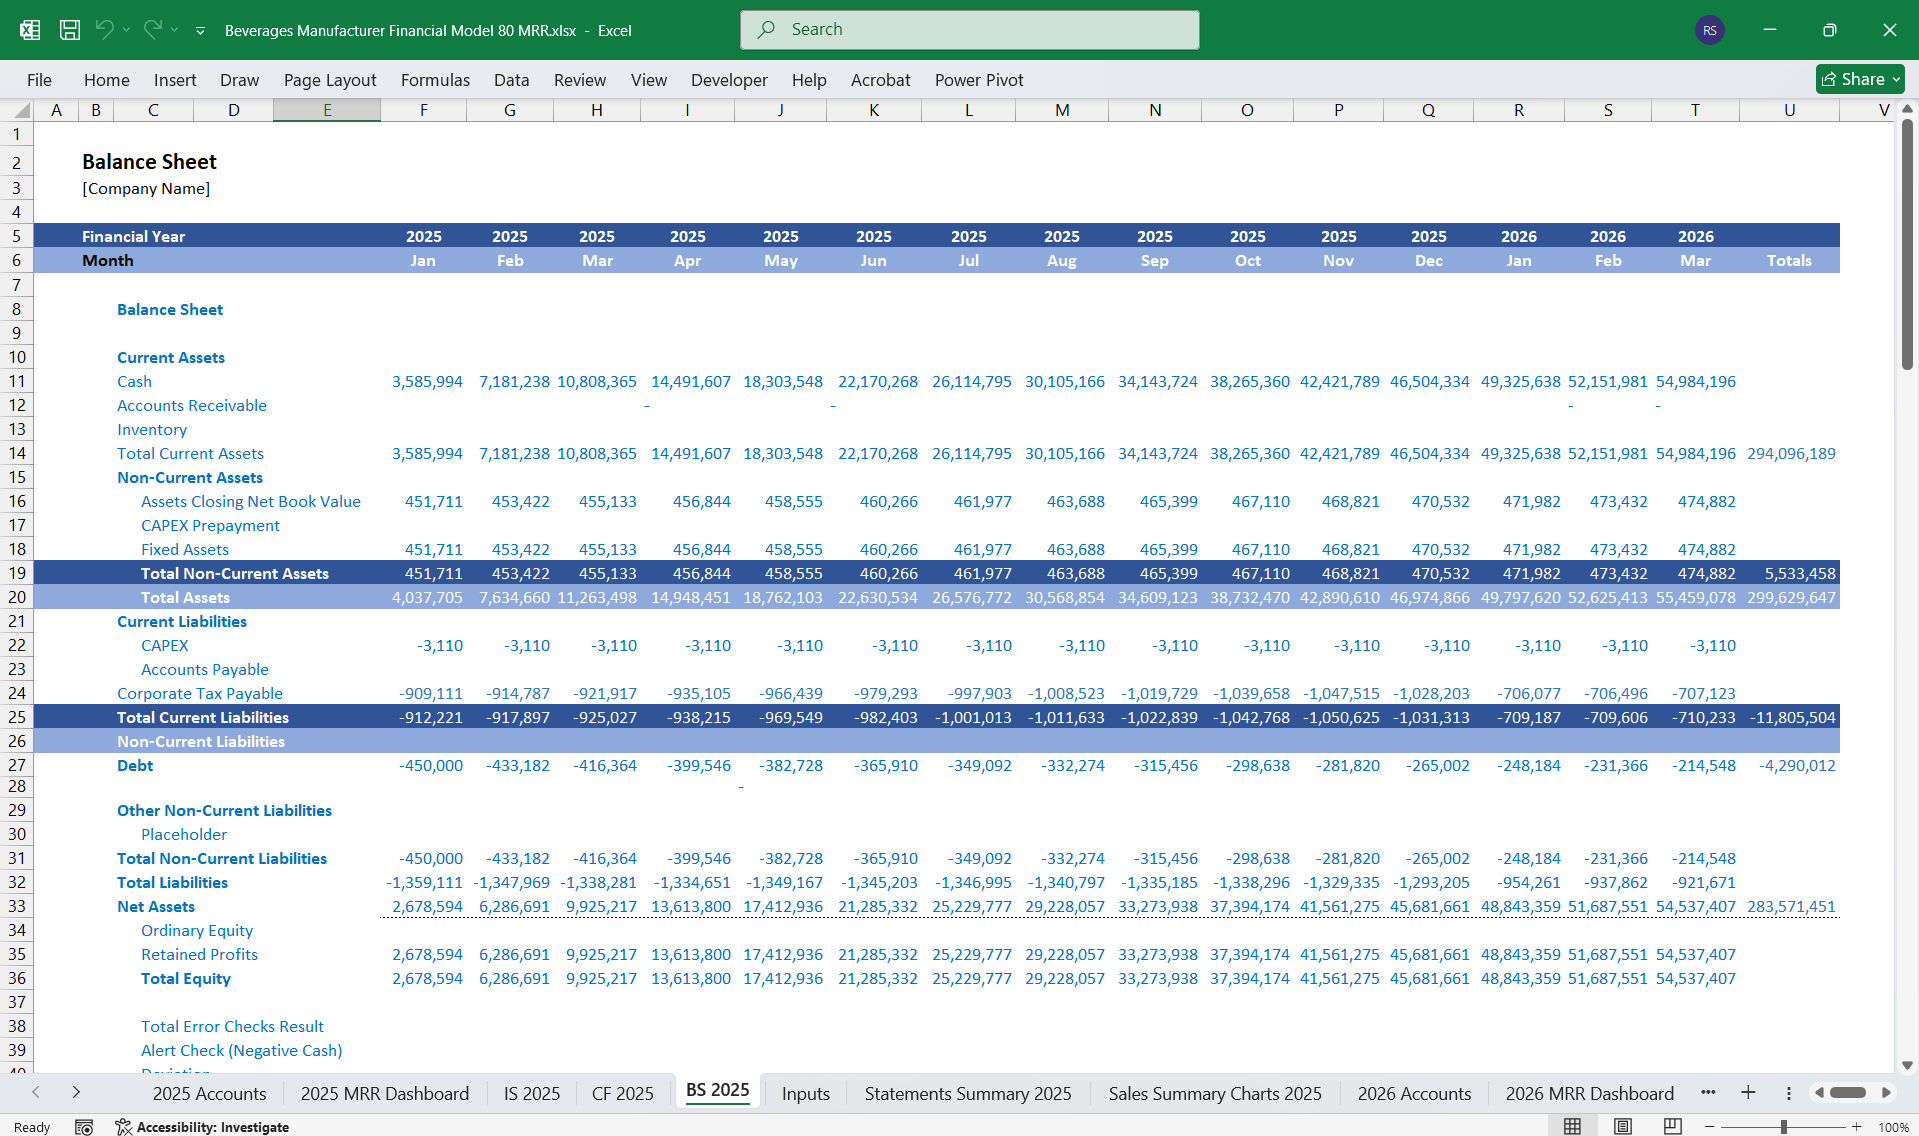
2. Balance SheetThe Balance Sheet provides a snapshot of assets, liabilities, and equity.
AssetsCurrent Assets
  • Cash & Cash Equivalents (Liquidity for operations)
  • Accounts Receivable (Wholesale customer payments)
  • Inventory (Raw materials, Work-in-Progress, Finished Goods)
Non-Current Assets
  • Property, Plant & Equipment (PPE) (Manufacturing facilities, warehouses)
  • Intangible Assets (Trademarks, patents for beverages)
  • Investments in R&D
LiabilitiesCurrent Liabilities
  • Accounts Payable (Payments to suppliers)
  • Short-Term Loans (Working capital financing)
  • Accrued Expenses (Salaries, marketing spend)
Non-Current Liabilities
  • Long-Term Debt (Factory financing, expansion loans)
  • Deferred Revenue (Subscription Prepayments)
Shareholders’ Equity
  • Retained Earnings (Profits reinvested)
  • Owner’s Equity / Shareholder Contributions


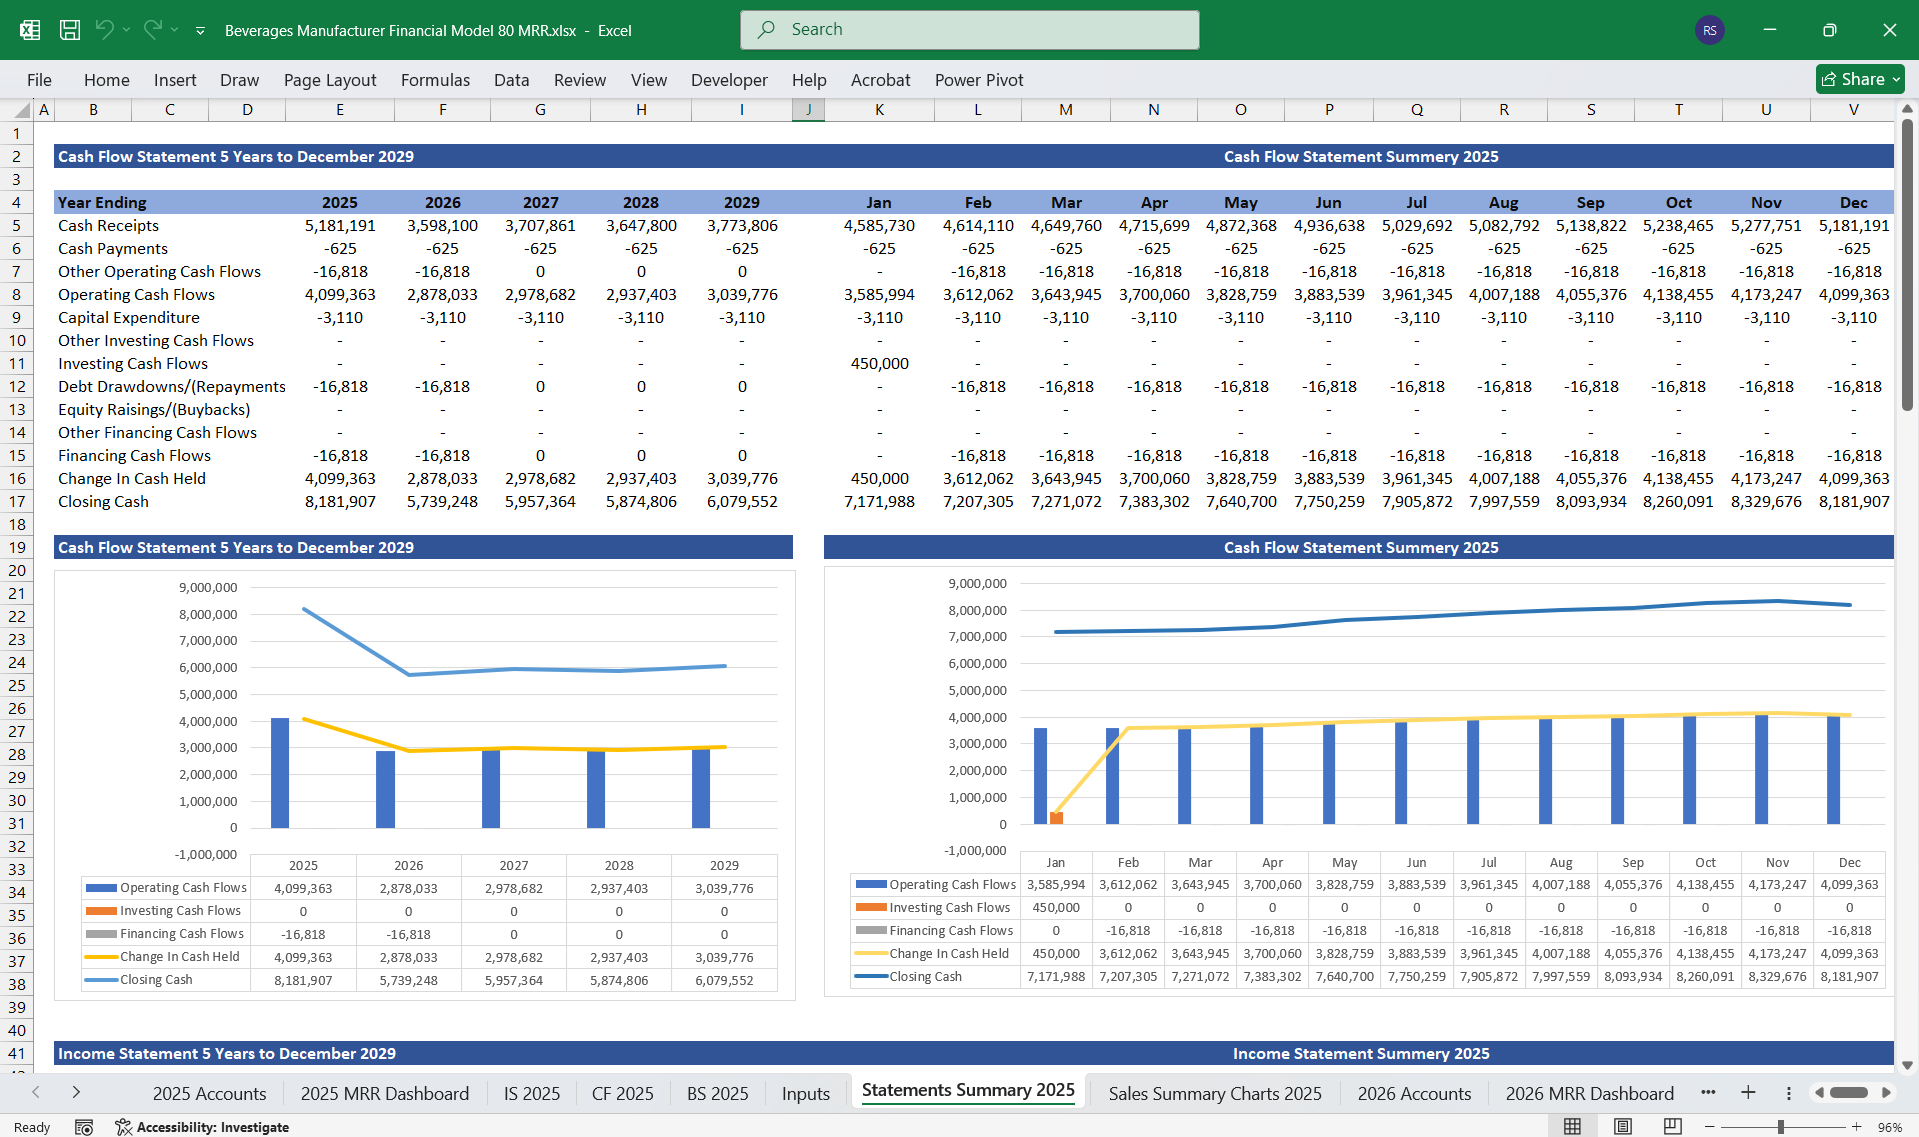
3. Cash Flow StatementThe Cash Flow Statement tracks liquidity, showing cash inflows and outflows.
Operating Cash Flow
  • Cash from Sales Revenue
  • Payments to Suppliers & Employees
  • Subscription Payments Received in Advance
  • Inventory Purchases
Investing Cash Flow
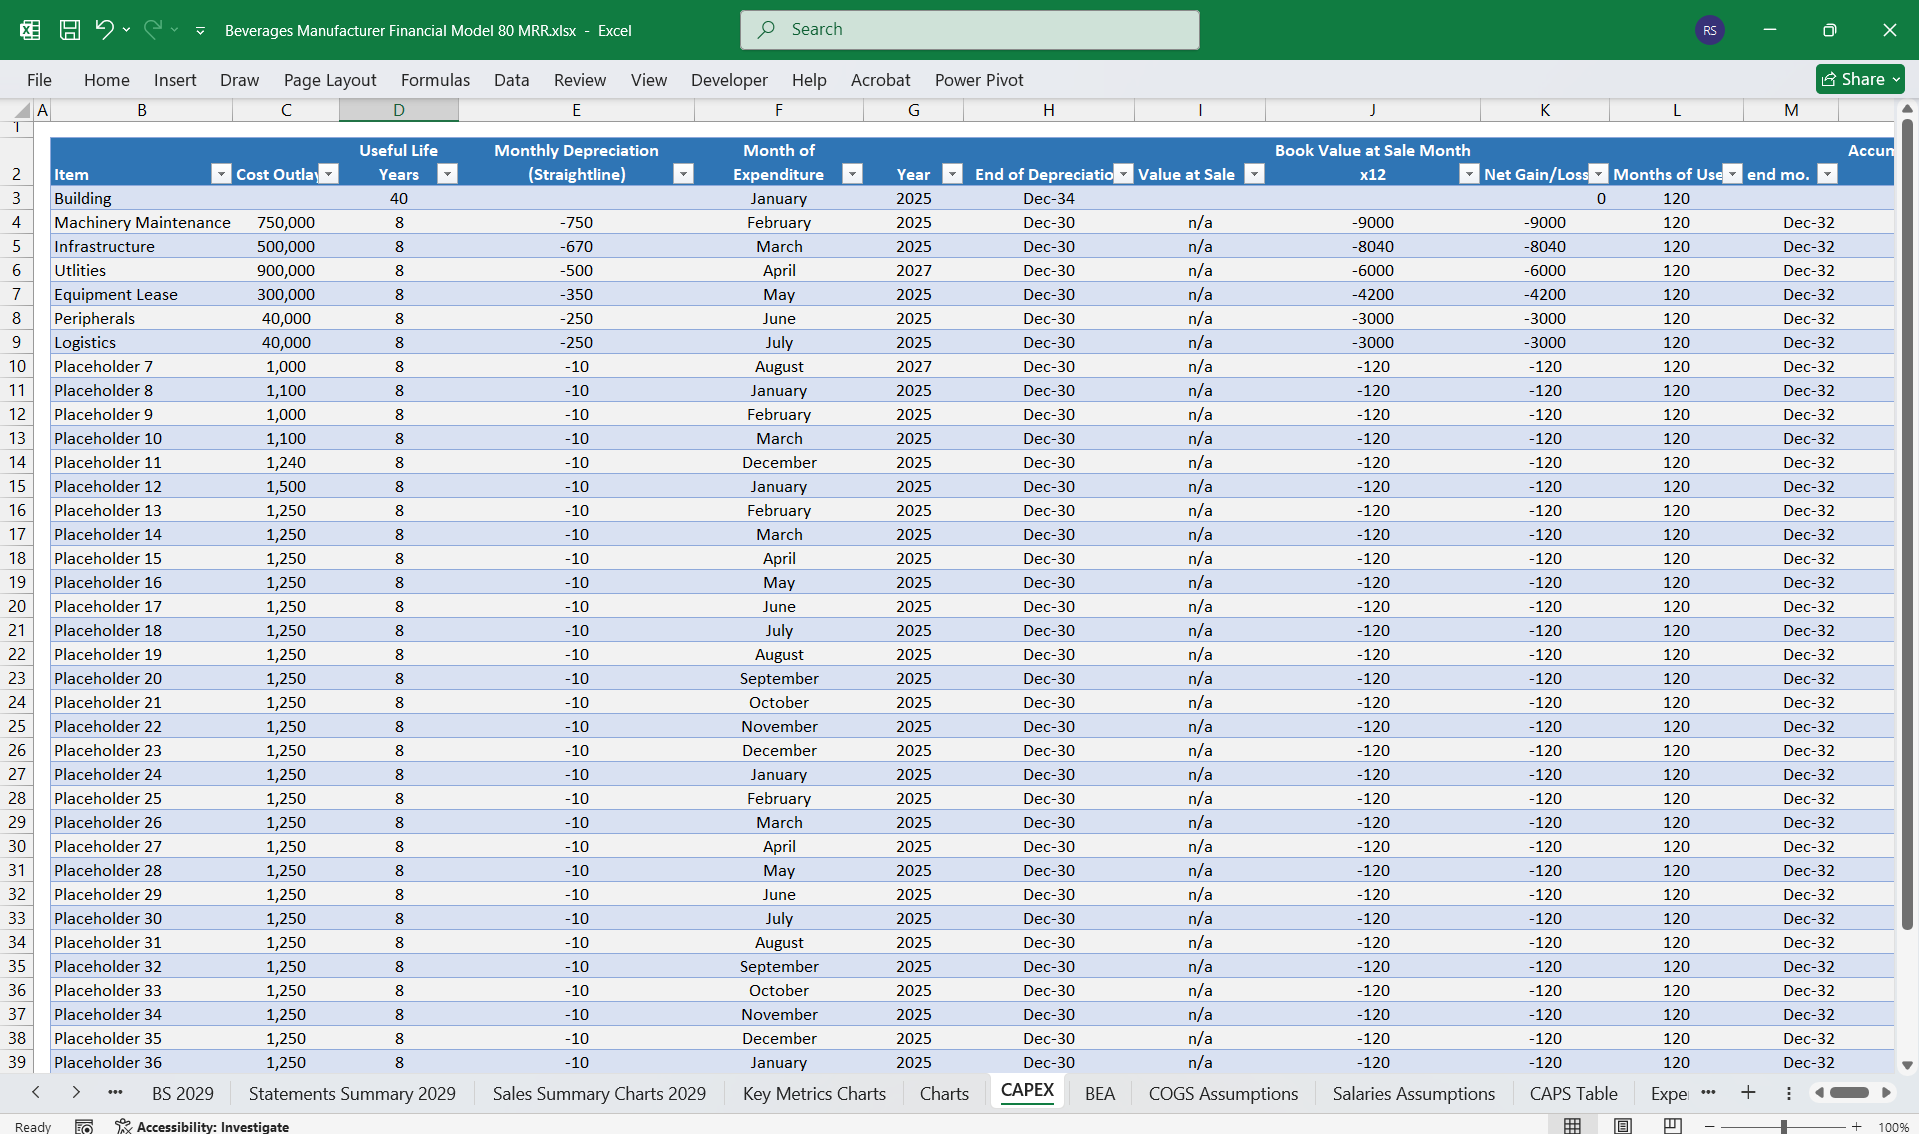
  • Capital Expenditures (CAPEX) (New factory equipment, automation)
  • R&D Investments (New product development)
Financing Cash Flow
  • Debt Issuance / Repayment (Bank loans, bonds)
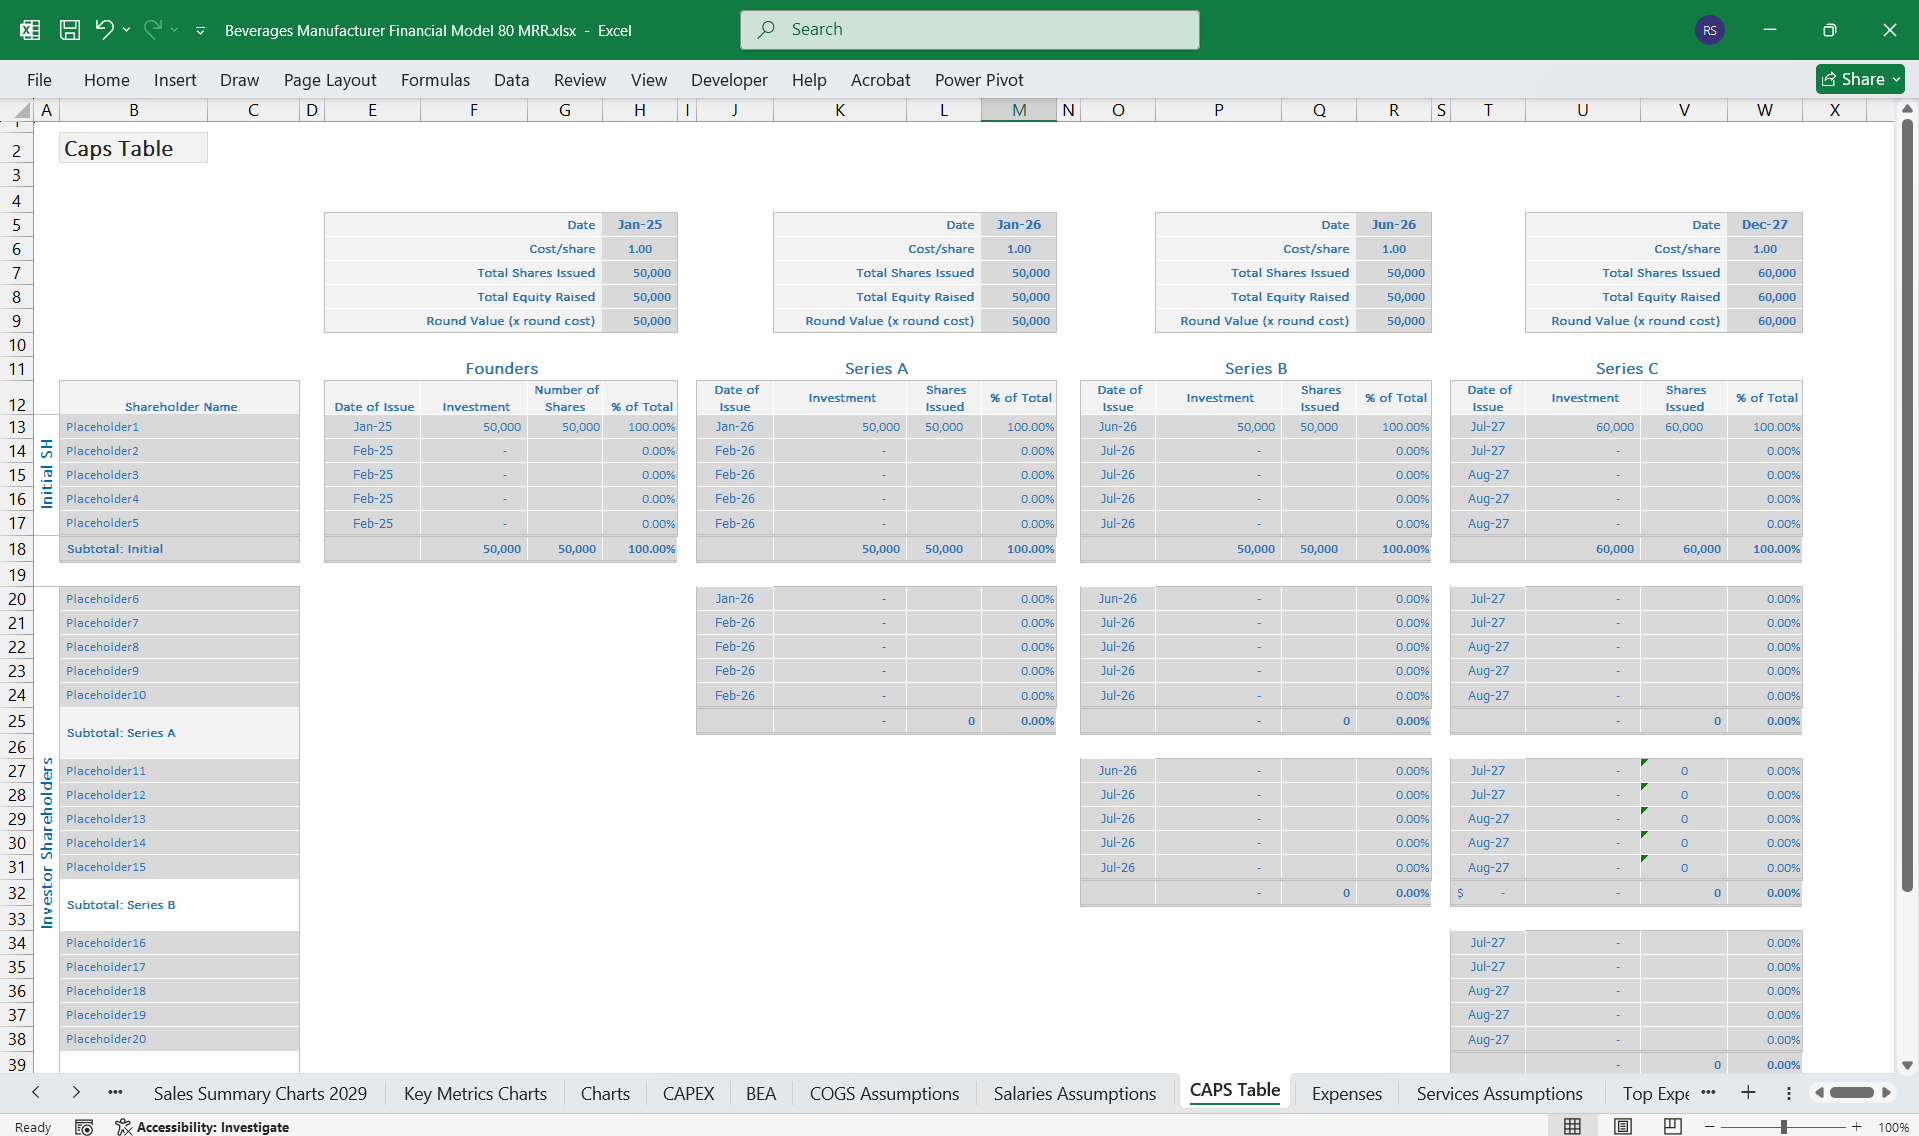
  • Equity Financing (New investments from shareholders)
  • Dividend Payments (If applicable)
Interdependencies Between Statements
  1. Revenue Growth (Income Statement) → Impacts Accounts Receivable (Balance Sheet) & Cash Flow
  2. Inventory Management (Balance Sheet) → Affects COGS (Income Statement) & Cash Flow
  3. Debt Repayments (Balance Sheet) → Affect Financing Cash Flows (Cash Flow Statement)

This Best Practice includes
1 Excel Financial Model

Acquire business license for $115.00

Add to cart

Add to bookmarks

Discuss

Further information

This financial model is adaptable, and its metrics should align with the strategic goals of your Beverages Manufacturing, whether focused on scaling the user base, maximizing profitability, or securing investment.


0.0 / 5 (0 votes)

please wait...