Originally published: 09/01/2024 09:41
Publication number: ELQ-71370-1
View all versions & Certificate
Publication number: ELQ-71370-1
View all versions & Certificate

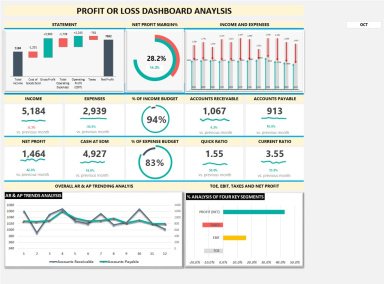
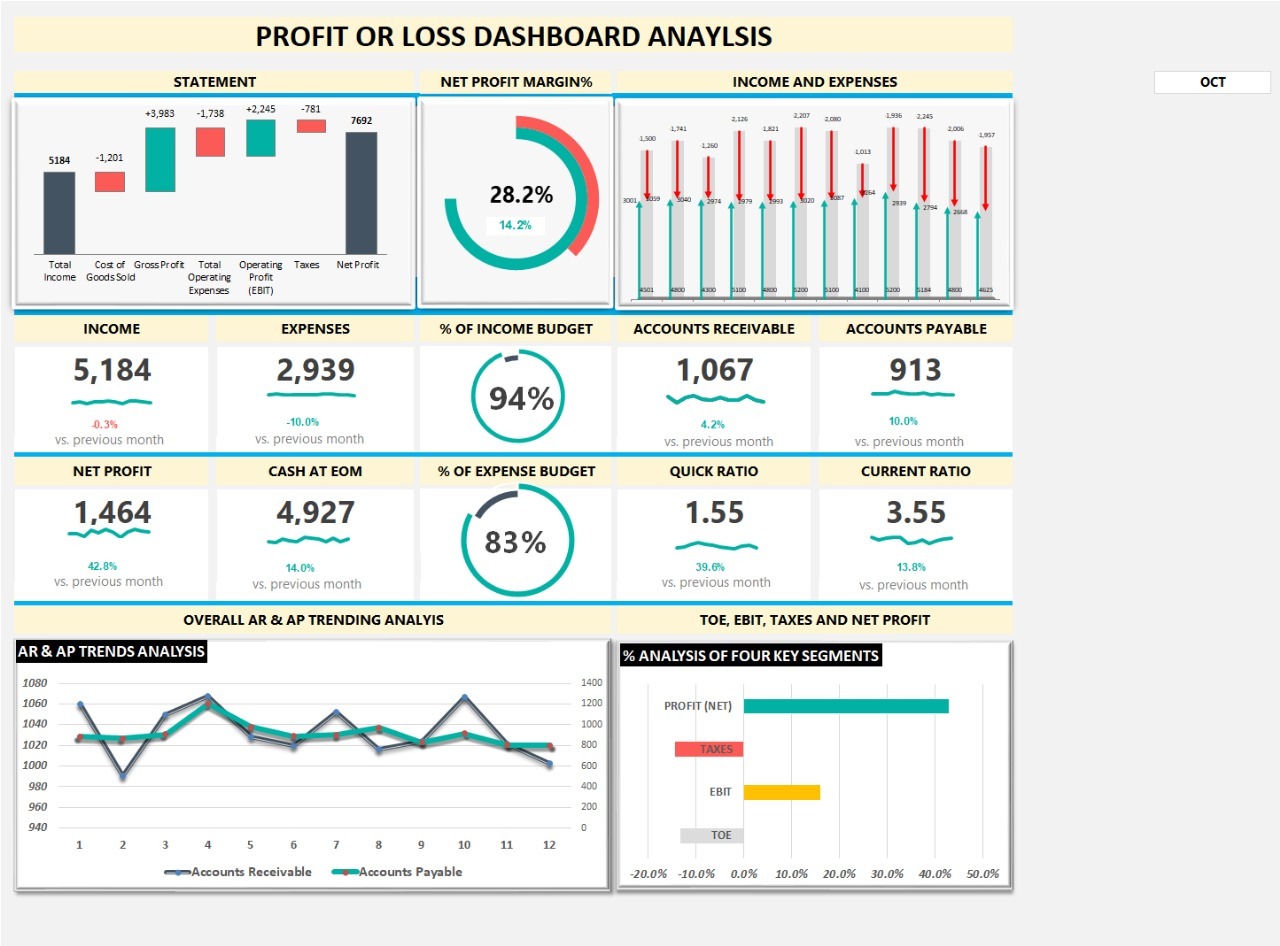
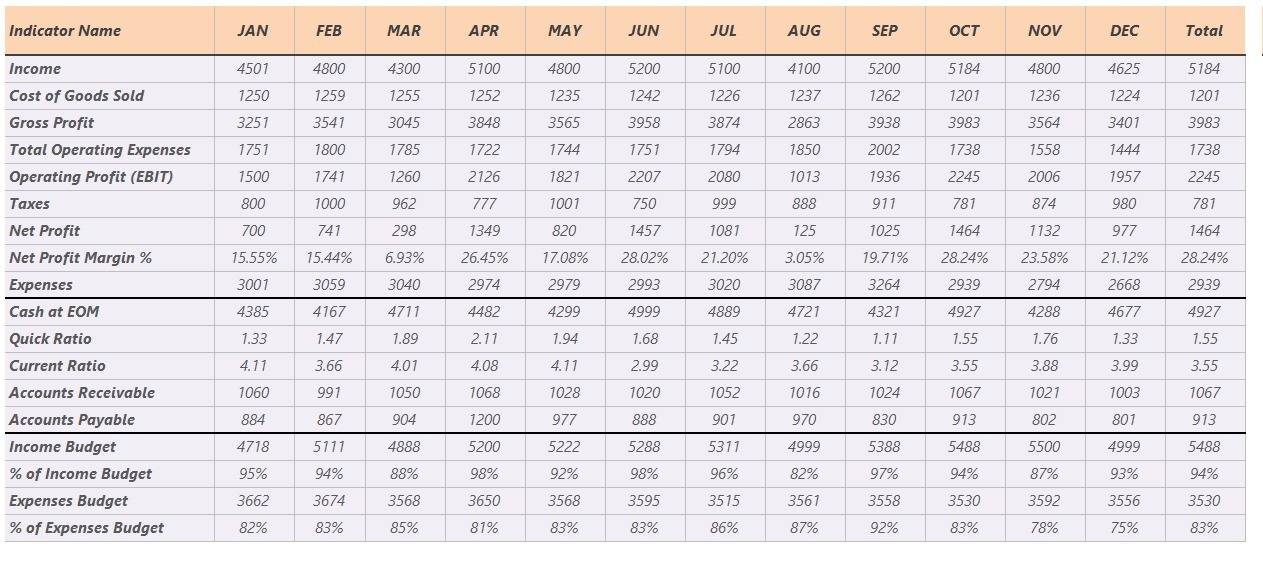
Profit or Loss Dashboard Analysis - Excel Template
P&L (Profit or Loss) Excel 📊 model template to help decision makers make an analysis.
Excel Wizard Here to Simplify Your Data Life! Discover Easy Techniques, Handy Templates, and Quick Fixes for Smoother Excel Experiences. Let's Tackle Your Excel Challenges Together!Follow 15
