Longevity & Anti-Aging Biotech rNPV Valuation Model | PoS, Licensing, Scenarios & Sensitivity
Originally published: 31/08/2026 08:20
Publication number: ELQ-53846-1
View all versions & Certificate
certified

Longevity & Anti-Aging Biotech rNPV Valuation Model | PoS, Licensing, Scenarios & Sensitivity

Risk-adjusted Excel valuation for longevity biotech with PoS, 20-year rNPV, licensing, diagnostics, subscription, scenarios and dashboards.

Description

๐Ÿงฌ LONGEVITY / ANTI-AGING BIOTECH rNPV MODEL โ€” RISK-ADJUSTED PIPELINE VALUATION & STRATEGY

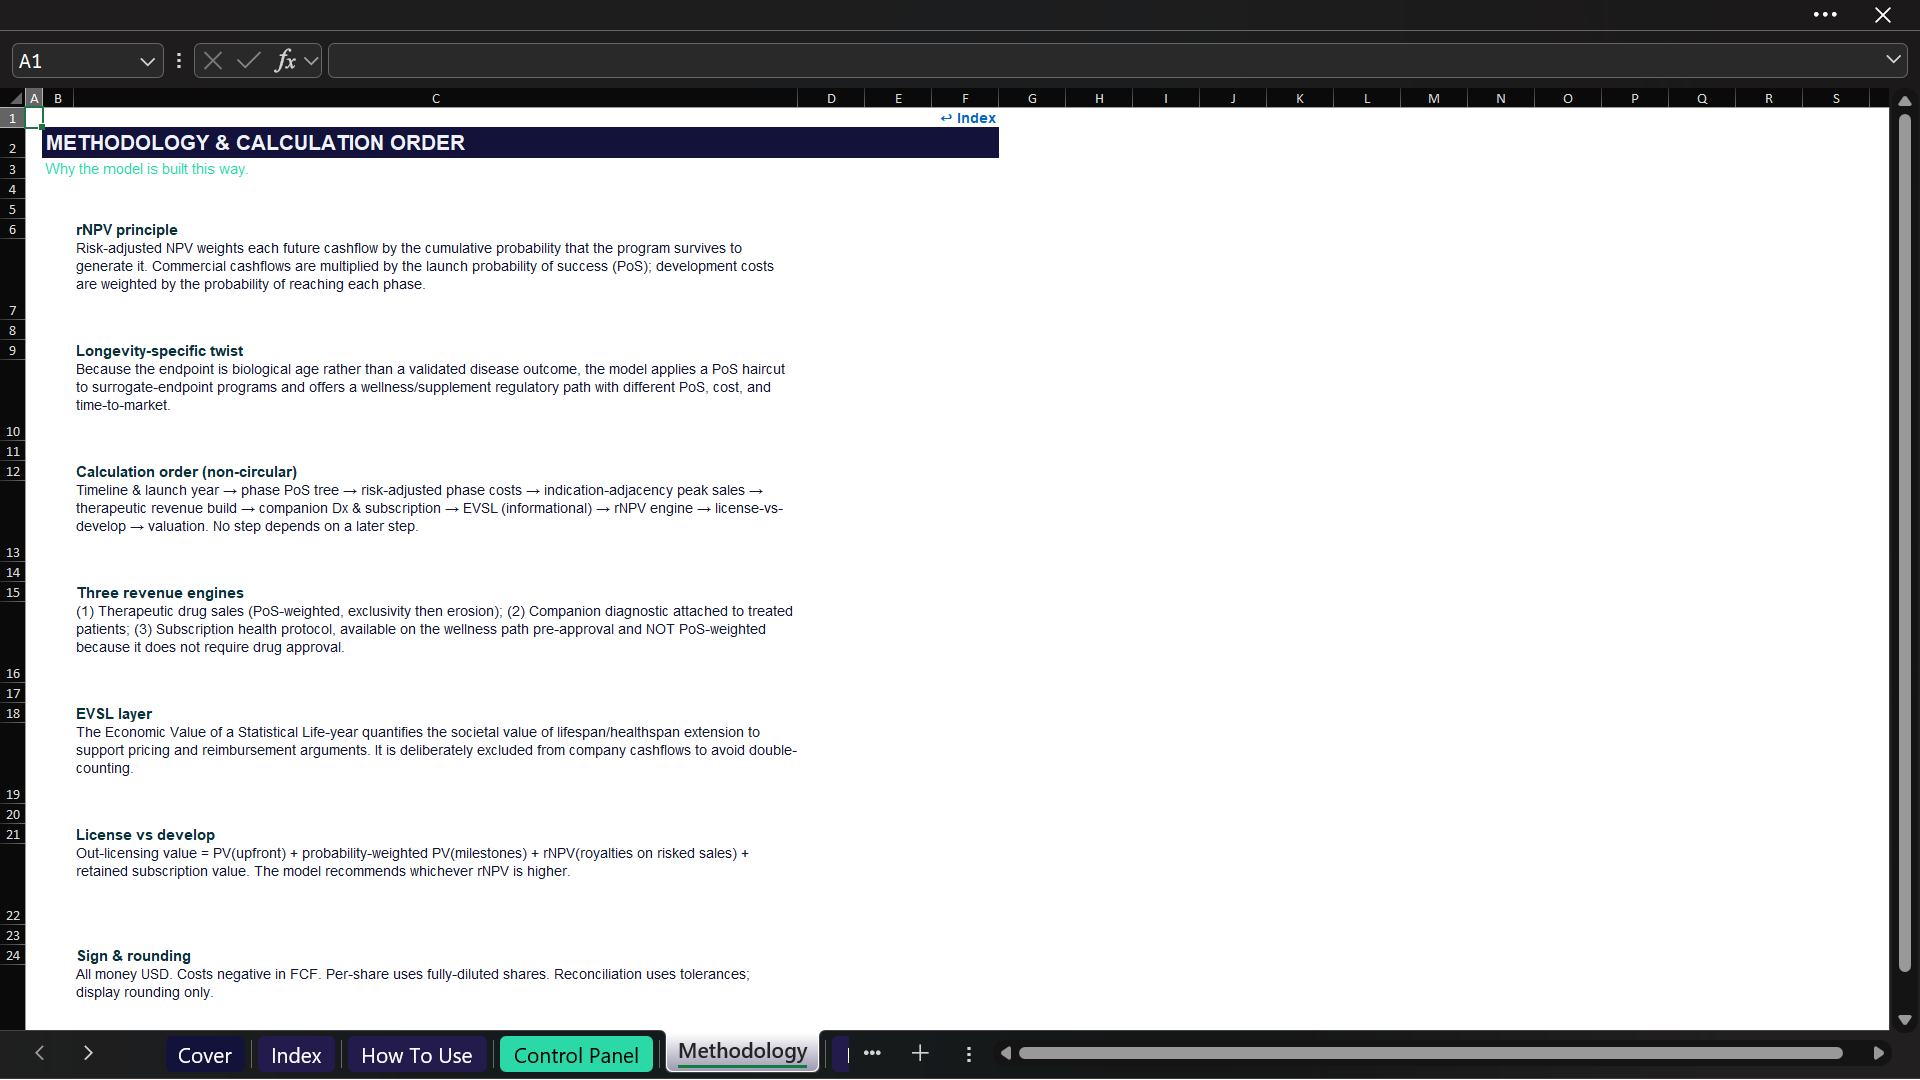
This Excel model is designed for the valuation and strategic analysis of a longevity or anti-aging biotechnology program where conventional DCF methods are not enough on their own. It combines a phase-by-phase probability-of-success framework with a 20-year annual cash-flow engine, therapeutic revenue, companion-diagnostic economics, a subscription health-protocol layer, licensing-versus-full-development analysis, scenario controls, and risk-adjusted NPV outputs.

The workbook is built around an editable Control Panel. Users can change the major scientific, clinical, commercial, transaction, and finance assumptions without editing the calculation sheets. The model then flows those assumptions through the development timeline, probability tree, revenue modules, rNPV engine, strategy comparison, valuation summary, sensitivities, KPI summaries, and dashboards.

๐ŸŽฏ WHAT THIS MODEL IS DESIGNED TO ANSWER
The model helps users evaluate questions such as:

  • What is the risk-adjusted value of a longevity biotech asset under the current development strategy?
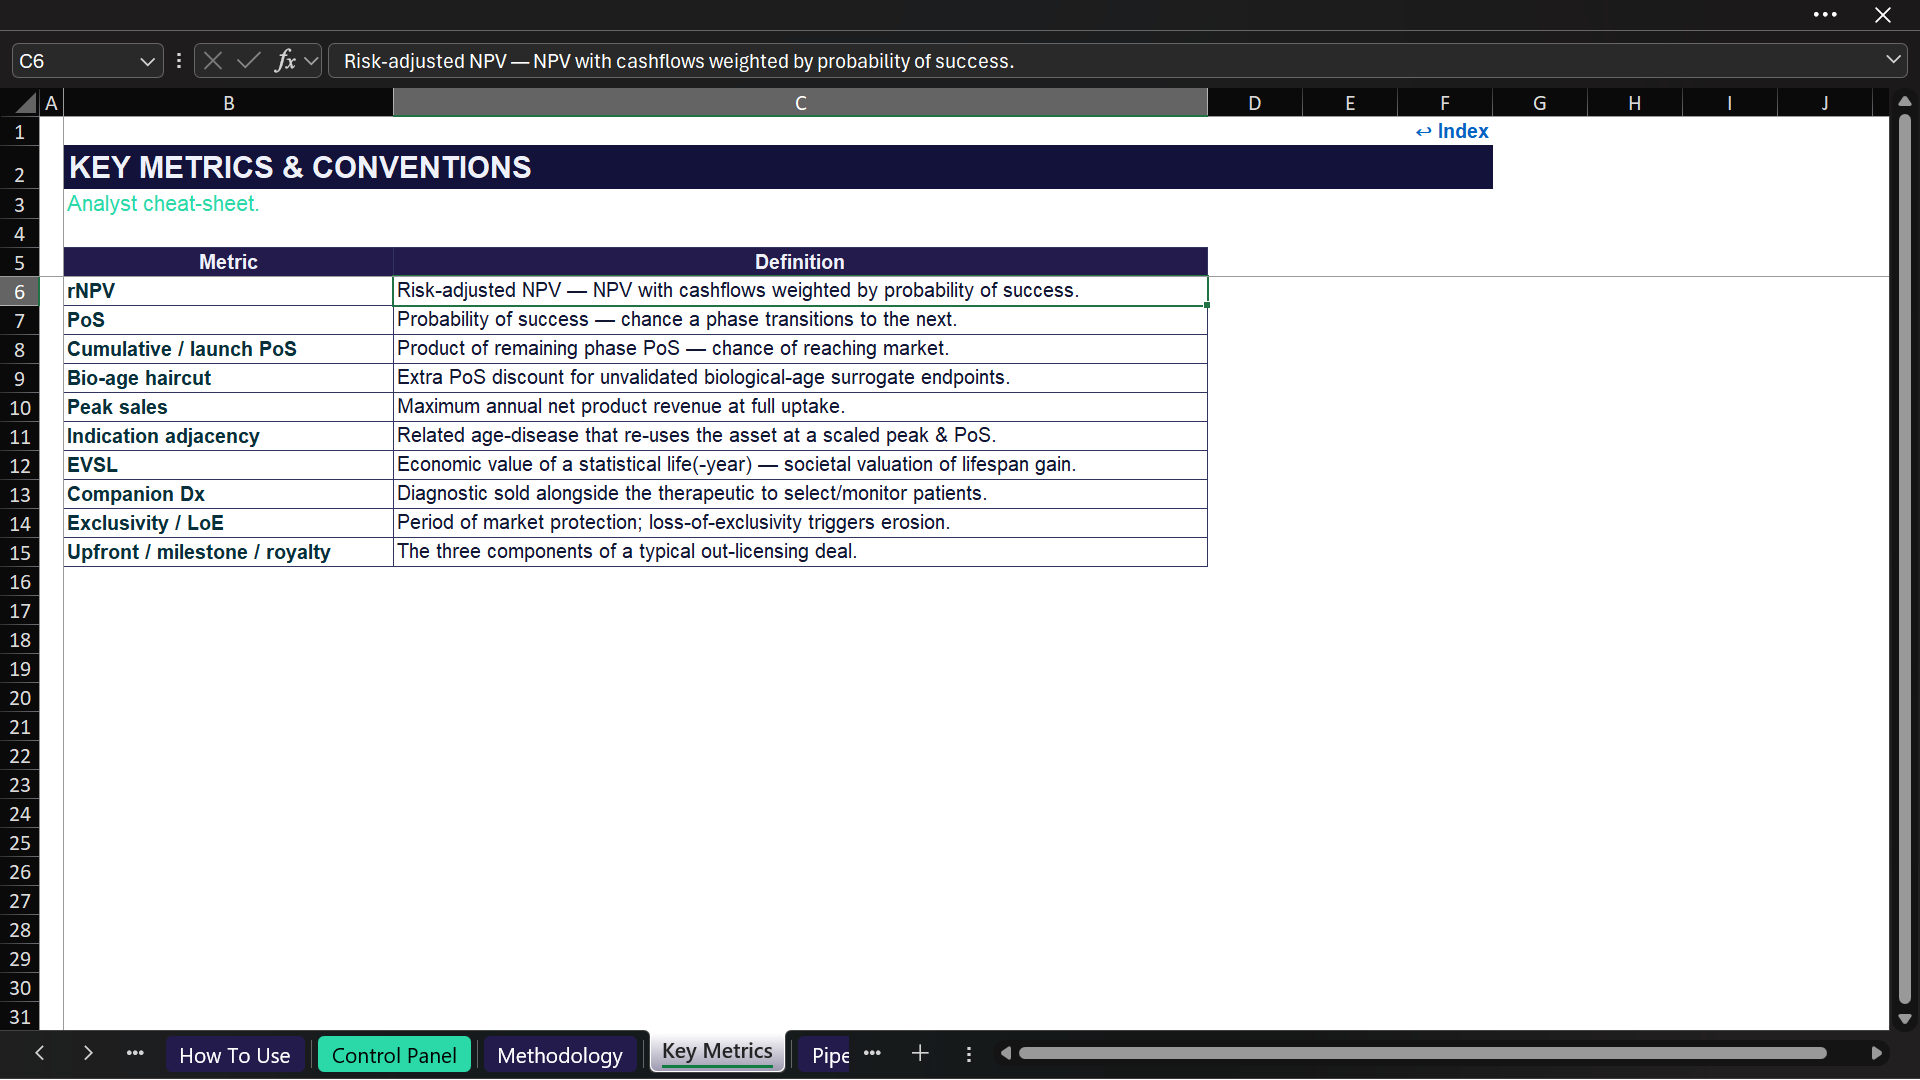
  • How does a biological-age surrogate endpoint haircut affect cumulative probability of launch?
  • What is the value difference between full development and an out-licensing / partner strategy?
  • How do eligible population, penetration, price, uptake, exclusivity, and erosion affect therapeutic economics?
  • What incremental economics may come from a companion diagnostic or recurring subscription protocol?
  • How sensitive is the valuation to probability of success, peak sales, pricing, penetration, development cost, WACC, subscription assumptions, and the bio-age haircut?
  • What is the illustrative societal value of lifespan extension, and how does that compare with modeled price?

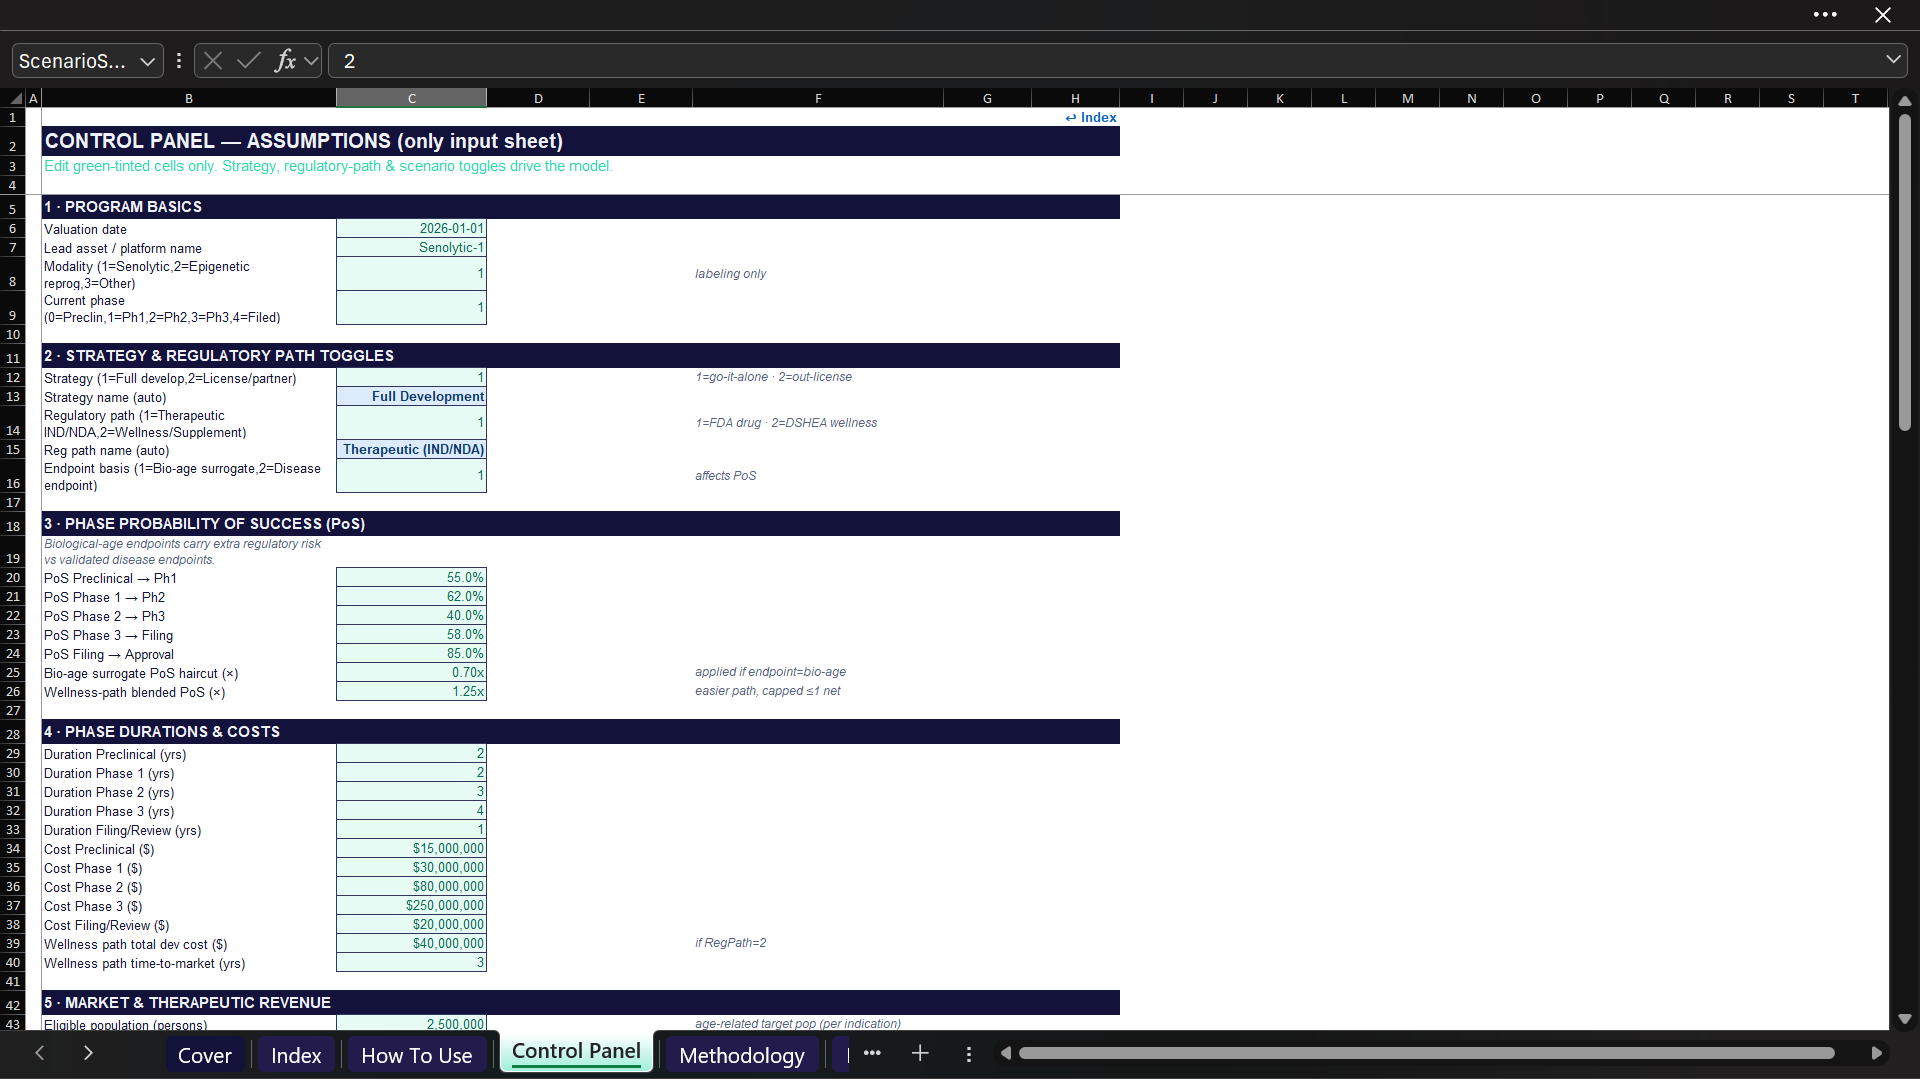
โš™๏ธ CENTRALIZED CONTROL PANEL
The workbook uses one main input sheet for the assumptions that drive the analysis. Key controls include:
  • Valuation date, asset / platform name, modality, and current development phase.
  • Strategy selector: Full Development or License / Partner.
  • Regulatory-path selector: Therapeutic IND/NDA or Wellness / Supplement.
  • Endpoint basis: biological-age surrogate or validated disease endpoint.
  • Phase transition probabilities from preclinical through approval.
  • Biological-age surrogate probability haircut and wellness-path probability multiplier.
  • Development phase durations and phase costs.
  • Eligible population, peak penetration, annual net price, uptake period, adherence, exclusivity, post-loss-of-exclusivity erosion, COGS, and commercial SG&A.
  • Five indication-adjacency assumptions with peak-sales multipliers, probability adjustments, and launch lags.
  • Companion-diagnostic toggle, price, test frequency, attach rate, and gross margin.
  • Subscription-protocol toggle, price, starting members, growth, saturation cap, churn, gross margin, and availability timing.
  • Licensing terms including upfront payment, milestones, milestone realization probability, royalty rate, and transaction timing.
  • Discount rate, tax rate, 20-year horizon, fully diluted shares, and Bear / Base / Bull scenario multipliers.

๐Ÿงช PHASE PROBABILITY-OF-SUCCESS TREE
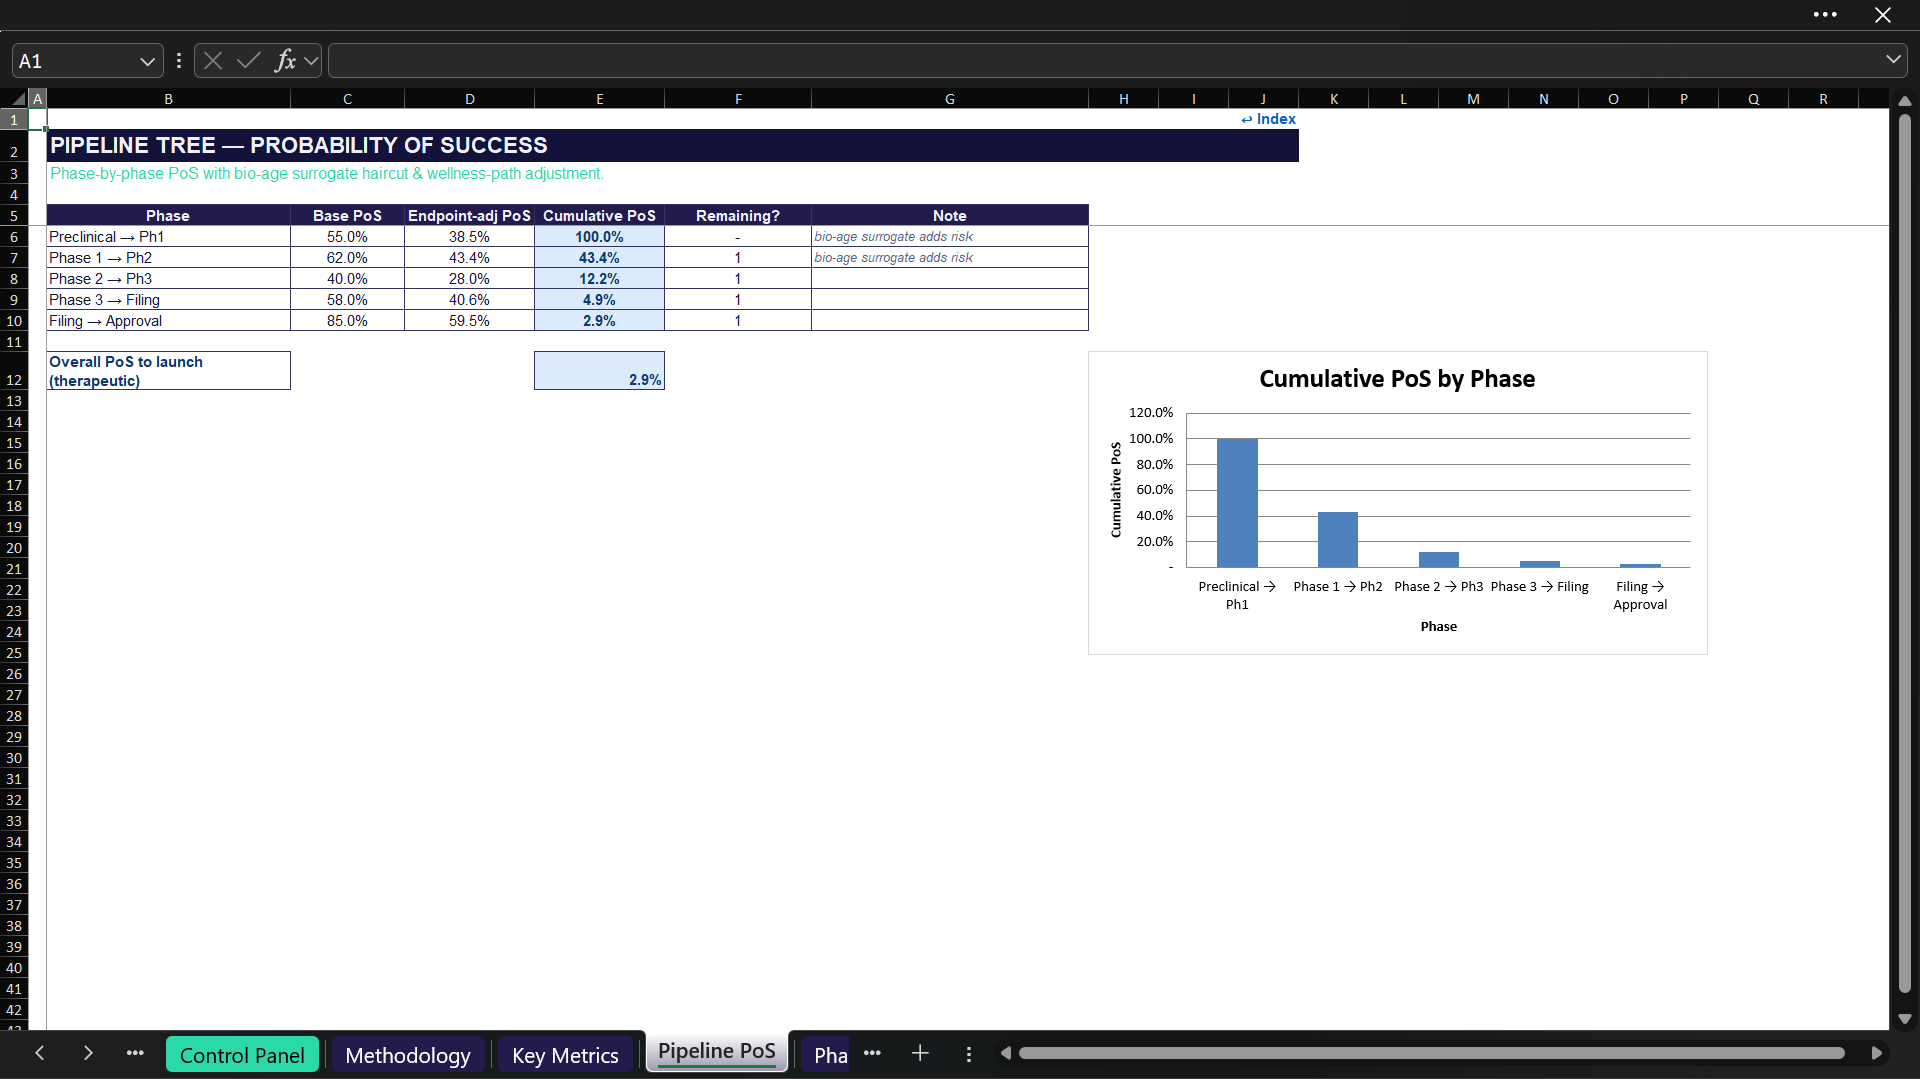
The Pipeline PoS module calculates phase-by-phase and cumulative probability of success. It adjusts the base transition probabilities for the selected endpoint basis and regulatory path, and it only includes the remaining phases based on the current development stage.
For a biological-age surrogate endpoint, the model applies the user-defined haircut to reflect additional uncertainty. For the alternative wellness / supplement path, the model applies the selected blended PoS multiplier, capped so adjusted phase probabilities do not exceed 100%.
The output is an overall launch probability that flows into the risk adjustment applied to therapeutic and companion-diagnostic economics.

๐Ÿ’ฐ DEVELOPMENT COST & TIMING SCHEDULE
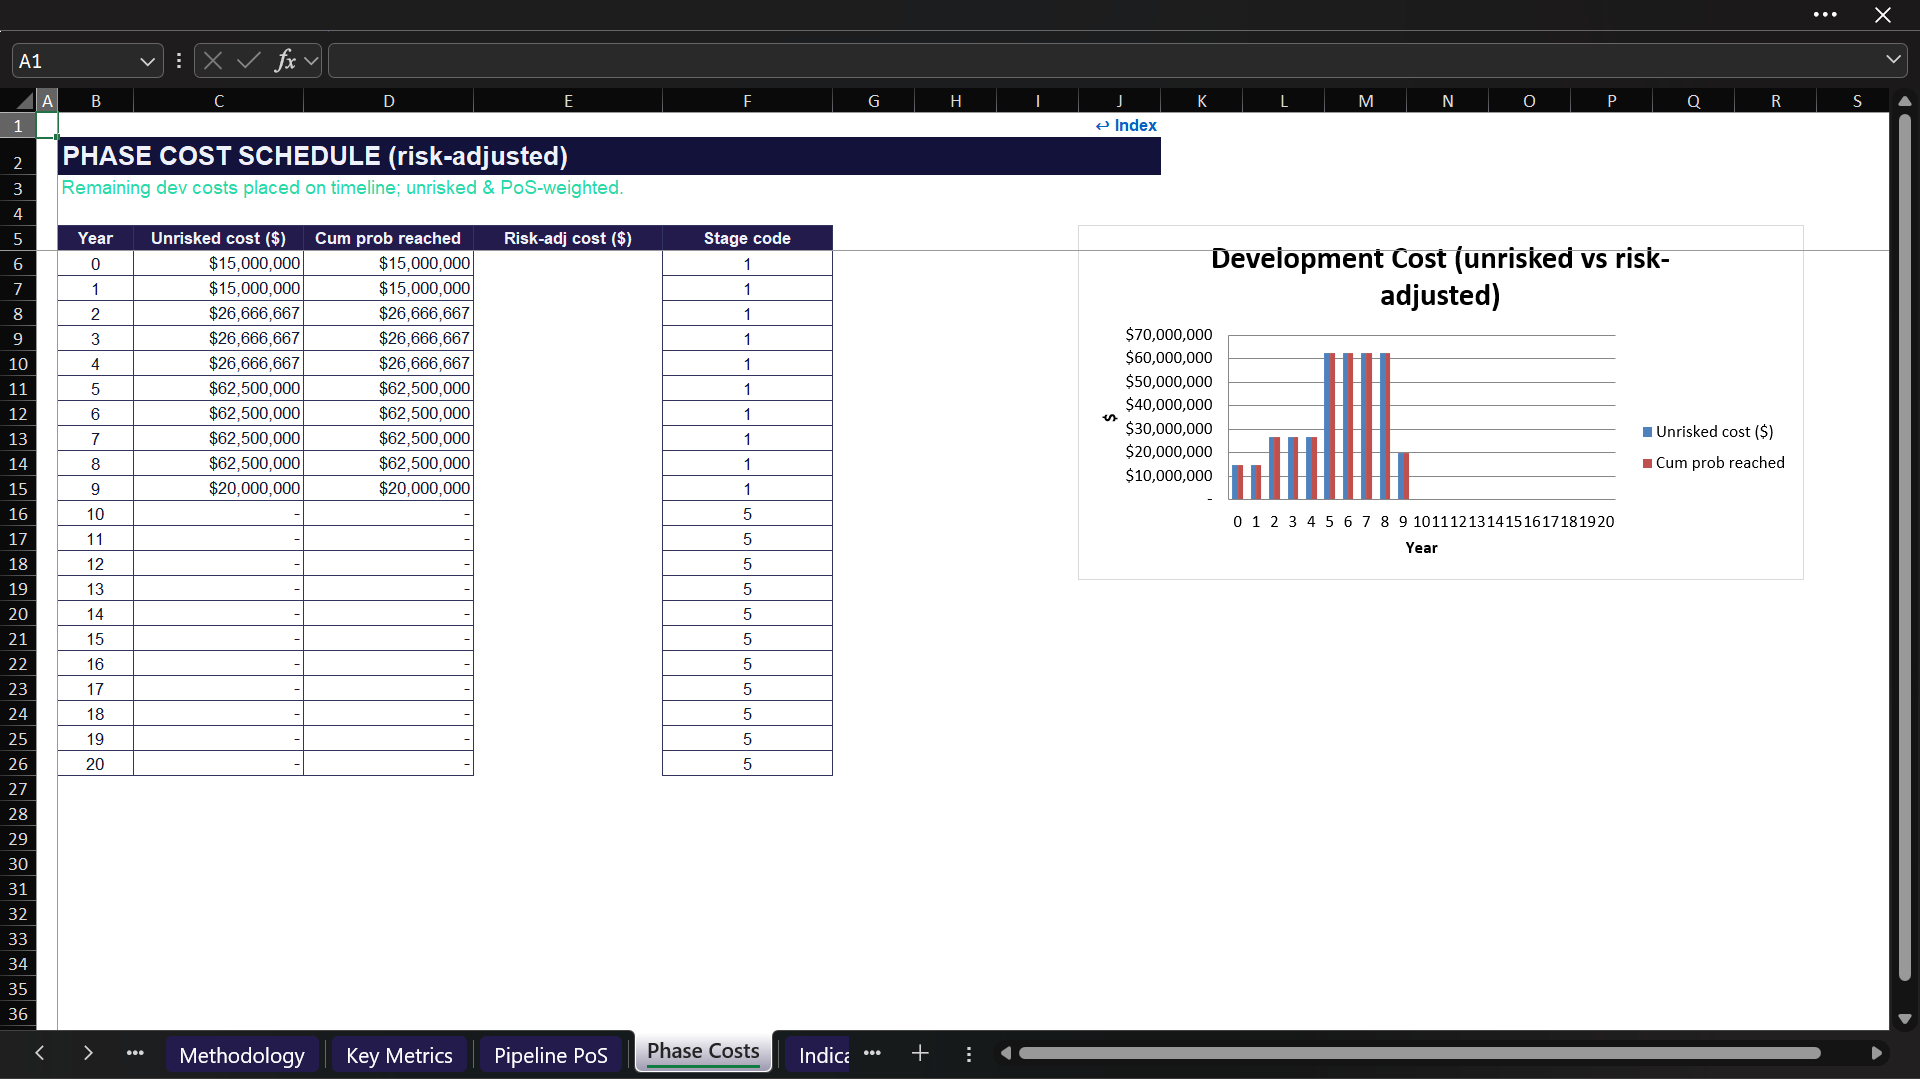
The Phase Costs and Timeline modules place remaining development spending across the annual model horizon based on the selected current phase, phase durations, regulatory path, and scenario cost multiplier.
The workbook includes a fixed annual Y0โ€“Y20 timeline, corresponding to a 20-year model horizon plus the valuation-year period. The Timeline sheet also calculates calendar years, development-stage codes, launch status, years to launch, and annual discount factors.

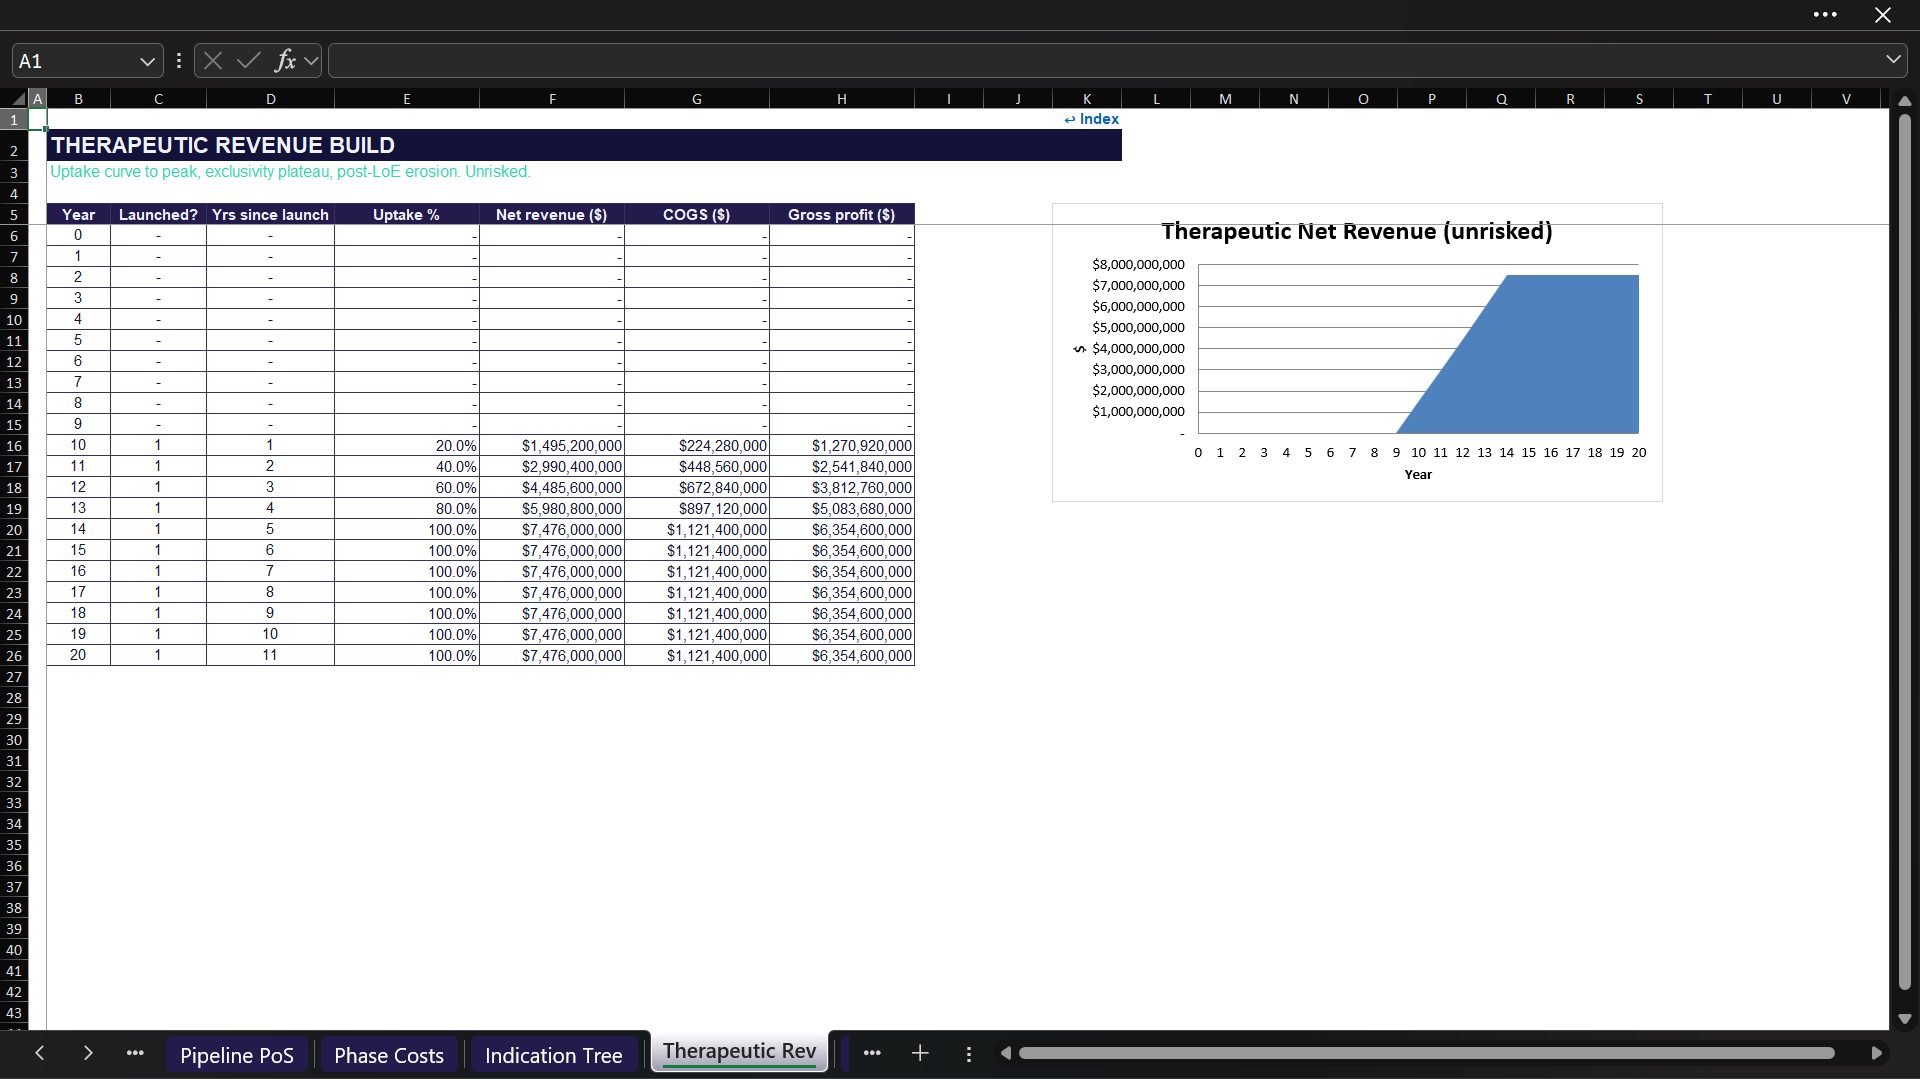
๐Ÿ“ˆ THERAPEUTIC REVENUE BUILD
Therapeutic revenue is modeled from the commercial assumptions and the indication tree. The workbook calculates:
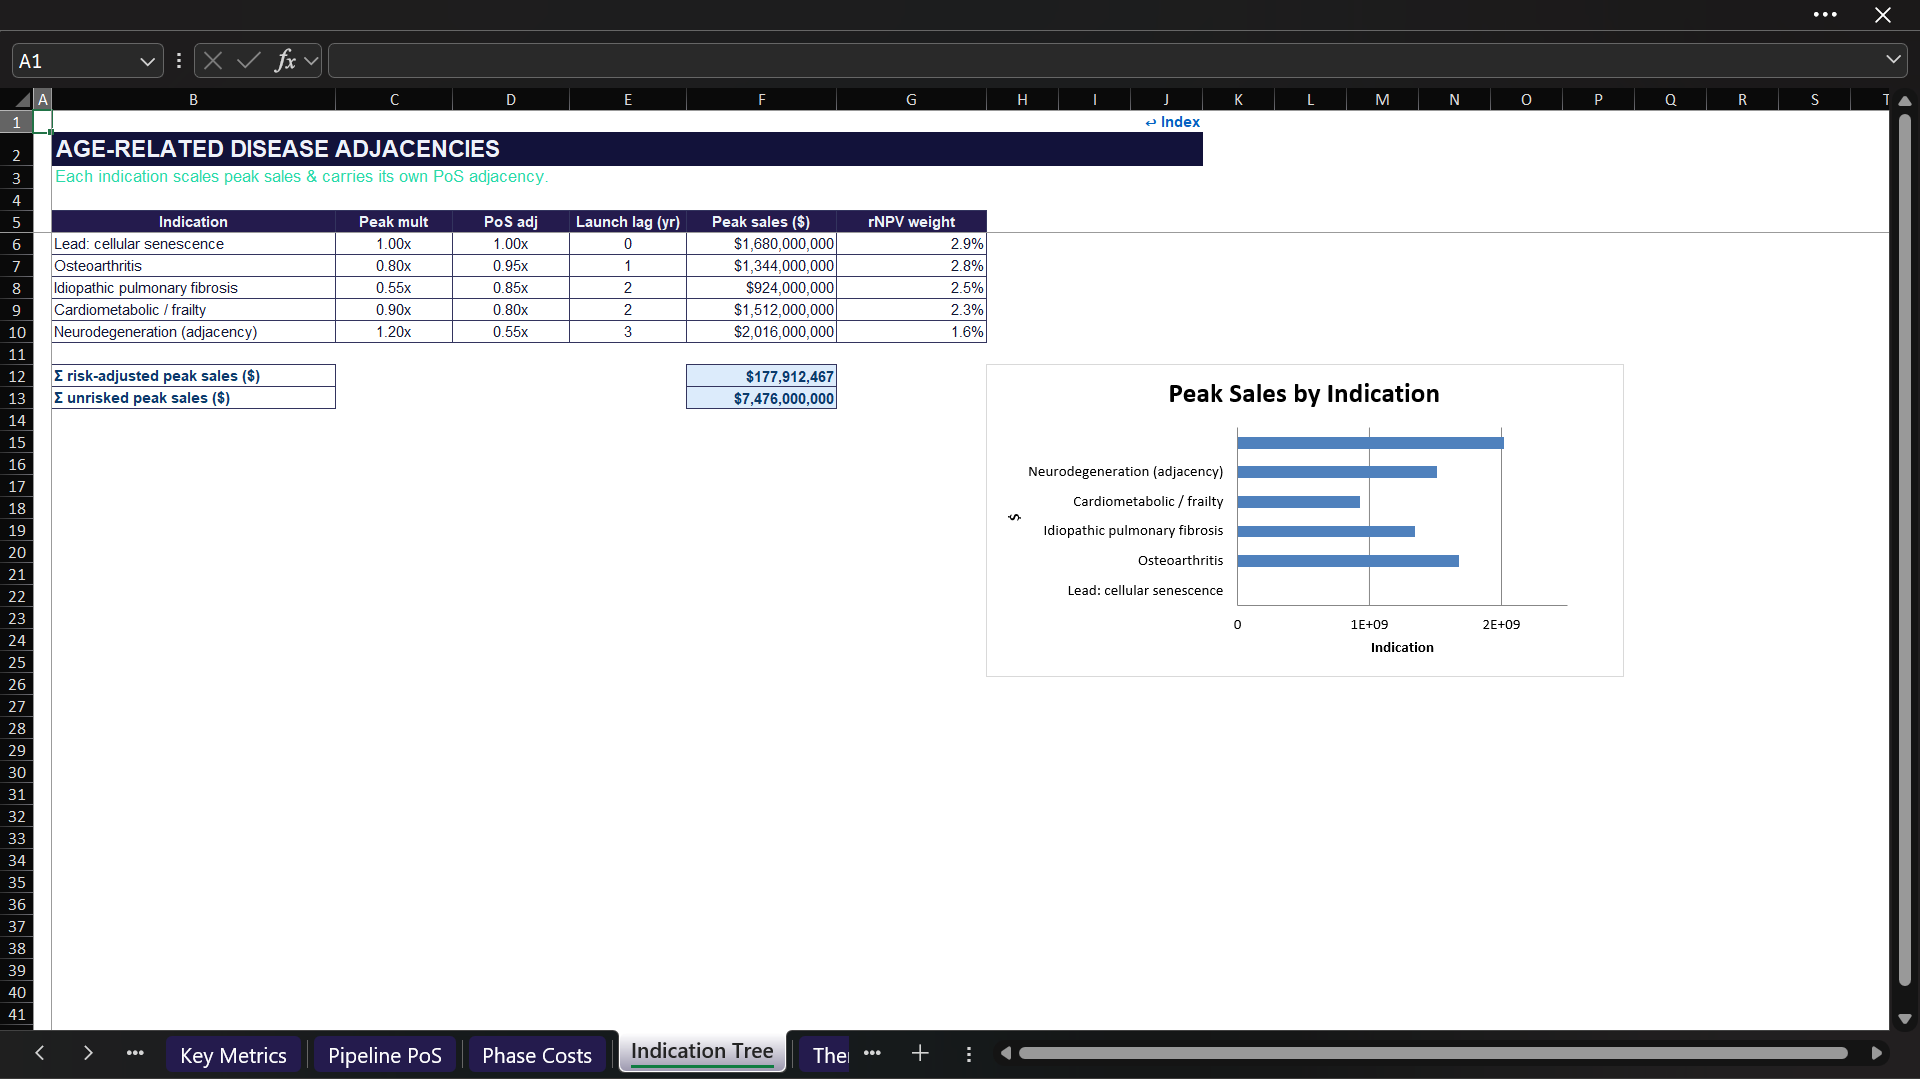
  • Peak sales for each of five age-related disease indications.
  • Risk-adjusted and unrisked aggregate peak sales.
  • Launch timing and indication-specific launch lags.
  • Uptake from launch to peak over the selected ramp period.
  • Revenue through the exclusivity period.
  • Post-loss-of-exclusivity erosion using the user-defined erosion rate.
  • COGS and therapeutic gross profit.
  • Commercial SG&A used in the rNPV engine.
The five built-in indications are a lead cellular-senescence program plus osteoarthritis, idiopathic pulmonary fibrosis, cardiometabolic / frailty, and a neurodegeneration adjacency. These labels and assumptions are illustrative and can be replaced through the Control Panel for another longevity platform.

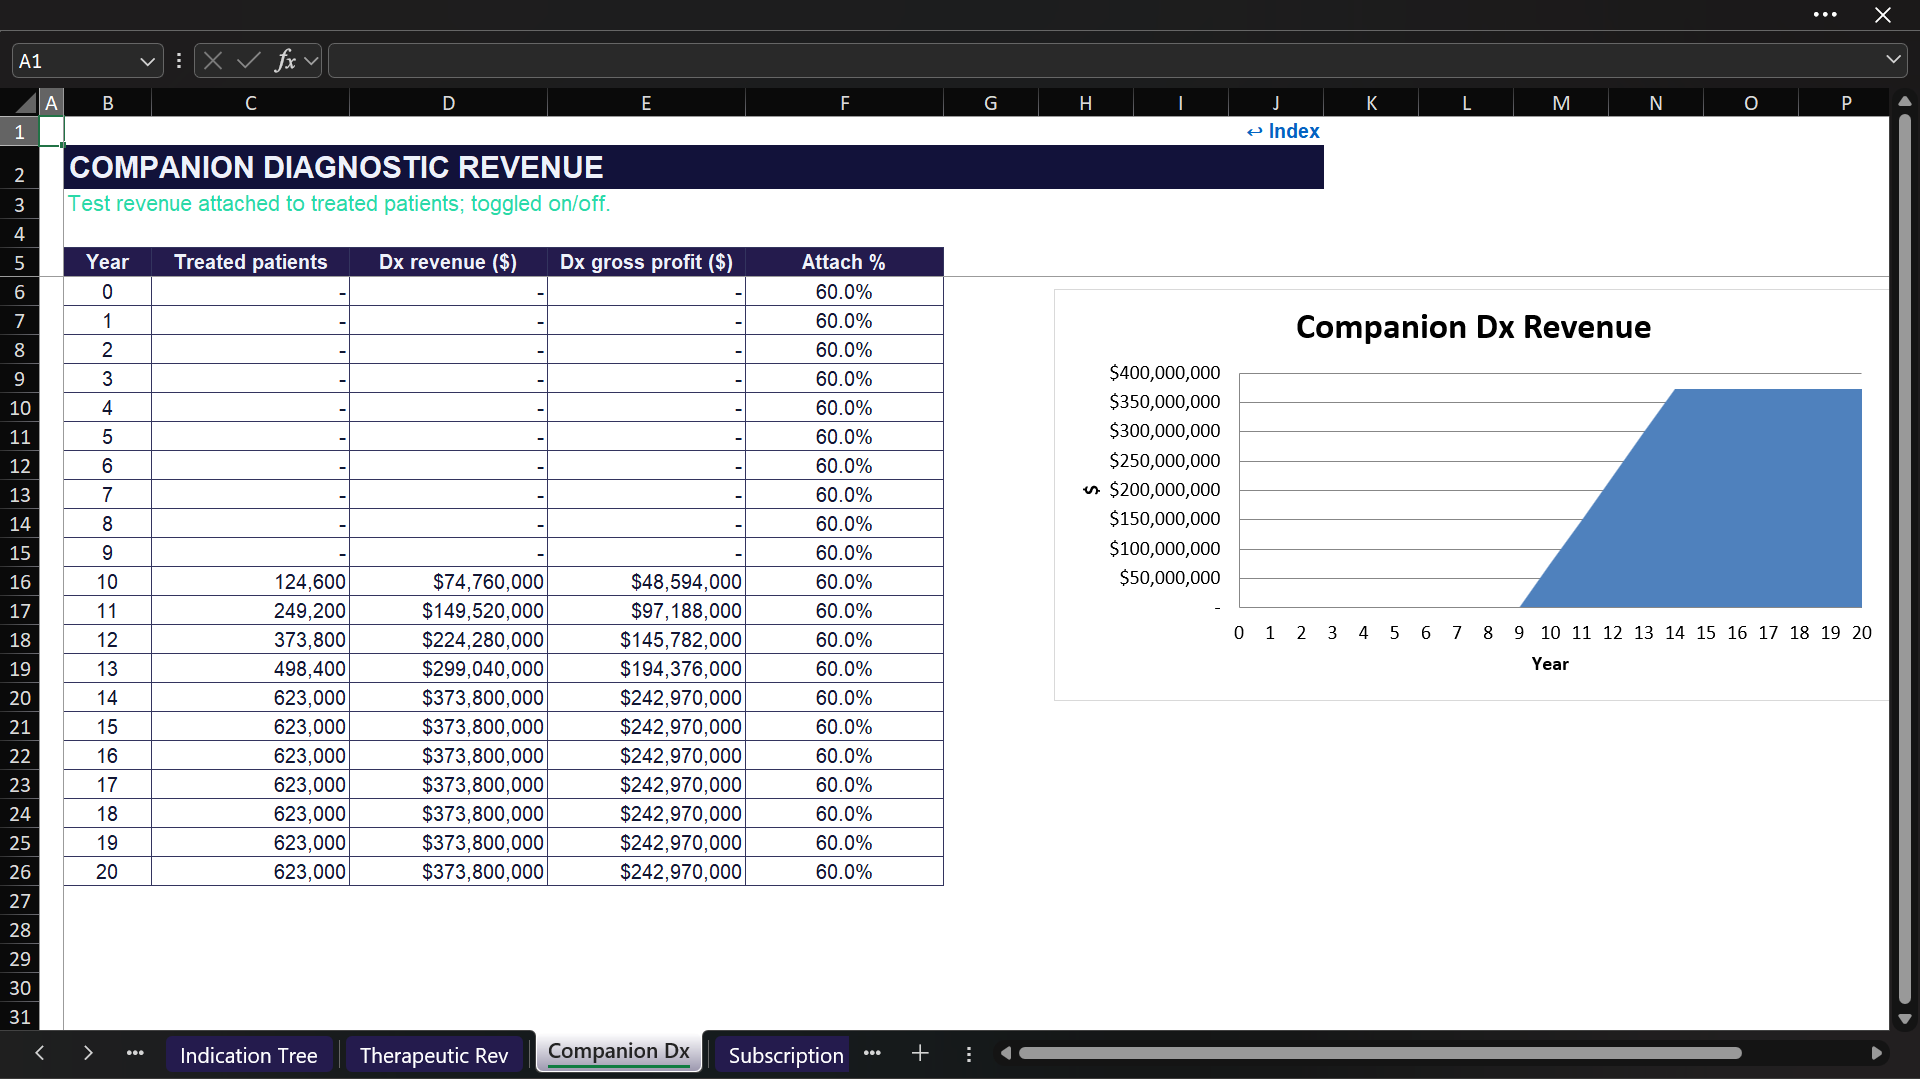
๐Ÿงฌ COMPANION DIAGNOSTIC MODULE
The Companion Dx module is a separate revenue and gross-profit build that can be switched on or off. It estimates treated patients from the therapeutic revenue framework and applies the diagnostic price, annual testing frequency, attach rate, and gross margin.
This allows the buyer to assess a therapy-plus-diagnostic business model without mixing diagnostic assumptions directly into the therapeutic revenue build.

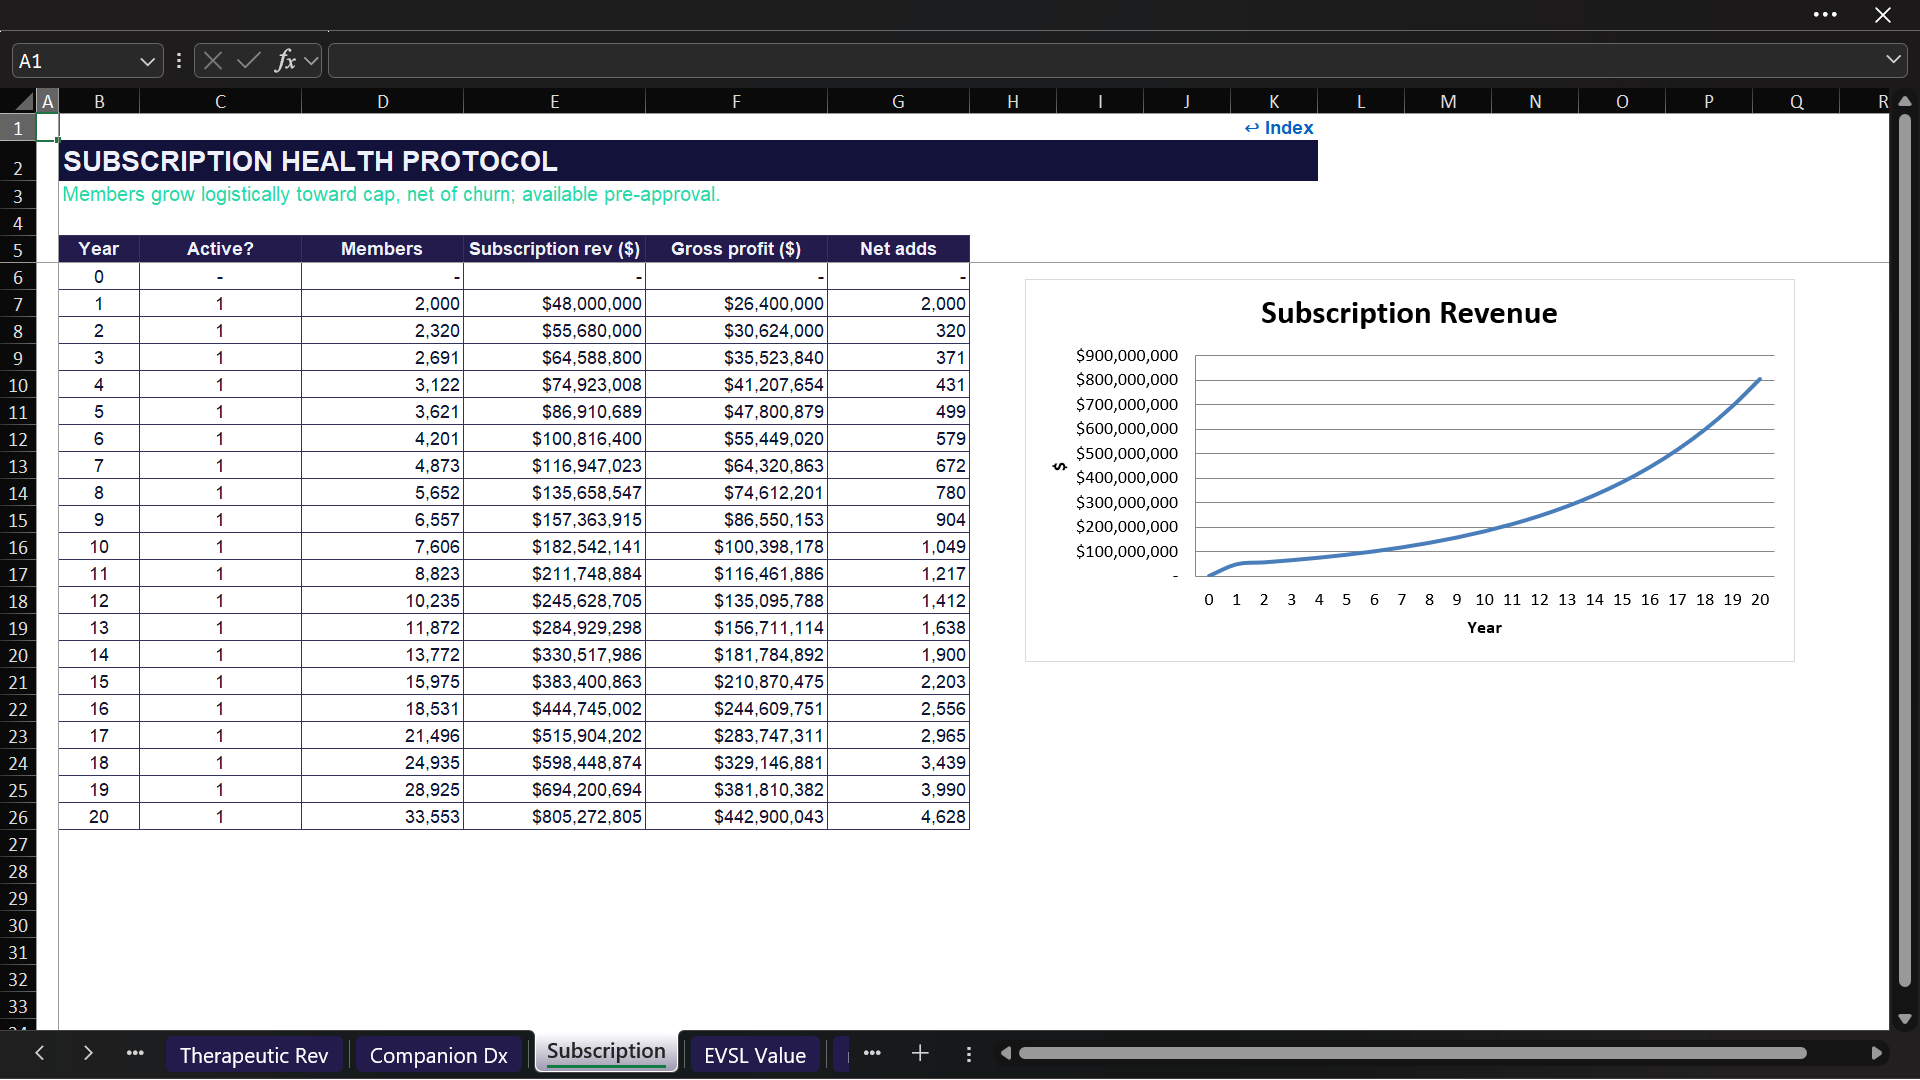
๐Ÿ”„ SUBSCRIPTION HEALTH-PROTOCOL MODULE
The model also includes an optional recurring subscription layer intended to represent a longevity health-protocol business that may begin before therapeutic approval.
The subscription module models:
  • Starting members.
  • Annual membership price.
  • Growth scaled by the active scenario.
  • Churn.
  • Maximum member cap / saturation.
  • Gross margin.
  • Start timing.
  • Annual revenue and gross profit through Y20.
Subscription gross profit is treated separately from risk-adjusted therapeutic revenue in the rNPV engine, reflecting the model's assumption that this business can generate economics independently of drug approval when enabled.

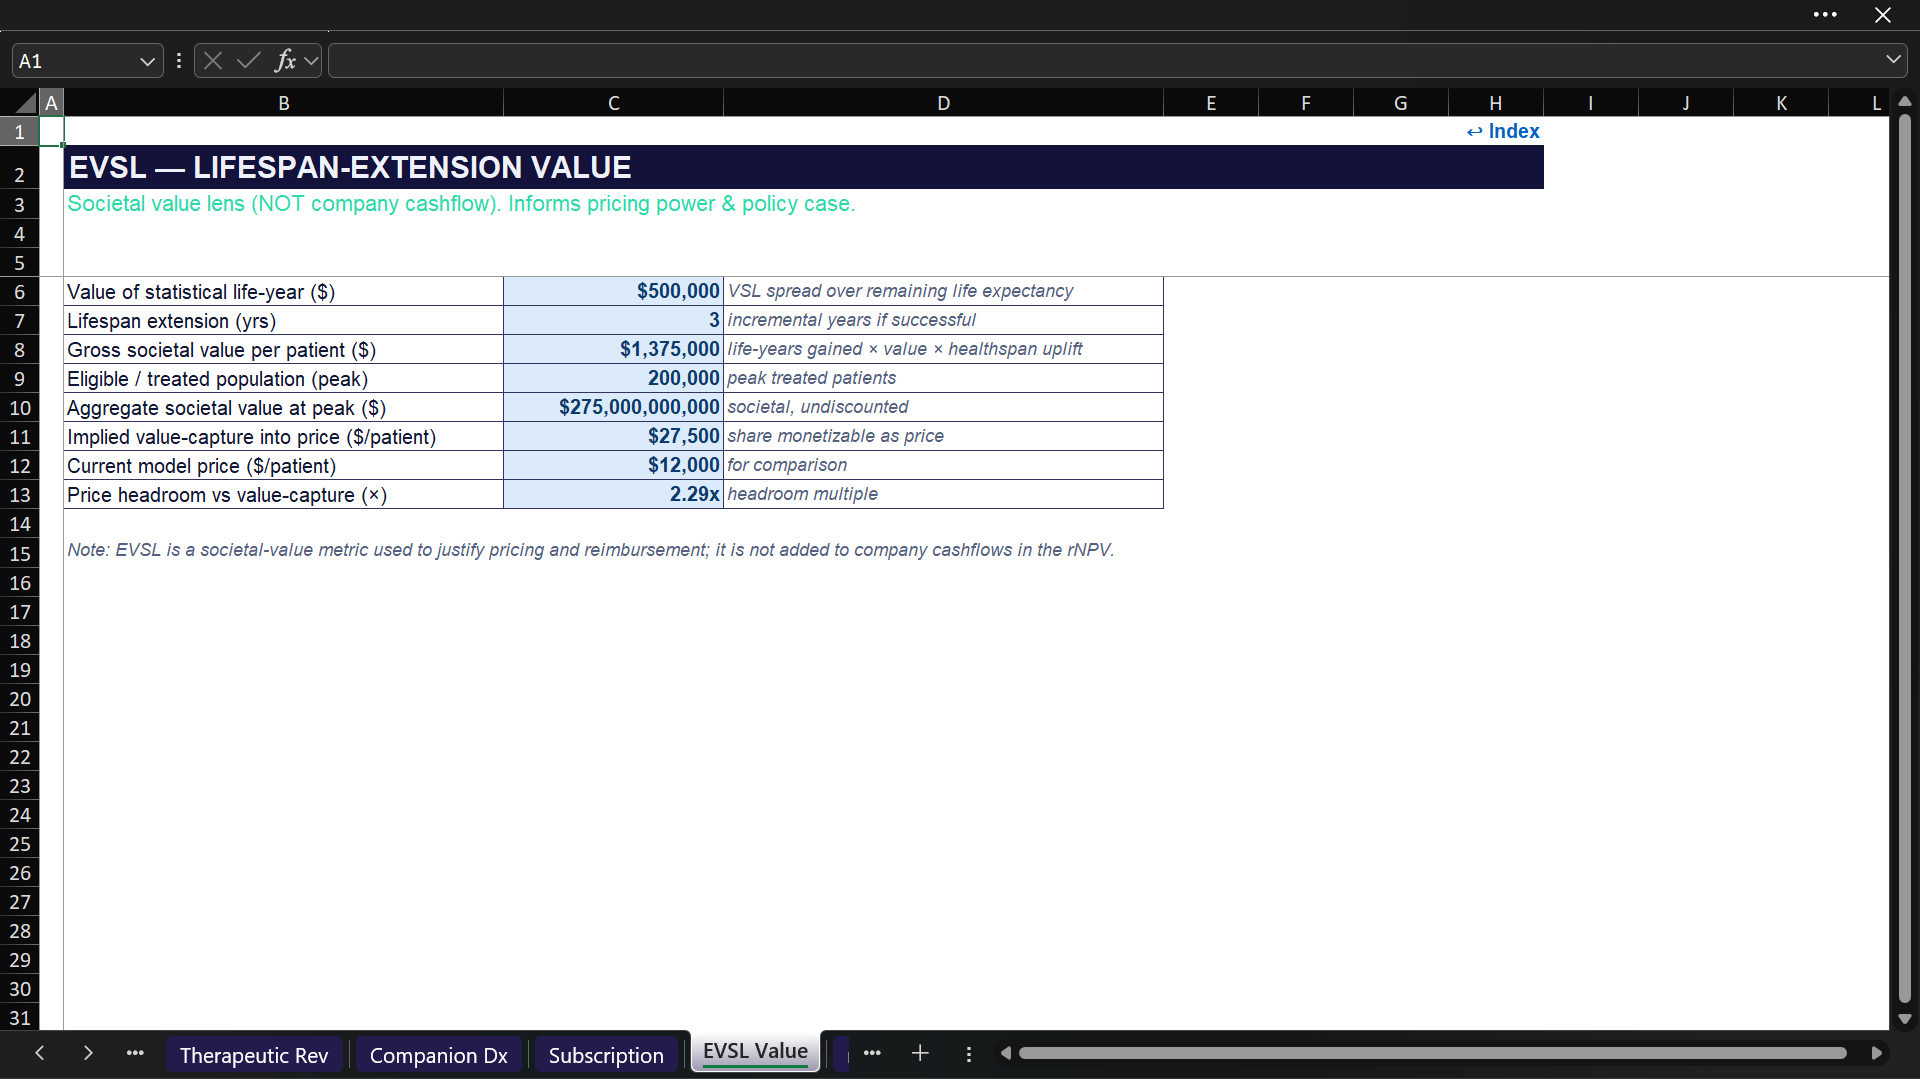
๐Ÿฅ EVSL / LIFESPAN-EXTENSION VALUE LENS
The EVSL sheet provides an illustrative societal-value framework rather than a company cash-flow forecast. It uses the selected value of statistical life, remaining life expectancy, assumed lifespan extension, quality-of-life uplift, eligible treated population, and a value-capture percentage to calculate:
  • Value of a statistical life-year.
  • Gross societal value per patient.
  • Aggregate societal value at peak penetration.
  • Implied value capture into price per patient.
  • Price headroom compared with the model's current annual net price.
This module is intentionally kept outside company cash flows. It is designed as an analytical lens for pricing, reimbursement, or policy discussions, not as additional revenue.

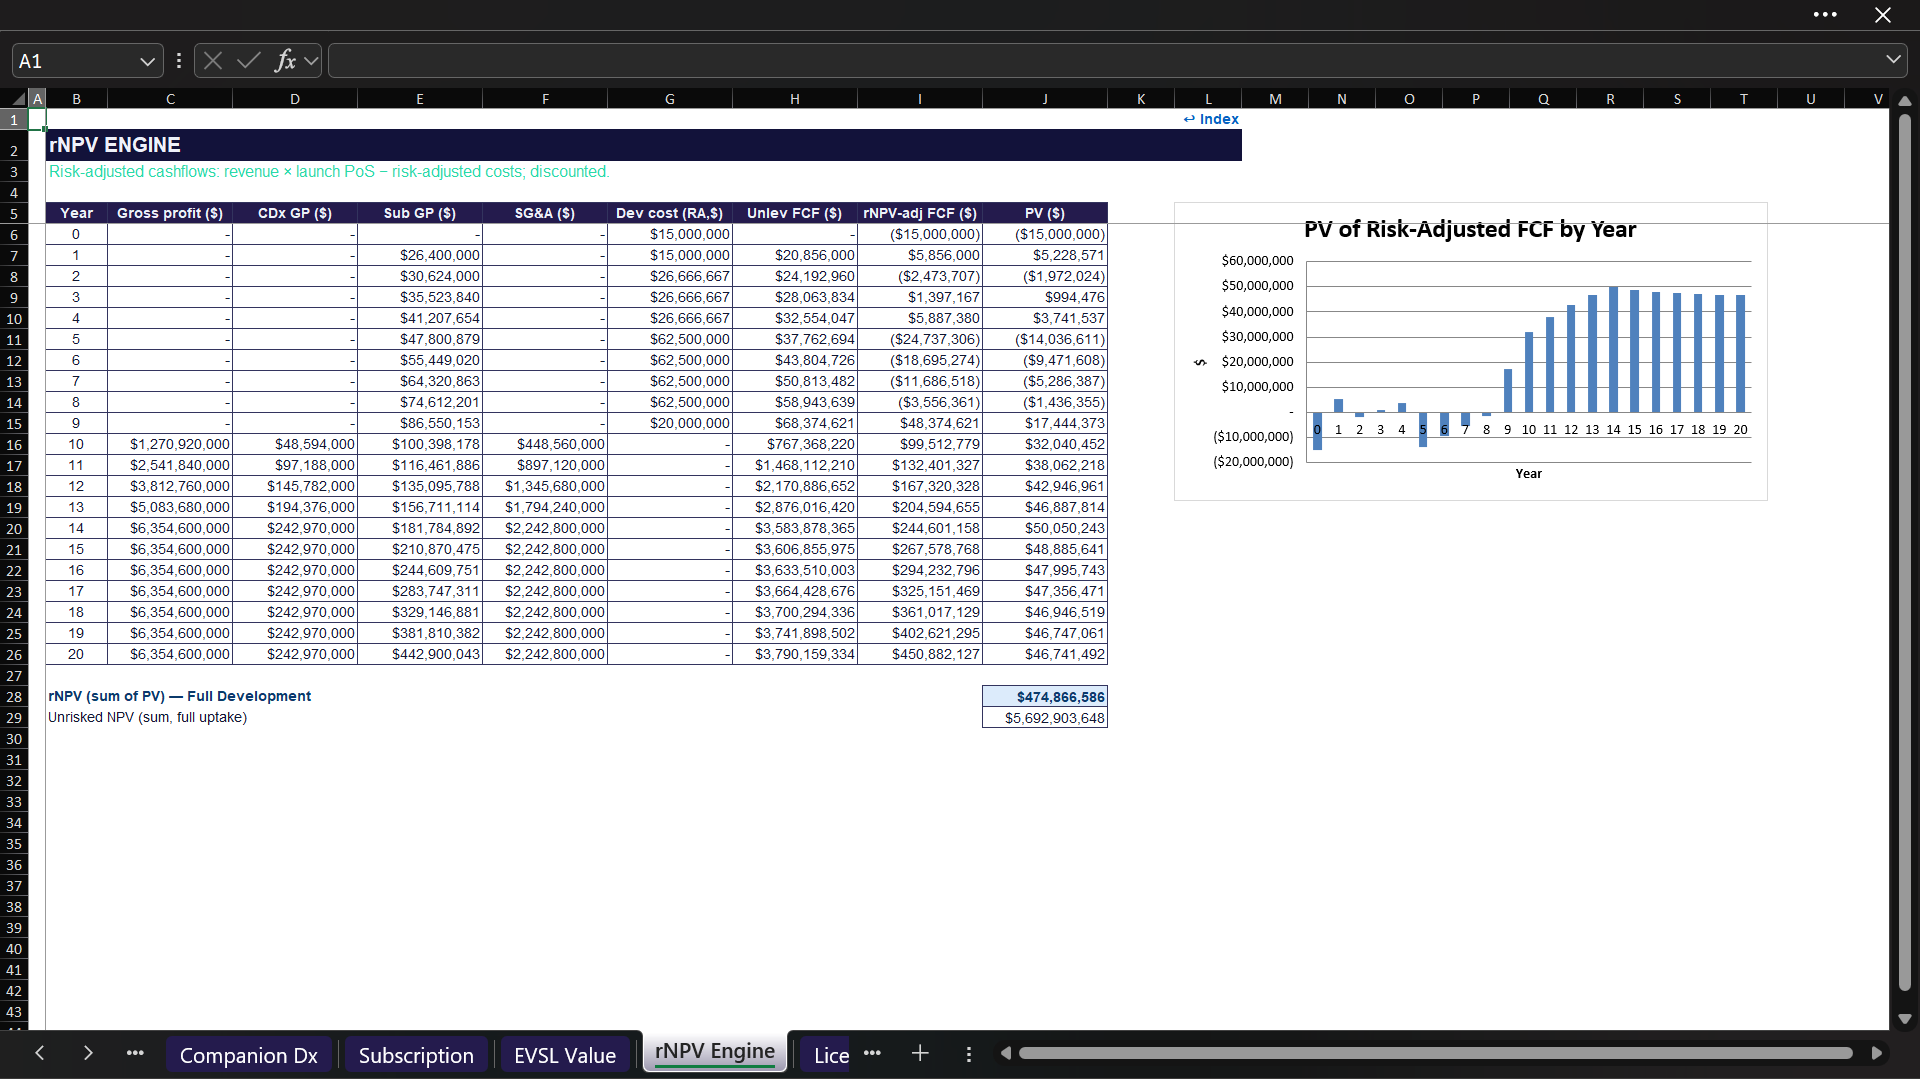
๐Ÿ“Š RISK-ADJUSTED NPV ENGINE
The rNPV Engine combines annual therapeutic gross profit, companion-diagnostic gross profit, subscription gross profit, commercial SG&A, risk-adjusted development costs, tax, probability of launch, and discount factors.
The engine calculates annual risk-adjusted free cash flow and present value over the full model horizon. It also calculates an unrisked NPV reference and the full-development rNPV.
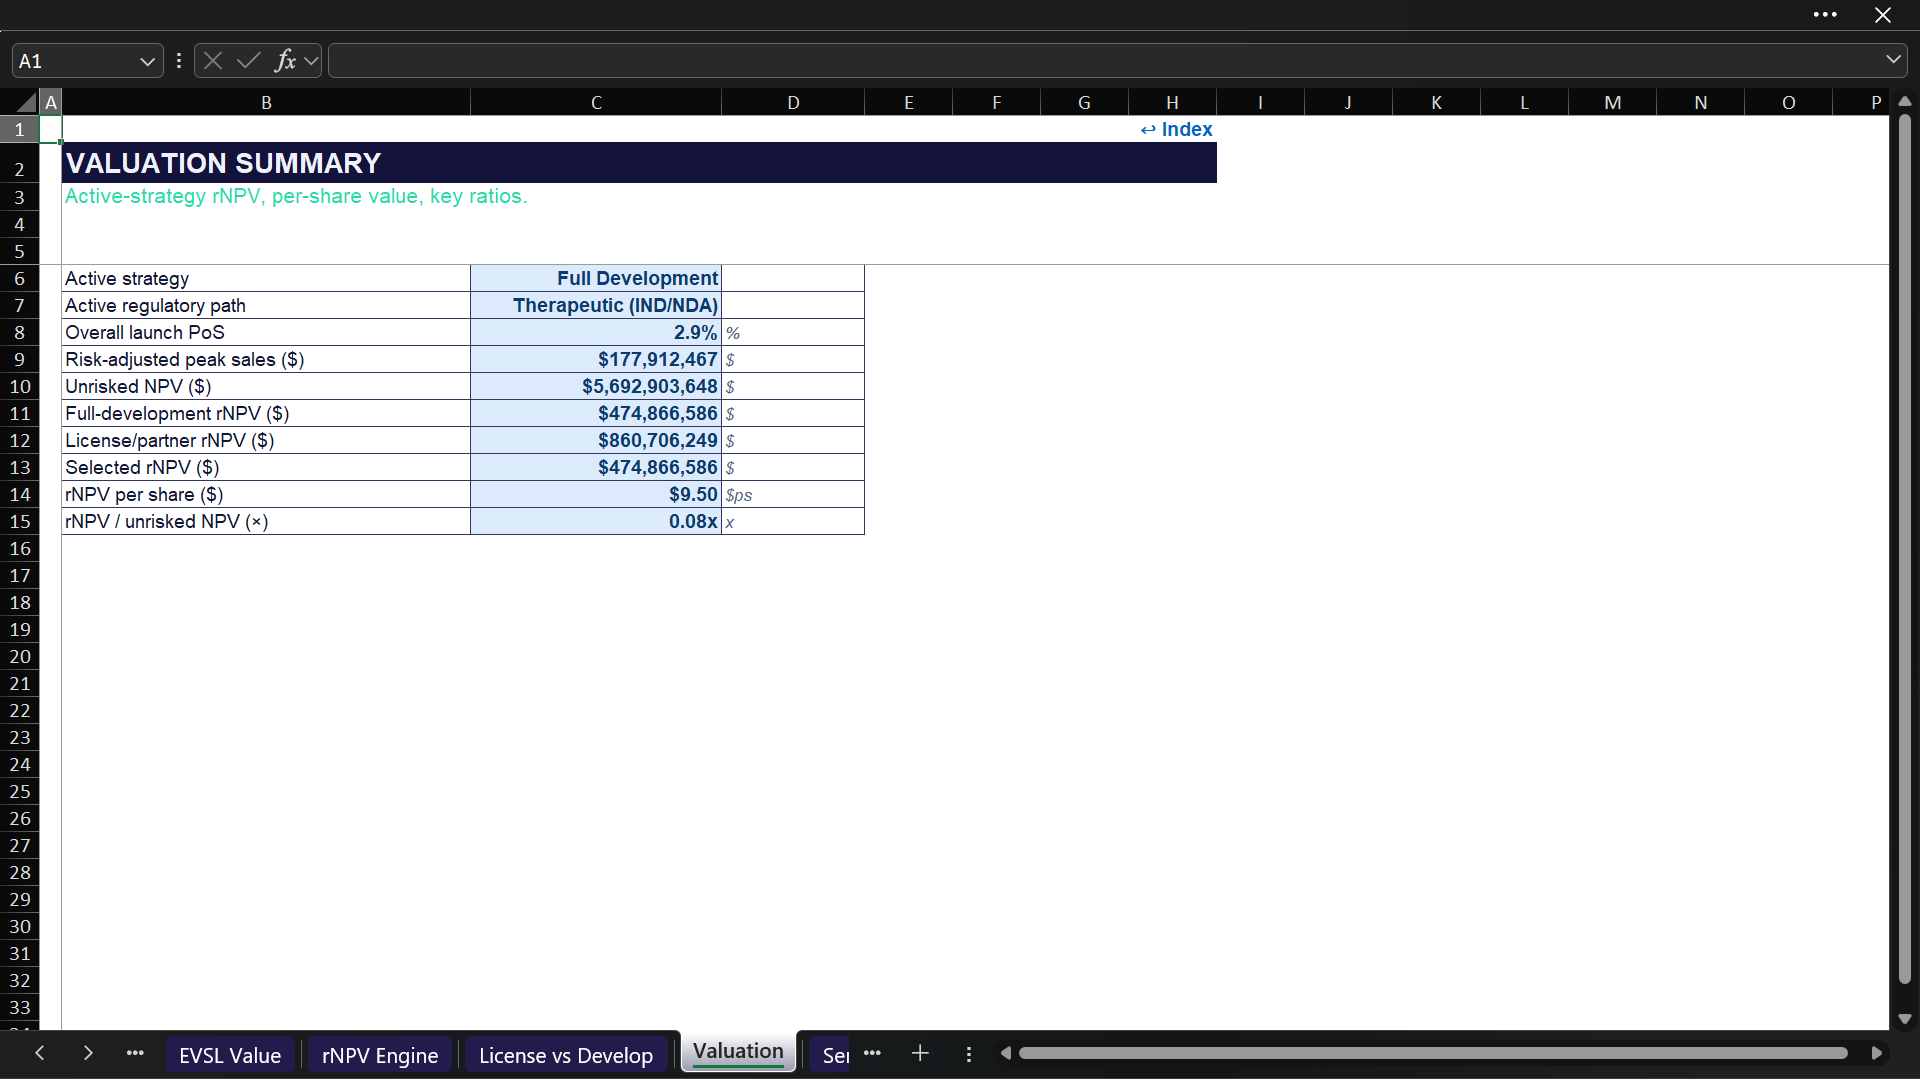
The Valuation sheet then reports:
  • Active strategy and regulatory path.
  • Overall launch probability.
  • Risk-adjusted peak sales.
  • Unrisked NPV.
  • Full-development rNPV.
  • License / partner rNPV.
  • Selected rNPV based on the strategy toggle.
  • rNPV per fully diluted share.
  • rNPV-to-unrisked-NPV ratio.

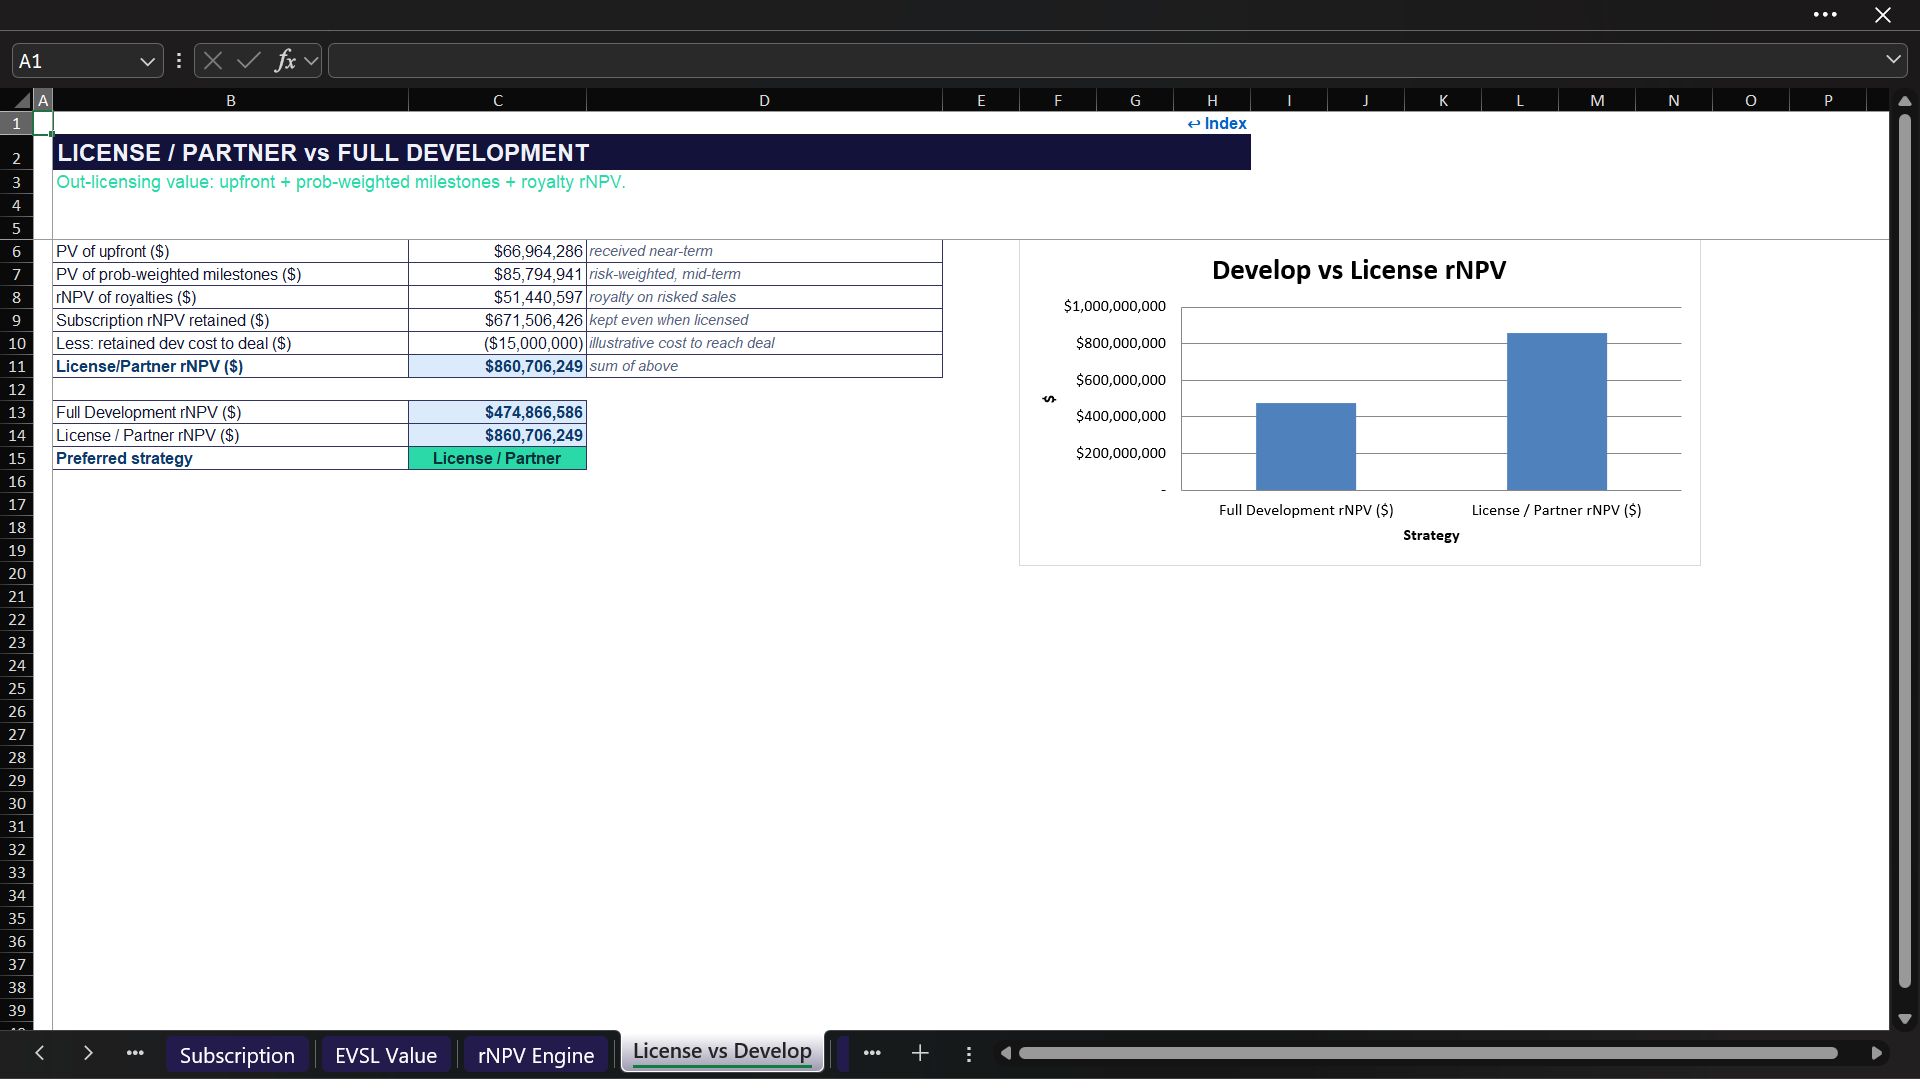
๐Ÿค LICENSE / PARTNER VS FULL DEVELOPMENT
The strategy comparison values an illustrative out-licensing route using:
  • Discounted upfront payment.
  • Probability-weighted milestone value.
  • Royalty value on risk-adjusted therapeutic sales.
  • Retained subscription rNPV.
  • Illustrative retained development cost to reach the deal.
It compares the resulting License / Partner rNPV with the Full Development rNPV and identifies the higher modeled strategy value. The separate strategy selector controls which value is ultimately shown as the selected rNPV.

๐ŸŒก๏ธ SCENARIOS & SENSITIVITY VIEWS
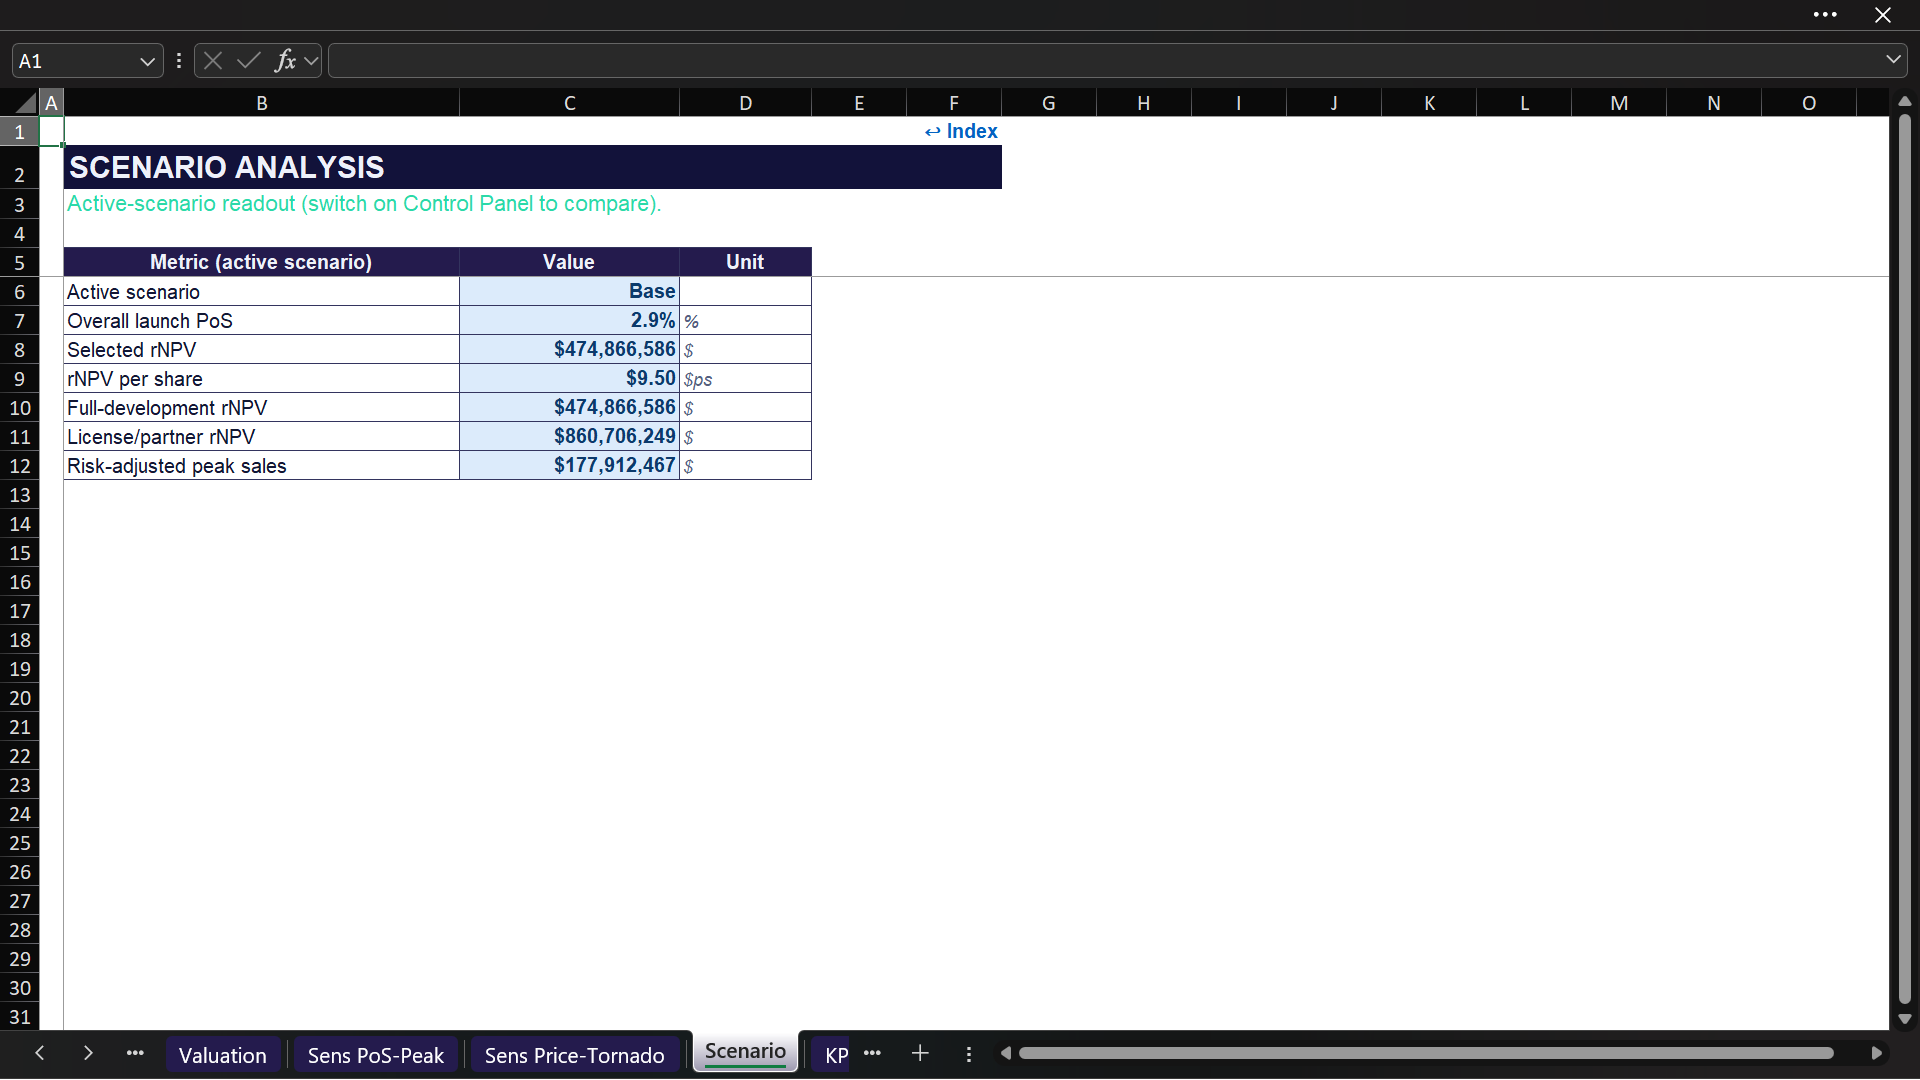
A Bear / Base / Bull selector changes key model multipliers for probability of success, peak sales, price, subscription growth, and development cost.
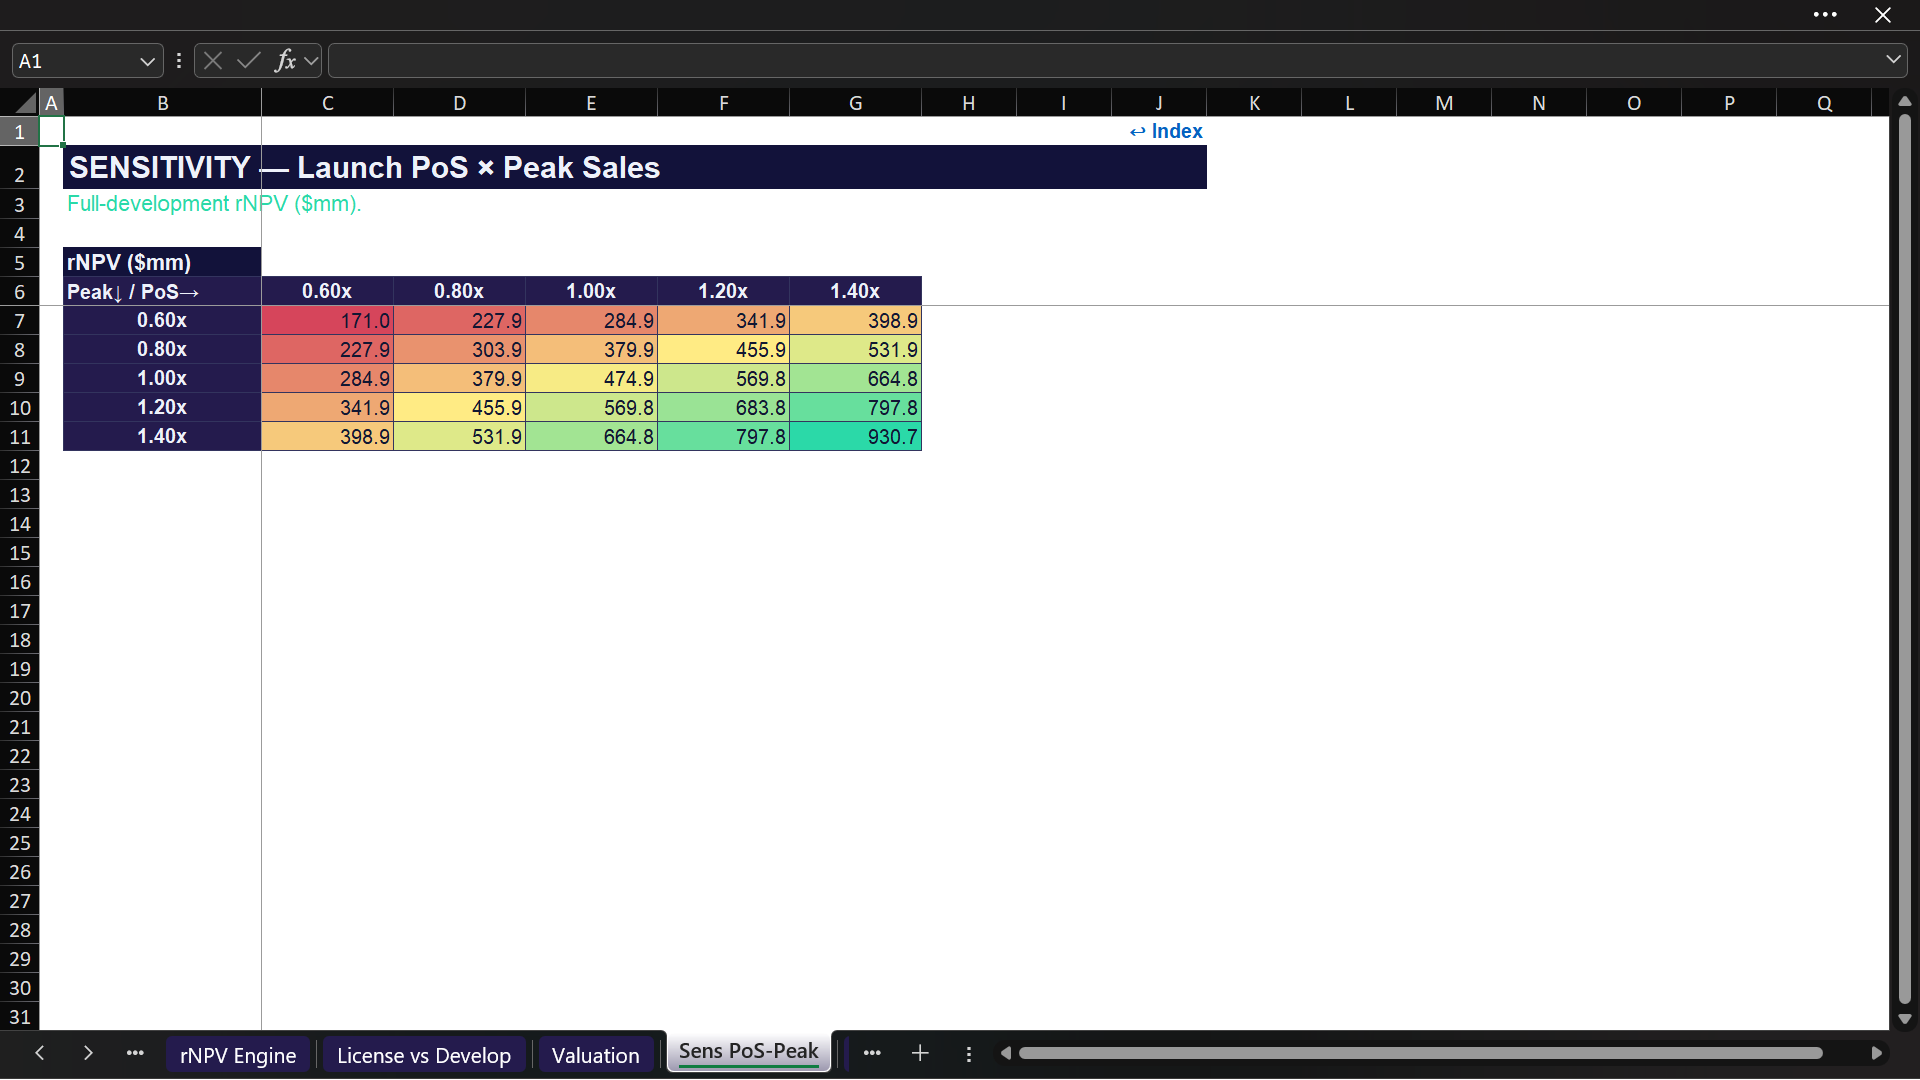
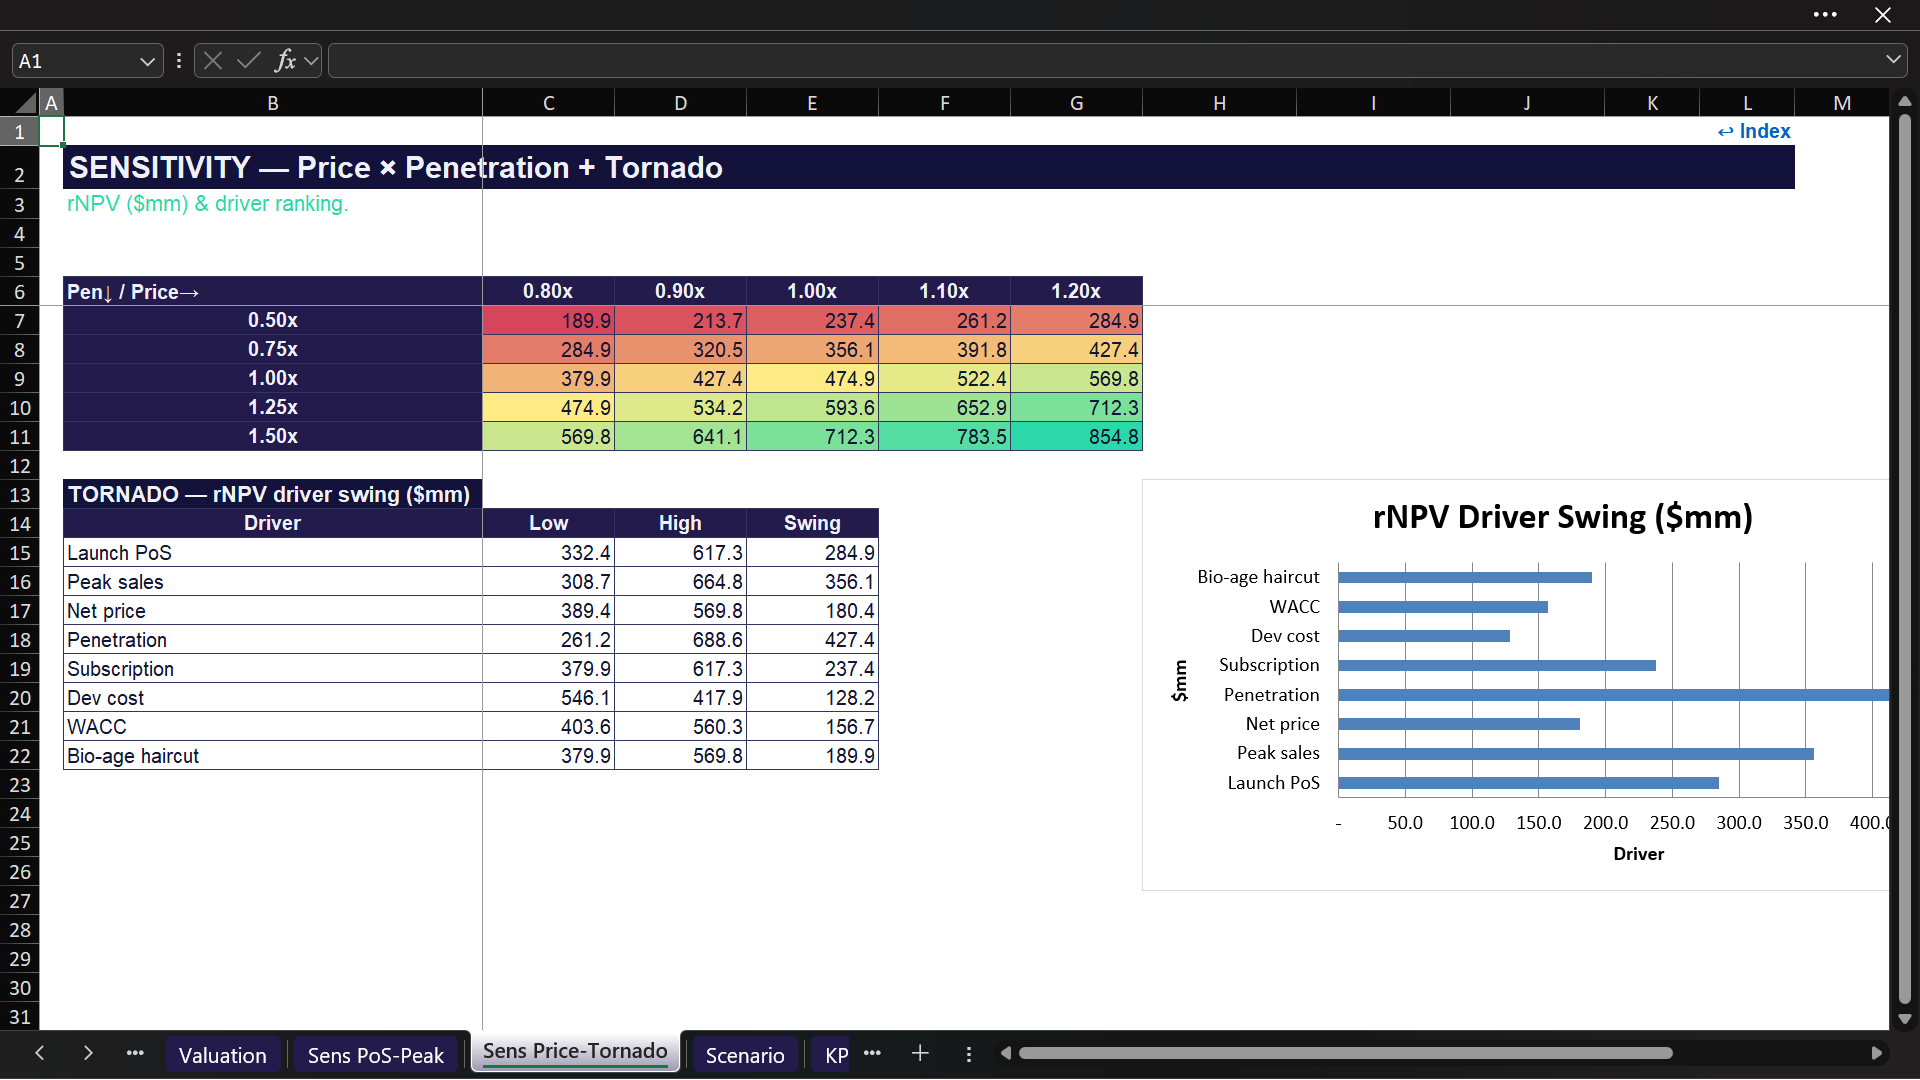
The workbook also contains two dedicated sensitivity sheets:
  • Launch PoS ร— Peak Sales grid.
  • Price ร— Penetration grid plus a tornado-style driver ranking.
These sensitivity outputs are indicative scaling analyses around the base full-development rNPV rather than Excel Data Table re-runs of every underlying model formula. They are useful for directional decision support and for seeing which assumptions can have the largest modeled impact.

๐Ÿ“‰ DASHBOARDS & DECISION-READY OUTPUTS
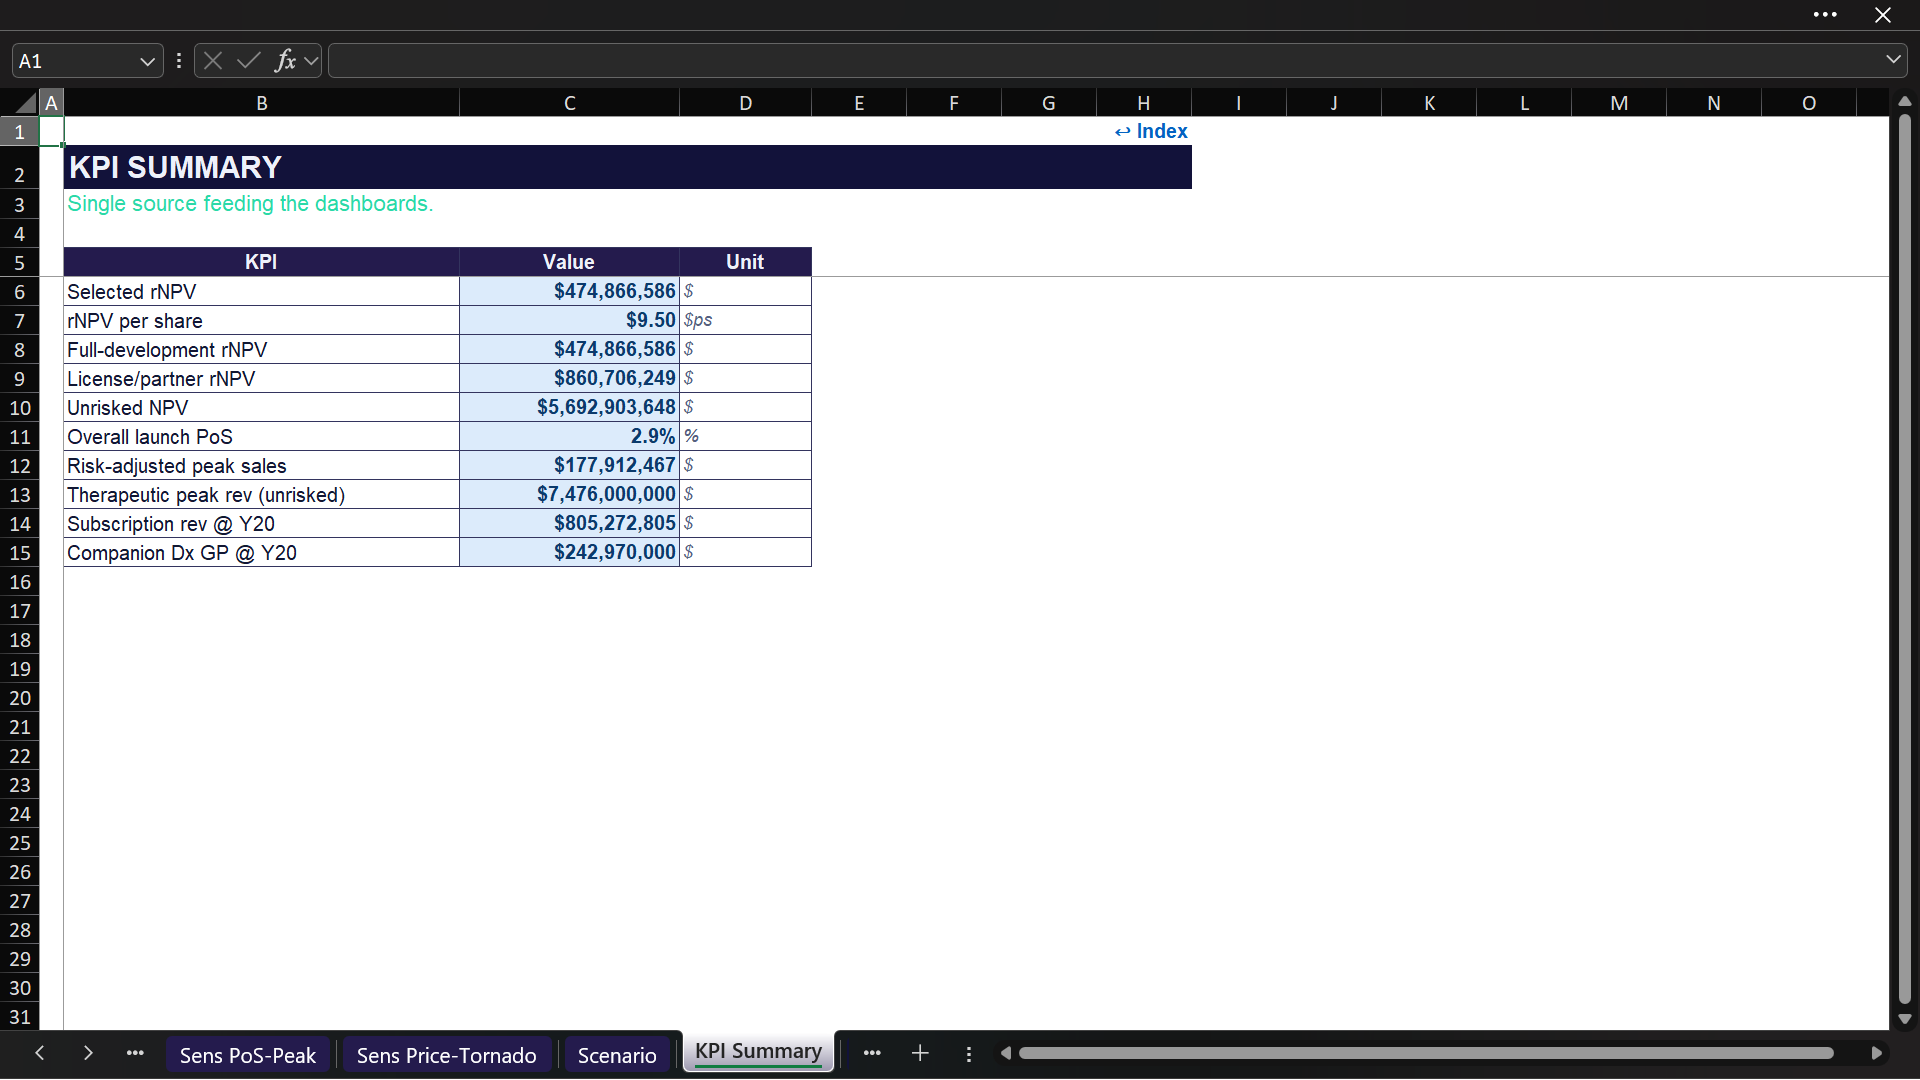
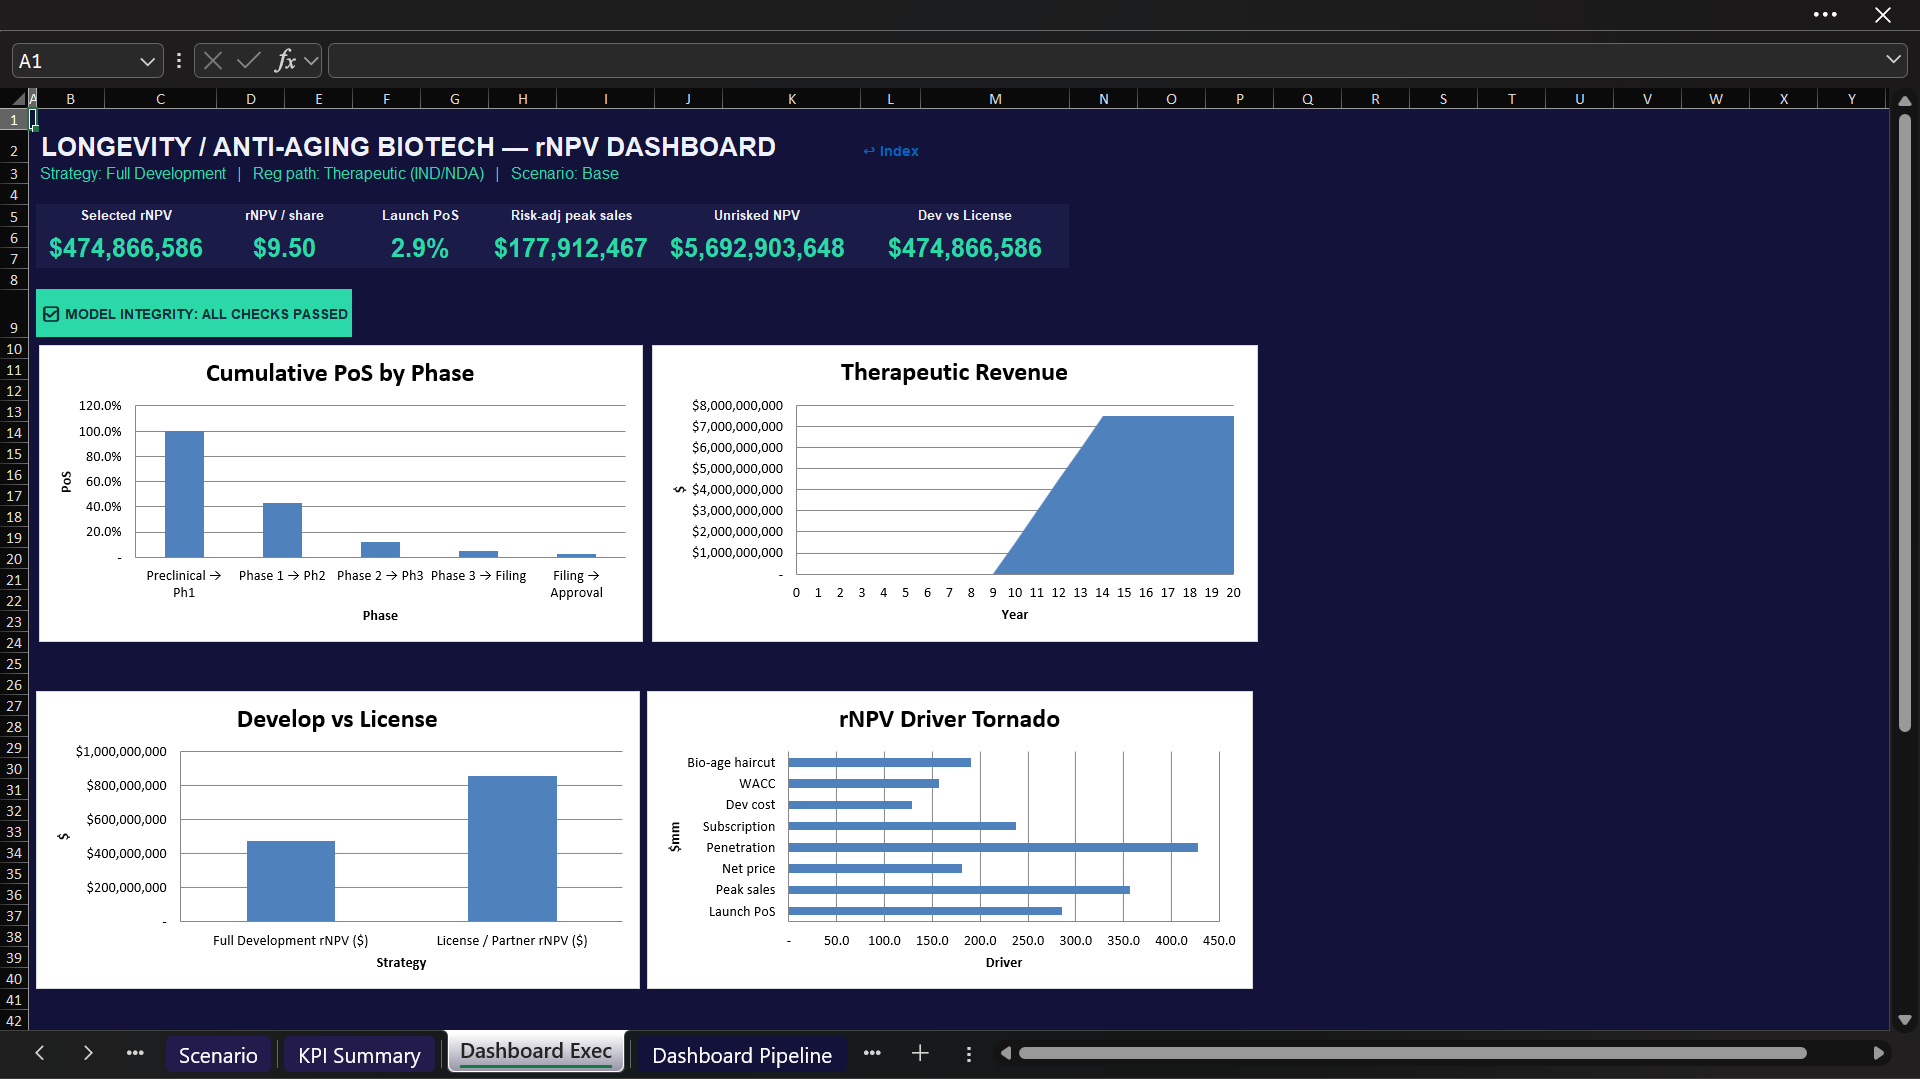
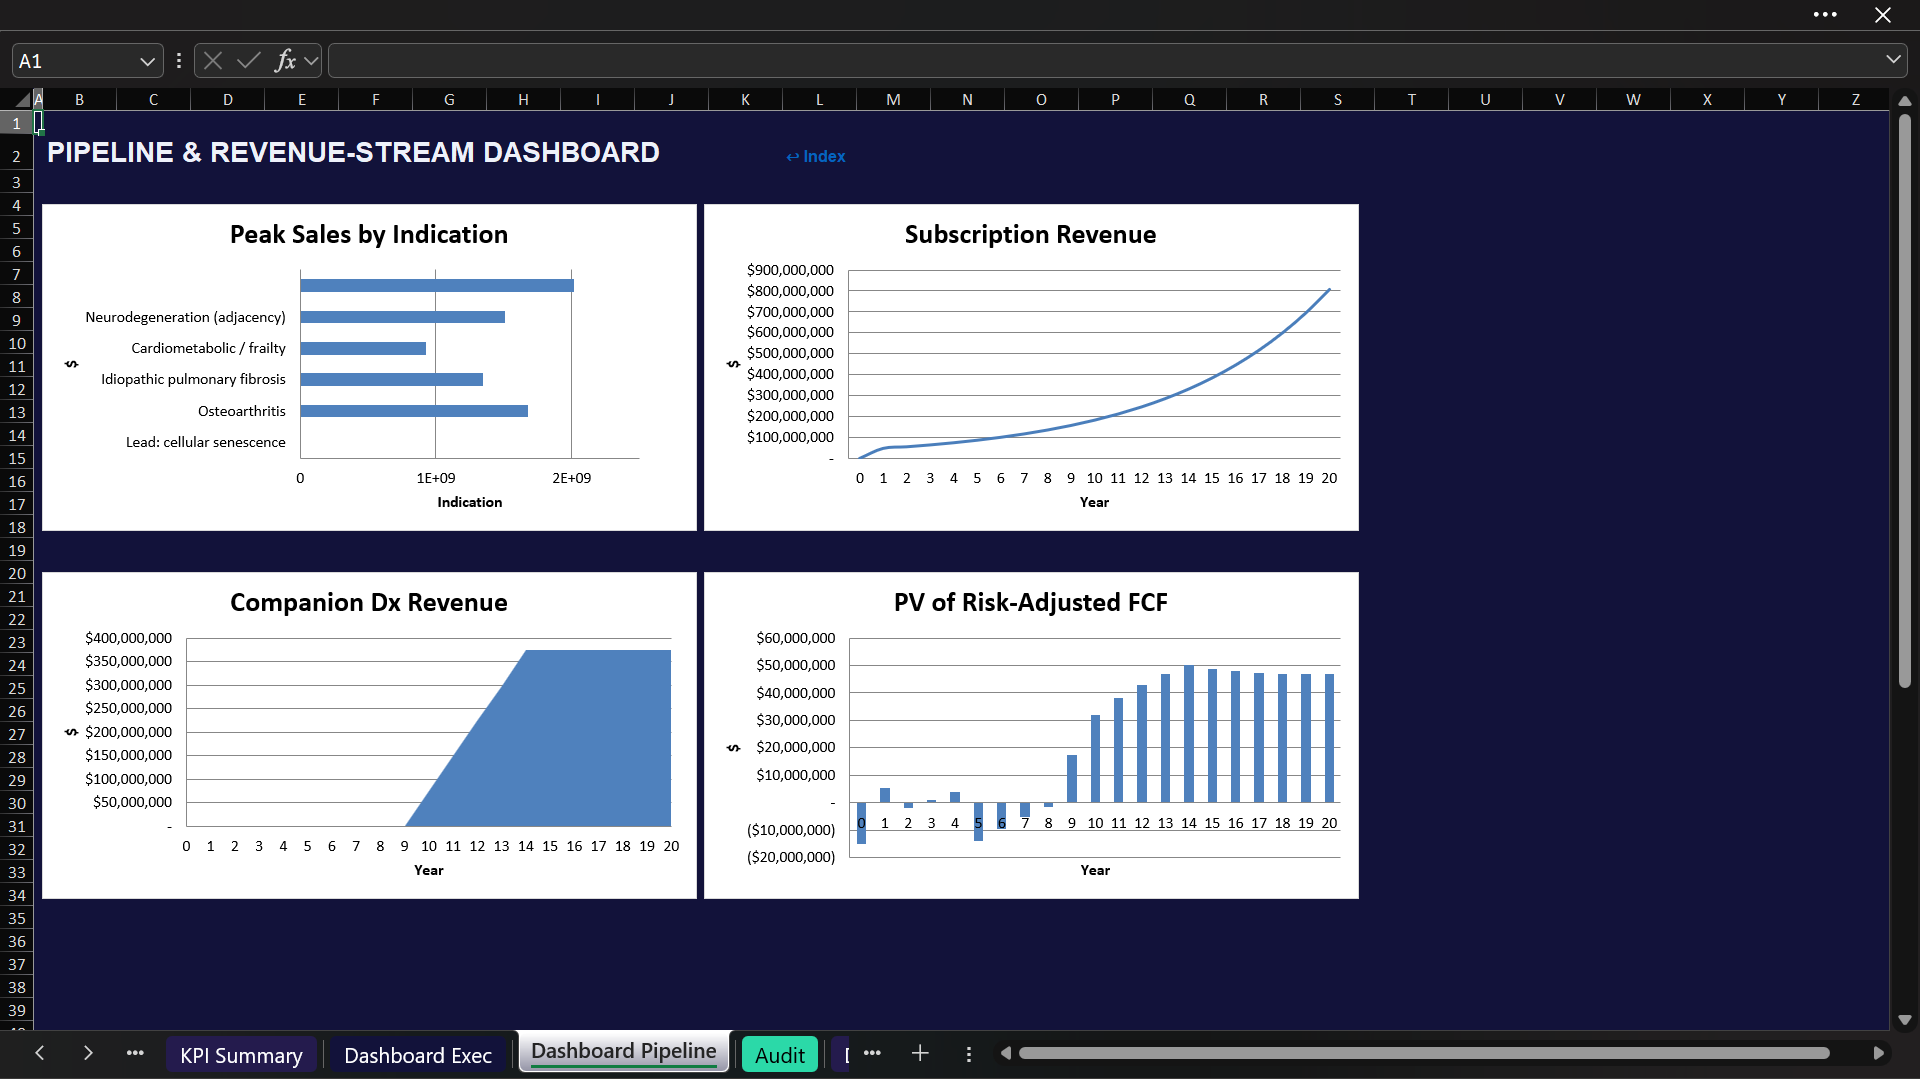
The workbook contains a KPI Summary, an executive dashboard, and a pipeline dashboard. The executive dashboard presents the selected rNPV, per-share value, launch probability, risk-adjusted peak sales, unrisked NPV, development-versus-license comparison, cumulative PoS, therapeutic revenue profile, and driver tornado.
Across the workbook there are 17 embedded charts supporting development, revenue, valuation, strategy, sensitivity, and dashboard views.

โœ… BUILT-IN MODEL INTEGRITY CHECKS
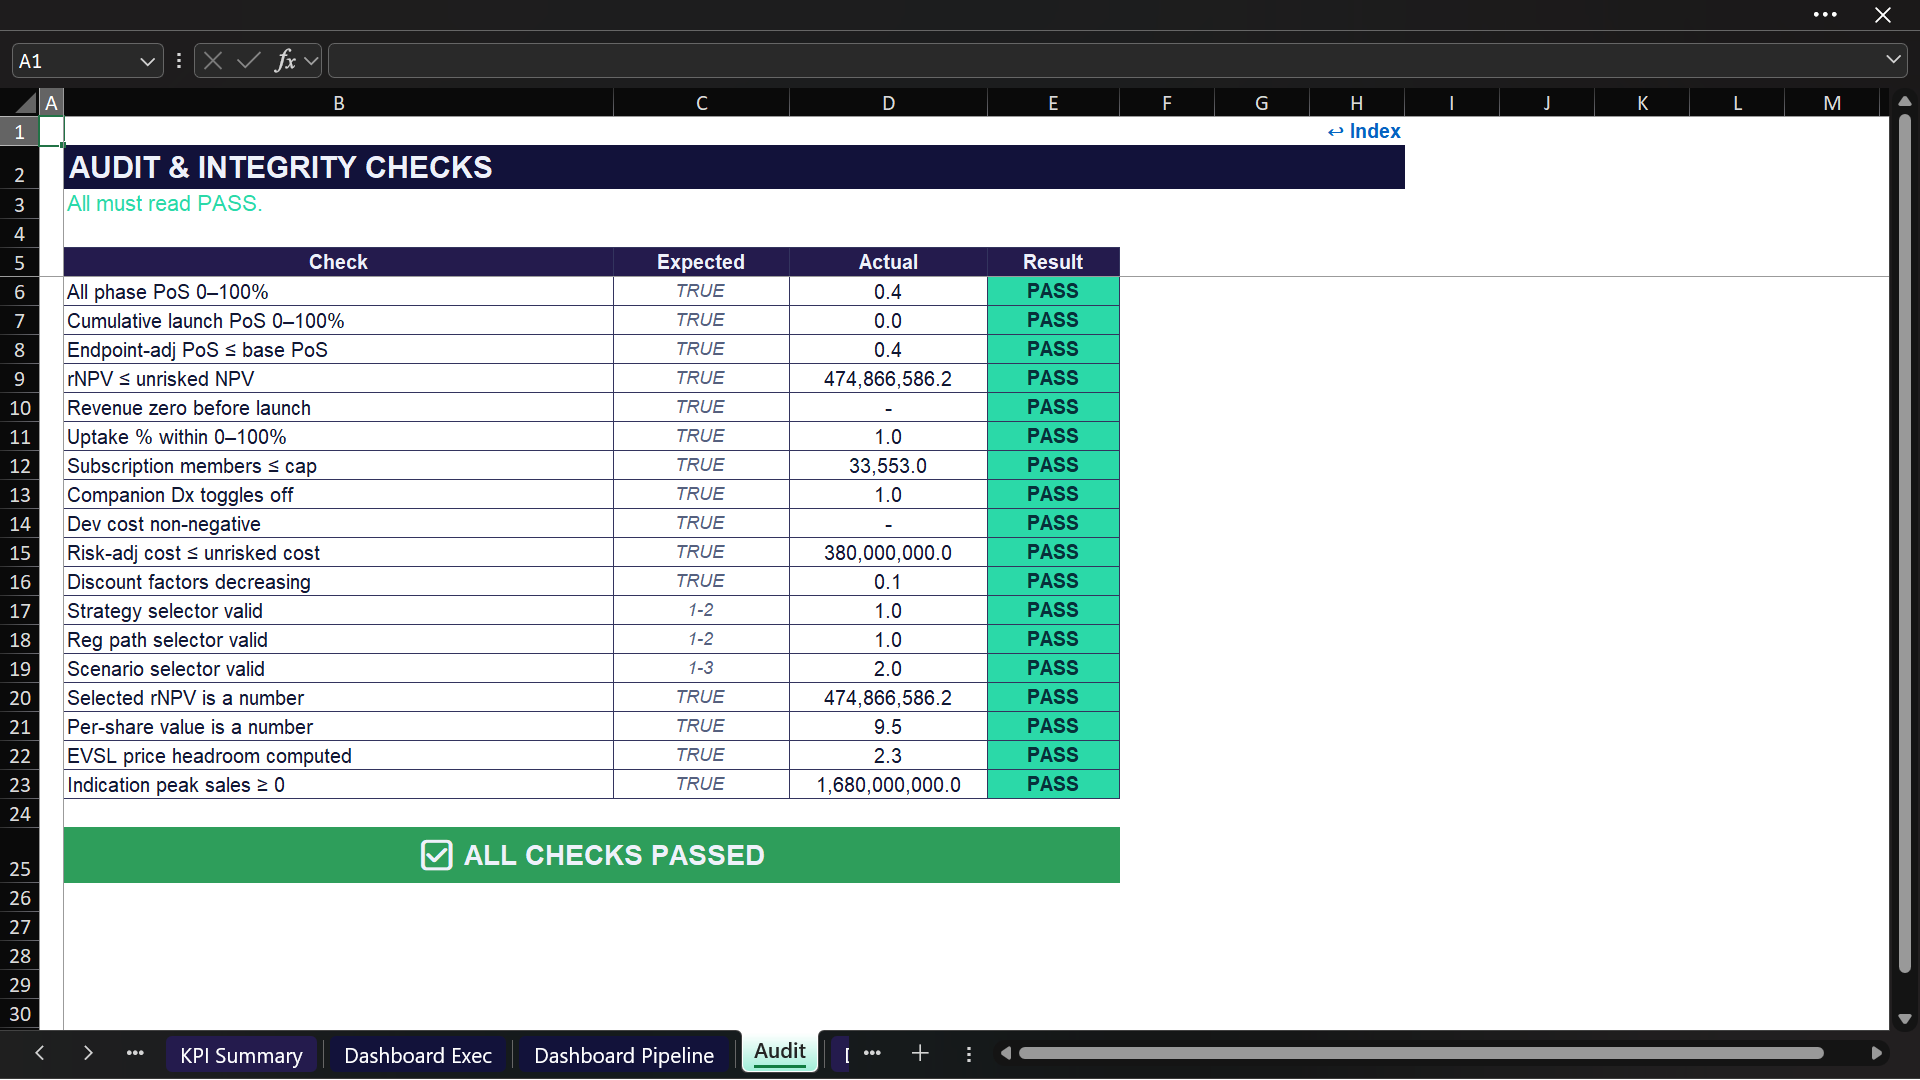
A dedicated Audit sheet checks key relationships and input ranges, including probability bounds, cumulative launch probability, endpoint-adjusted probability, rNPV versus unrisked NPV, pre-launch revenue, uptake bounds, subscription cap, diagnostic toggle behavior, development cost logic, discount-factor direction, valid selectors, numeric valuation outputs, EVSL price headroom, and non-negative indication peak sales.
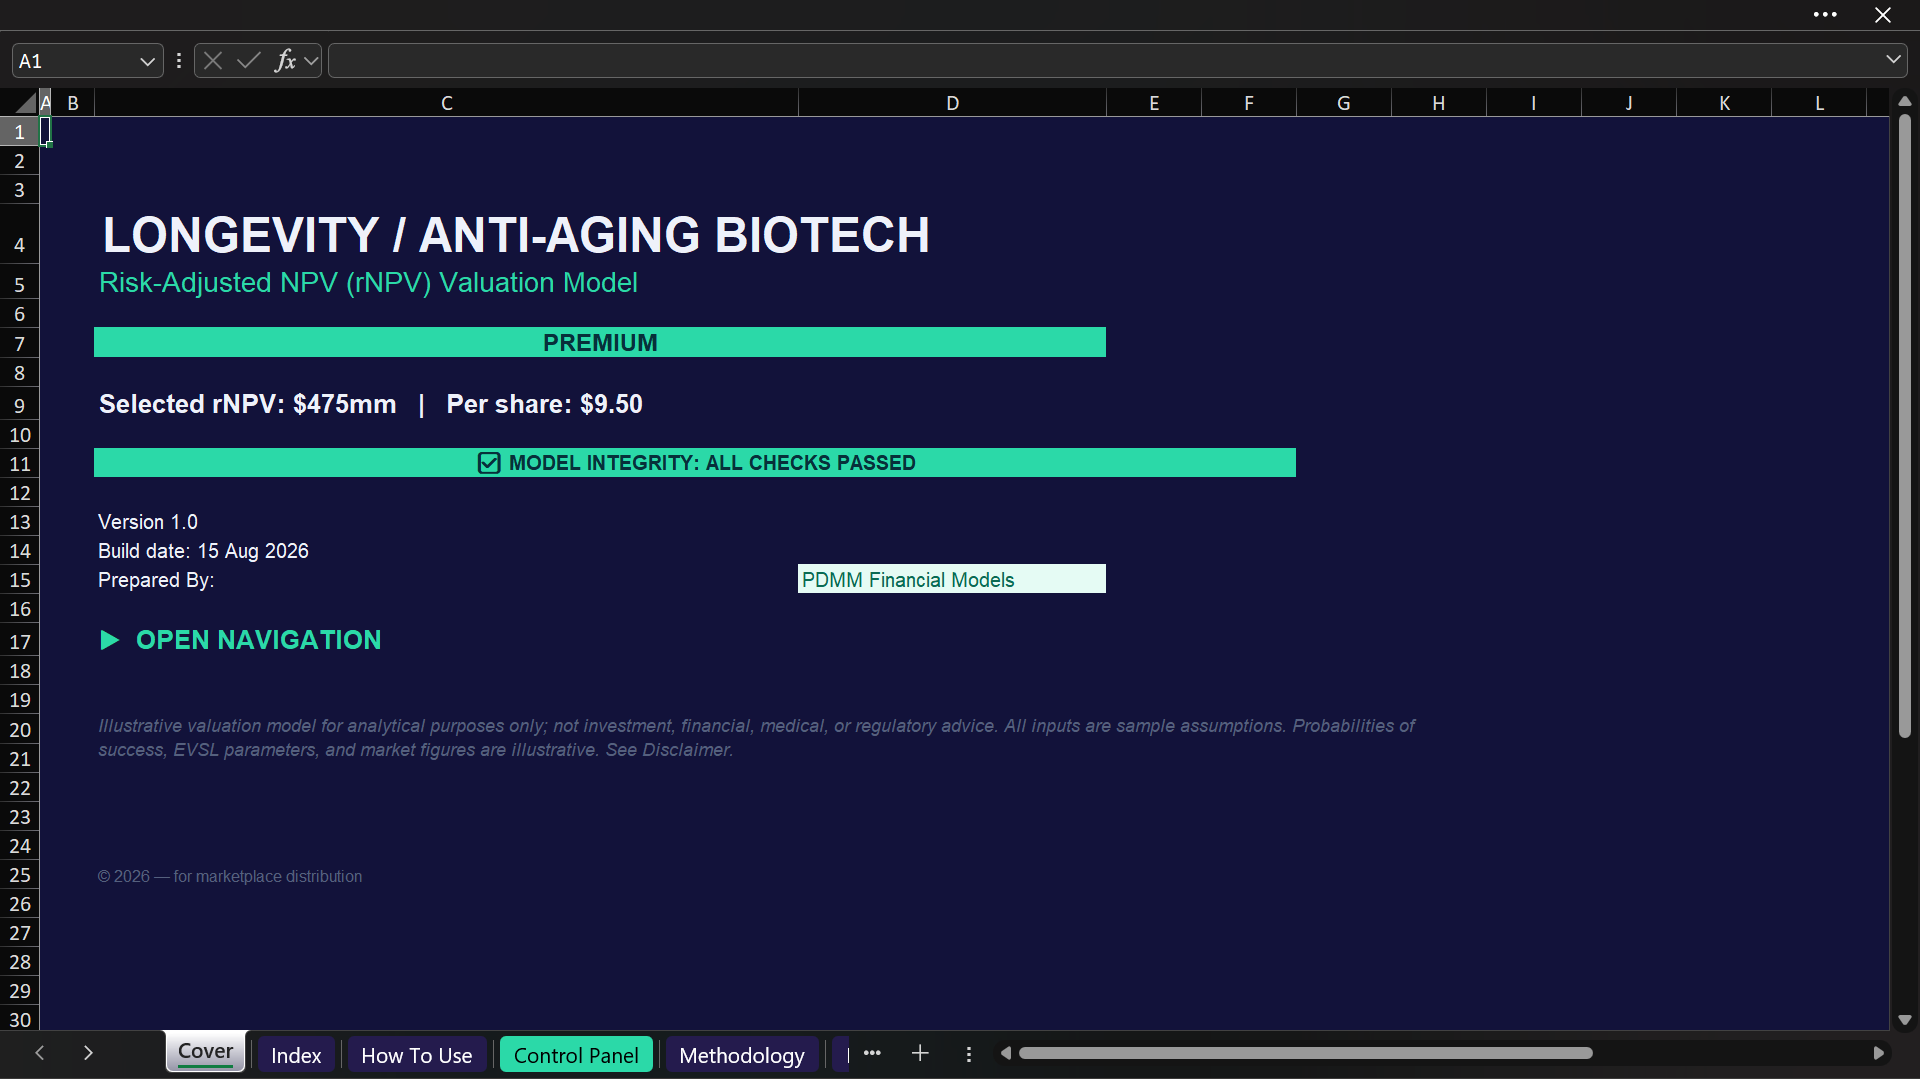
In the supplied workbook, the audit sheet reports all checks as passed and the formula scan shows no common Excel formula errors such as #REF!, #DIV/0!, #VALUE!, #NAME?, or #N/A.

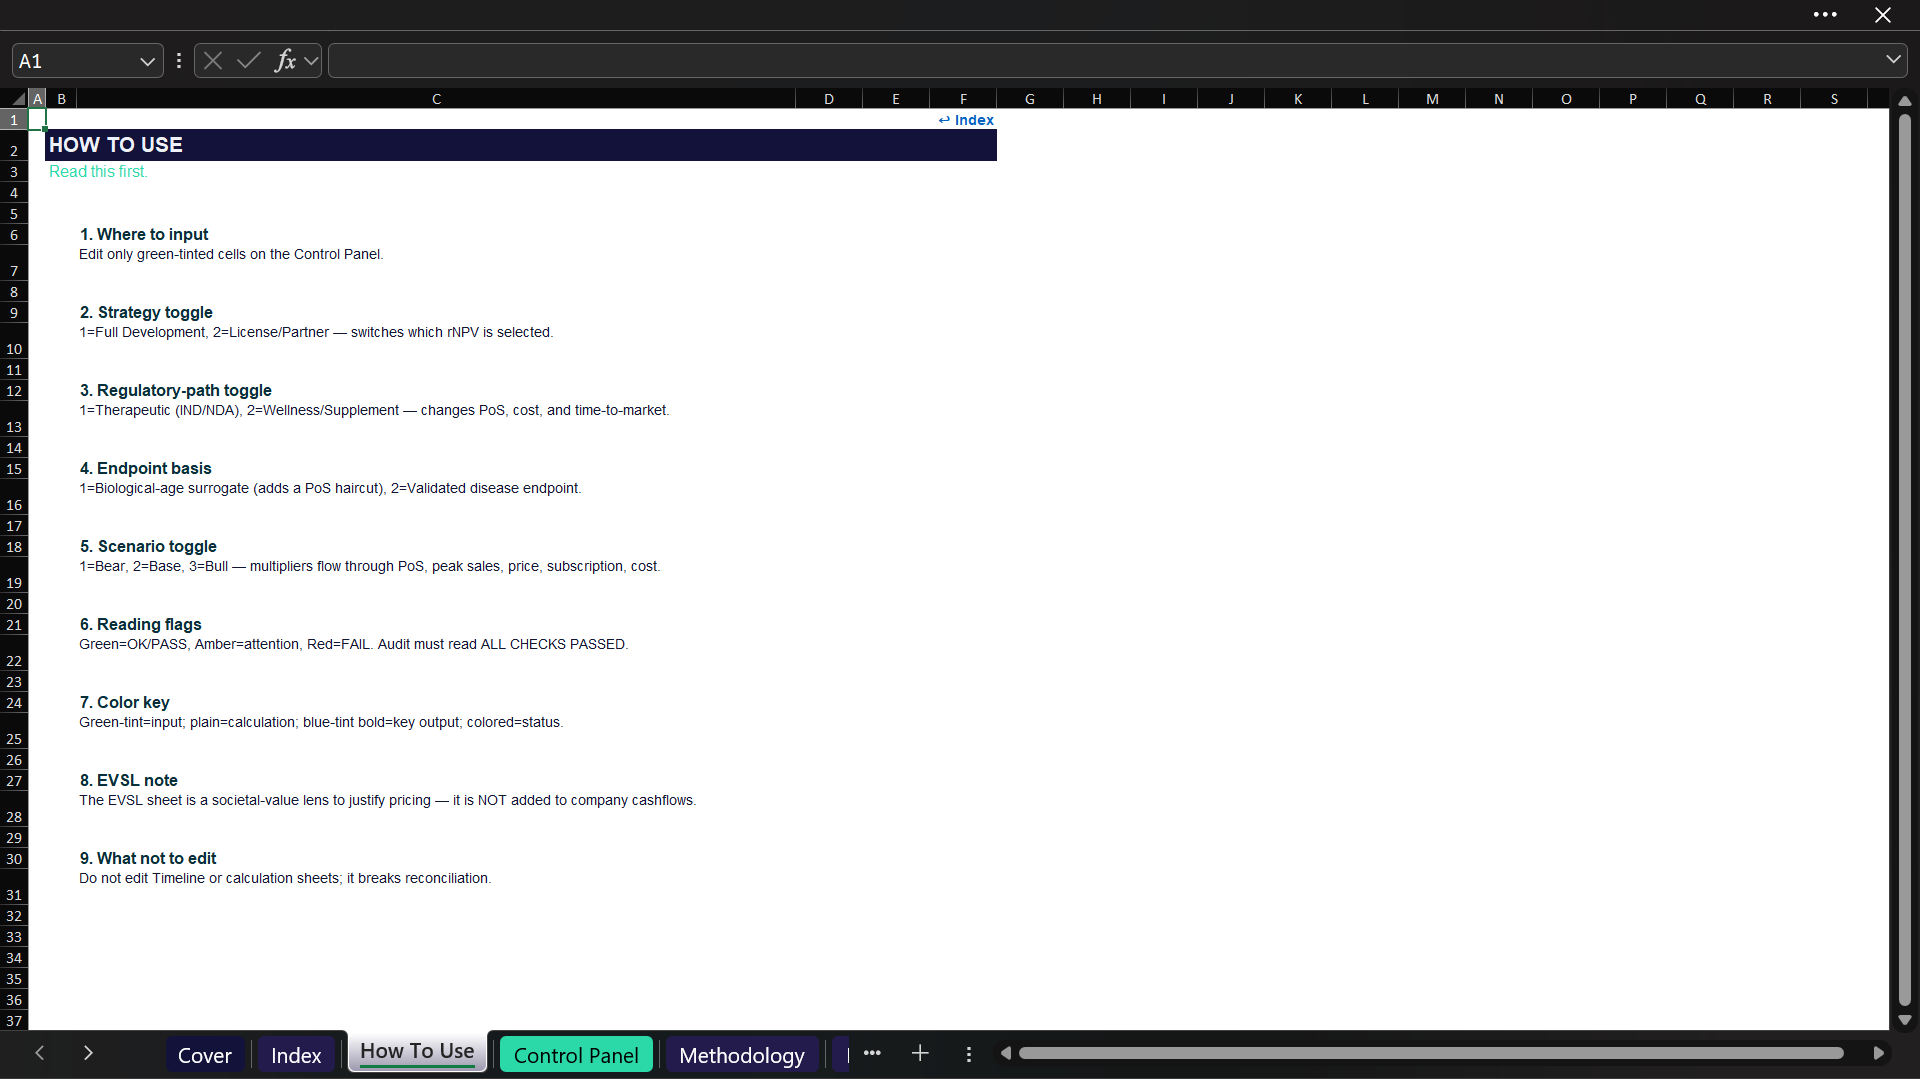
๐Ÿงญ HOW TO USE THE MODEL
  1. Read the How To Use sheet and review the model conventions.
  2. Go to the Control Panel and edit only the designated green-tinted input cells.
  3. Set the strategy, regulatory path, endpoint basis, current phase, and active scenario.
  4. Replace the illustrative development, commercial, diagnostic, subscription, licensing, finance, and EVSL assumptions with your own diligence.
  5. Review the Pipeline PoS, development cost, indication, revenue, EVSL, and rNPV calculation sheets.
  6. Compare Full Development with License / Partner economics.
  7. Review the valuation summary, scenario readout, sensitivity views, KPIs, and dashboards.
  8. Confirm the Audit sheet still reports all checks as passed after changing inputs.

๐Ÿ‘ฅ WHO THIS MODEL IS FOR
This workbook can be useful for biotech founders, CFOs, corporate-development teams, investors, venture funds, equity-research analysts, strategy teams, consultants, licensing professionals, and finance practitioners evaluating an early- or clinical-stage longevity / anti-aging platform.
It is especially relevant when a valuation needs to incorporate development risk, multiple age-related indication opportunities, optional.

๐Ÿ“ฆ DELIVERABLE
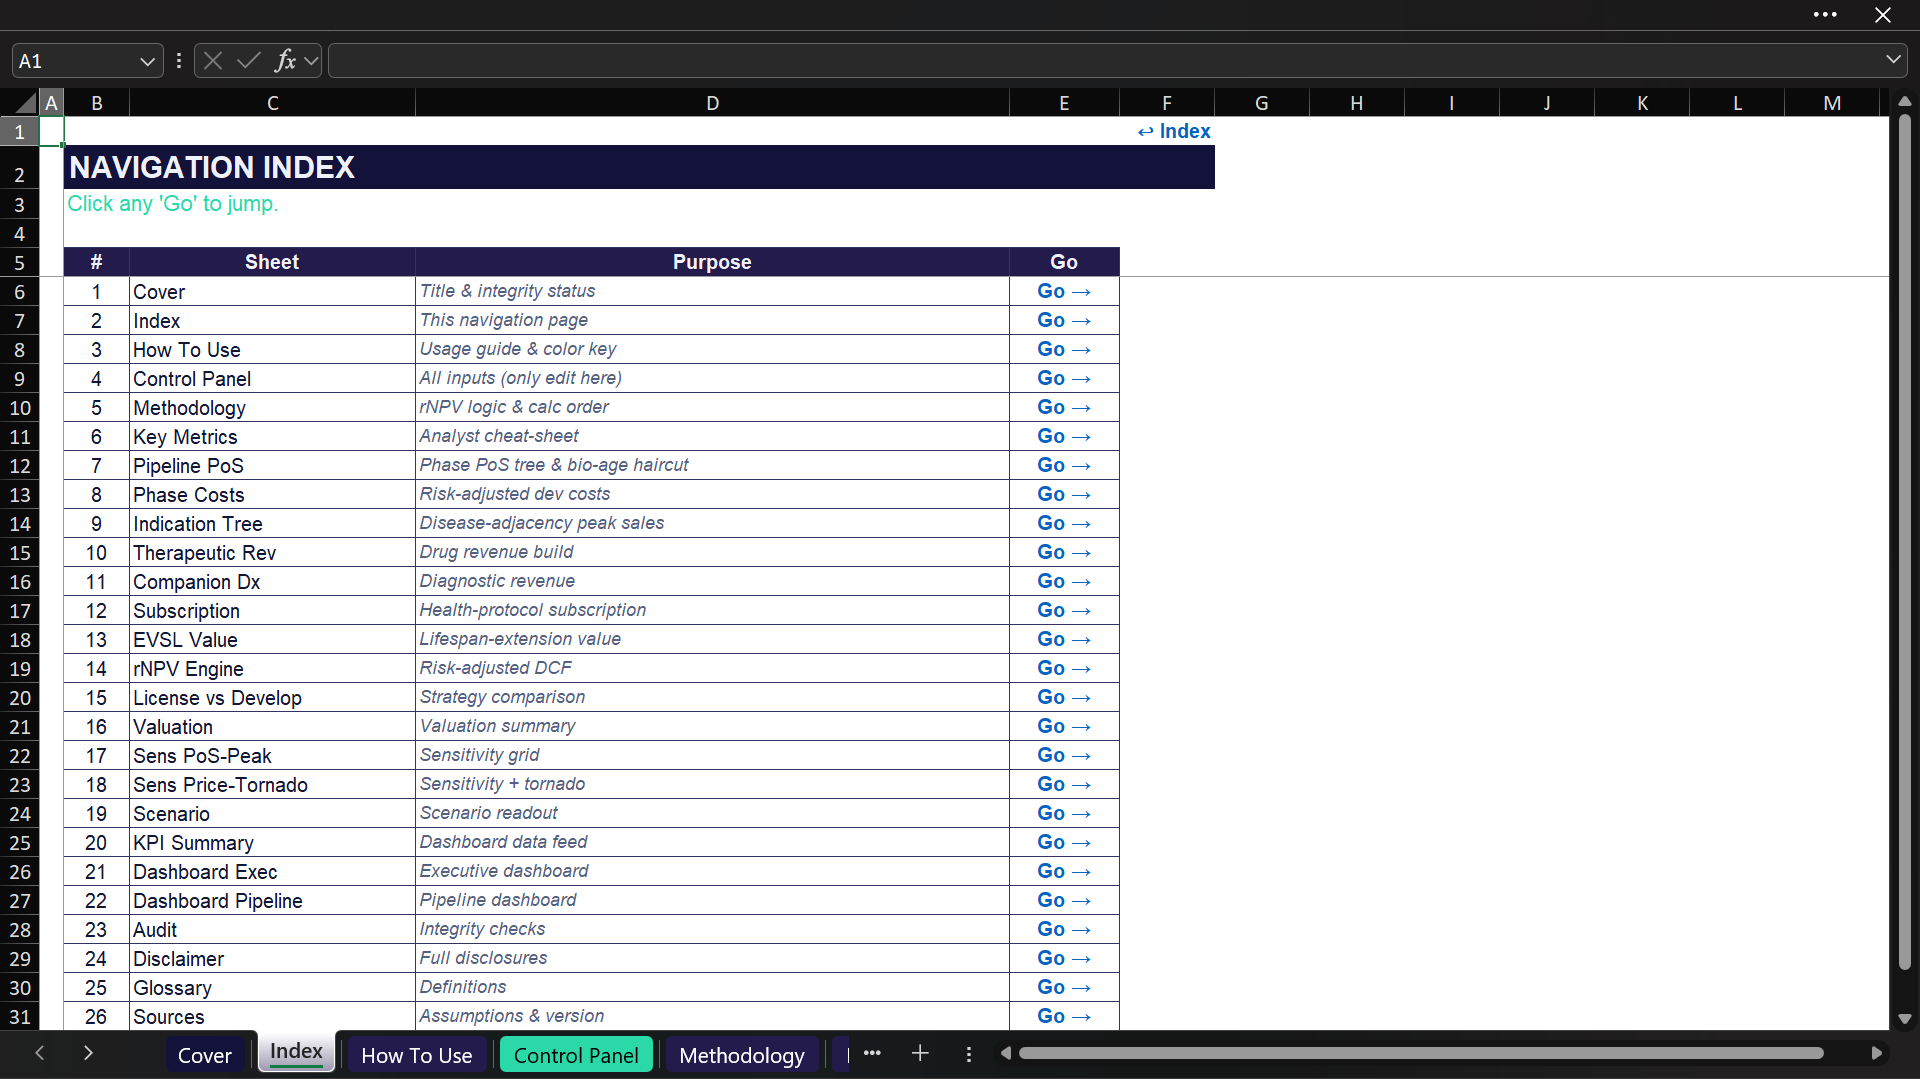
You receive one editable Excel workbook with 27 sheets, a centralized assumption panel, 20-year risk-adjusted valuation engine, strategic licensing comparison, scenario controls, sensitivity views, audit checks, and dashboards. Screenshots and PDF preview are not included in this marketplace package because the seller will create them separately.

This Best Practice includes
1 Fully Editable Premium Excel Model

Acquire business license for $80.00

Add to cart

Add to bookmarks

Discuss

Further information

Estimate a risk-adjusted NPV for a longevity or anti-aging biotech program.
Translate phase-by-phase development risk into cumulative launch probability.
Compare Full Development with License / Partner economics.
Evaluate commercial value across multiple age-related indication adjacencies.
Quantify the contribution of companion-diagnostic and subscription modules.
Test directional valuation exposure to PoS, peak sales, price, penetration, development cost, WACC, subscription growth, and bio-age haircut assumptions.
Convert the selected rNPV into a per-share reference using fully diluted shares.
Provide a separate illustrative EVSL societal-value lens without treating it as company revenue.

Valuing an early-stage or clinical-stage longevity / anti-aging biotechnology asset.
Assessing a program where probability of success and development timing materially drive value.
Evaluating multiple age-related indication opportunities from one lead asset or platform.
Comparing retained development economics with an out-licensing or partnership strategy.
Considering optional companion-diagnostic or recurring longevity-protocol economics.
Preparing an internal strategy case, investment committee analysis, licensing discussion, or valuation workstream.

A company needs a full three-statement accounting model with balance sheet, cash-flow statement, working capital, and financing schedules.
The analysis requires Monte Carlo simulation or stochastic clinical-trial modeling.
A regulatory, medical, scientific, or legal conclusion must be reached from the model.
The user needs a validated regulatory forecast for biological-age endpoints or current jurisdiction-specific legal treatment.
The transaction requires company-specific tax structuring, purchase accounting, debt financing, or complex capitalization mechanics.
The user expects the sensitivity grids to independently rerun every underlying model formula; they are indicative scaled sensitivities.


0.0 / 5 (0 votes)

please wait...