Originally published: 09/01/2025 11:00
Publication number: ELQ-20257-1
View all versions & Certificate
Publication number: ELQ-20257-1
View all versions & Certificate

Medical Equipment Manufacturer Financial Model
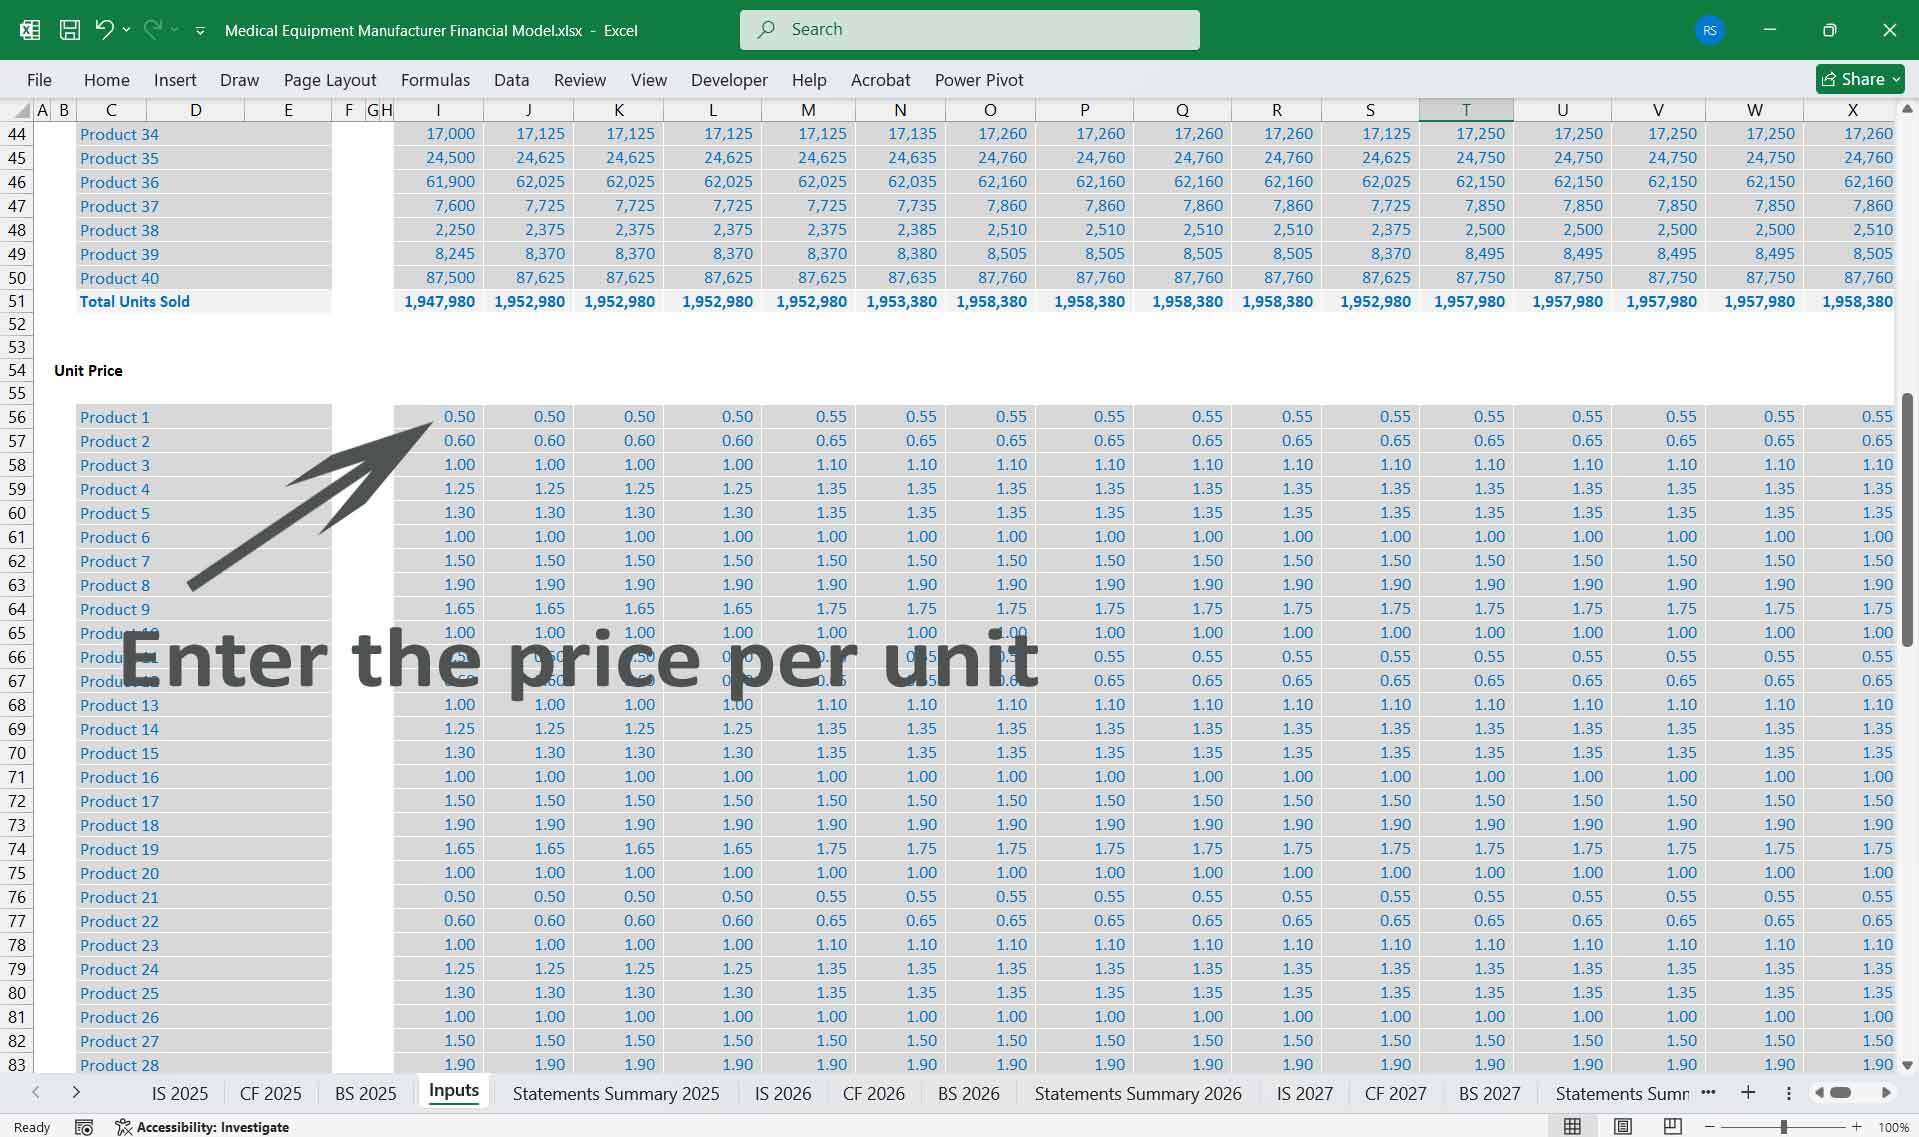
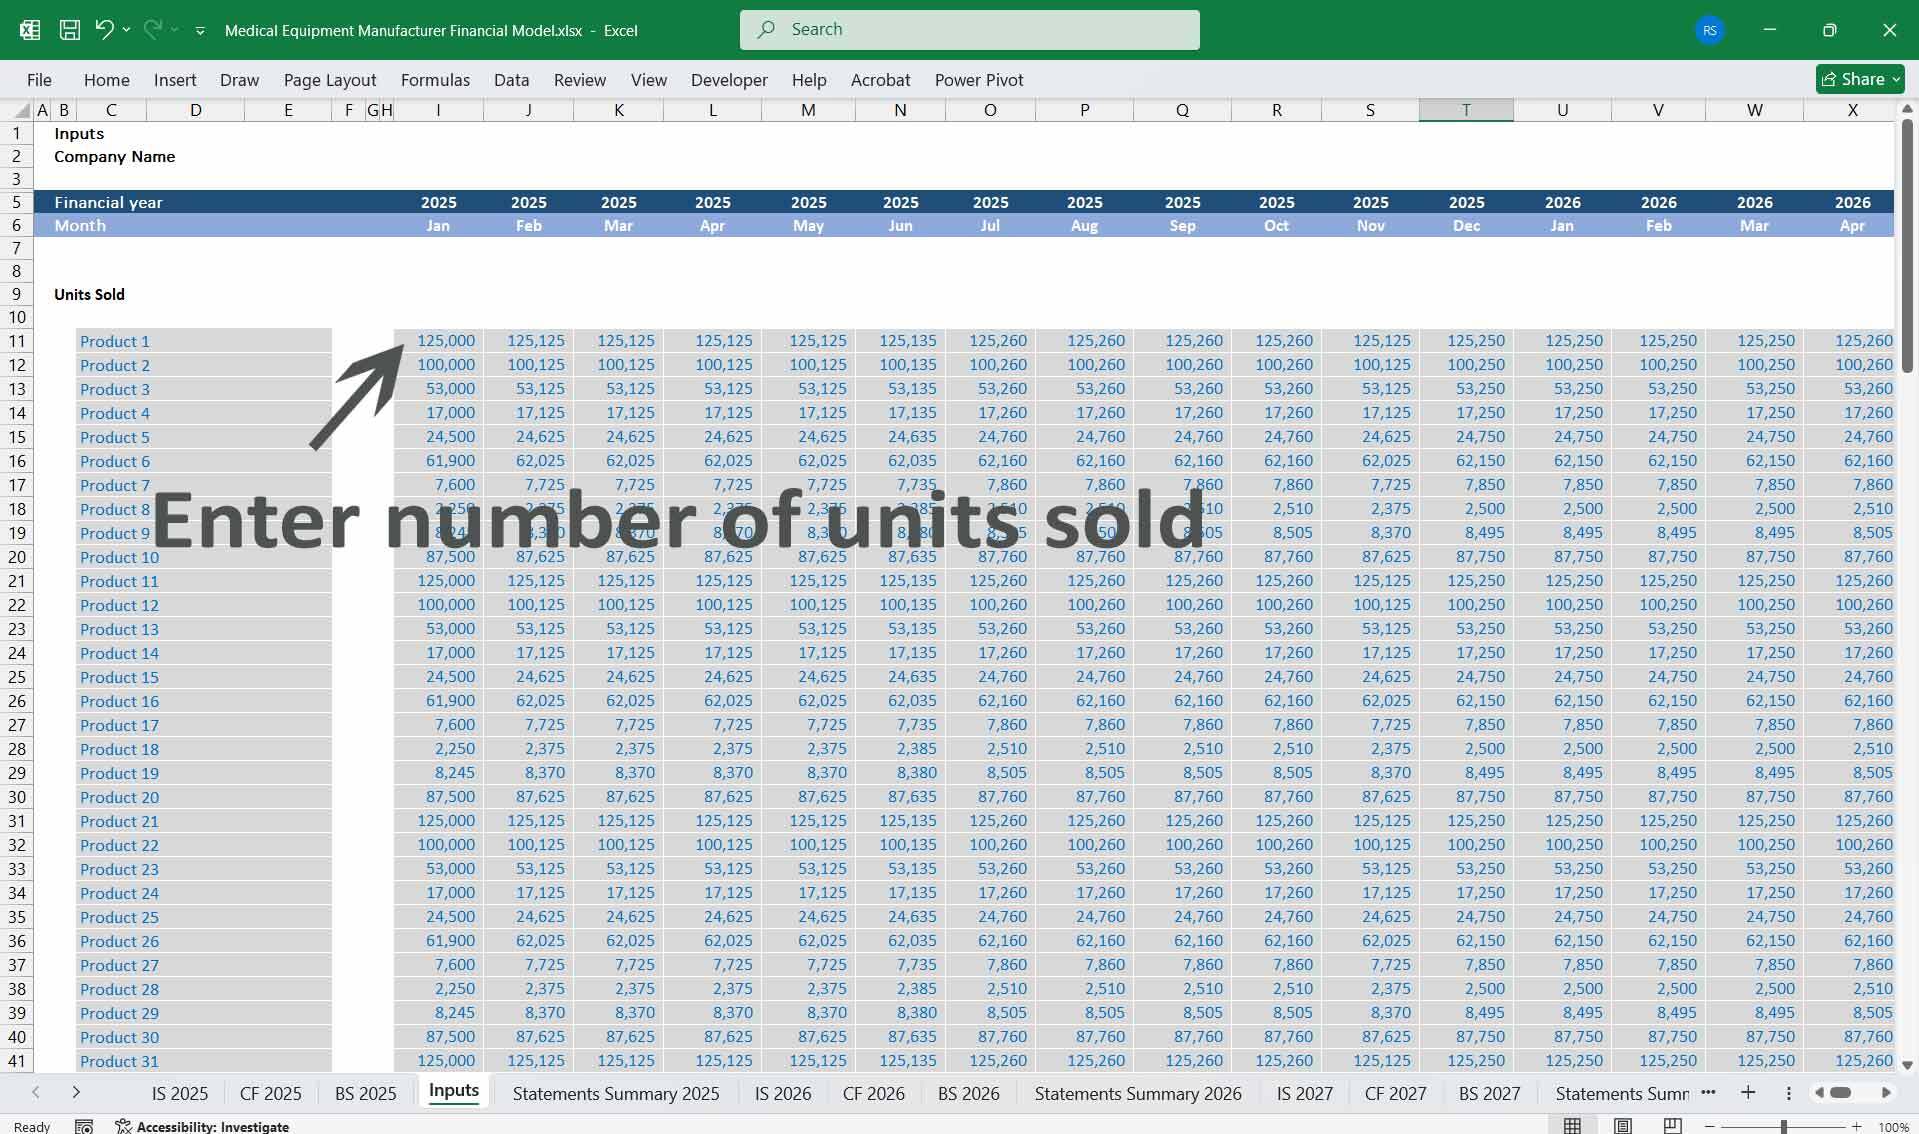
Comprehensive 80 product line, 5 Year 3 statement MS Excel spreadsheet for tracking Medical Equipment Manufacturer Finances.
 by AllFinancialModels
AllFinancialModels offer a curated selection of high-quality yet financial model templates designed to support a wide range of business needs.Follow
medical equipmenthealthmedicalmanufacturingmedical deviceexcelfinancefinancial modelhospitalmedical care
Description
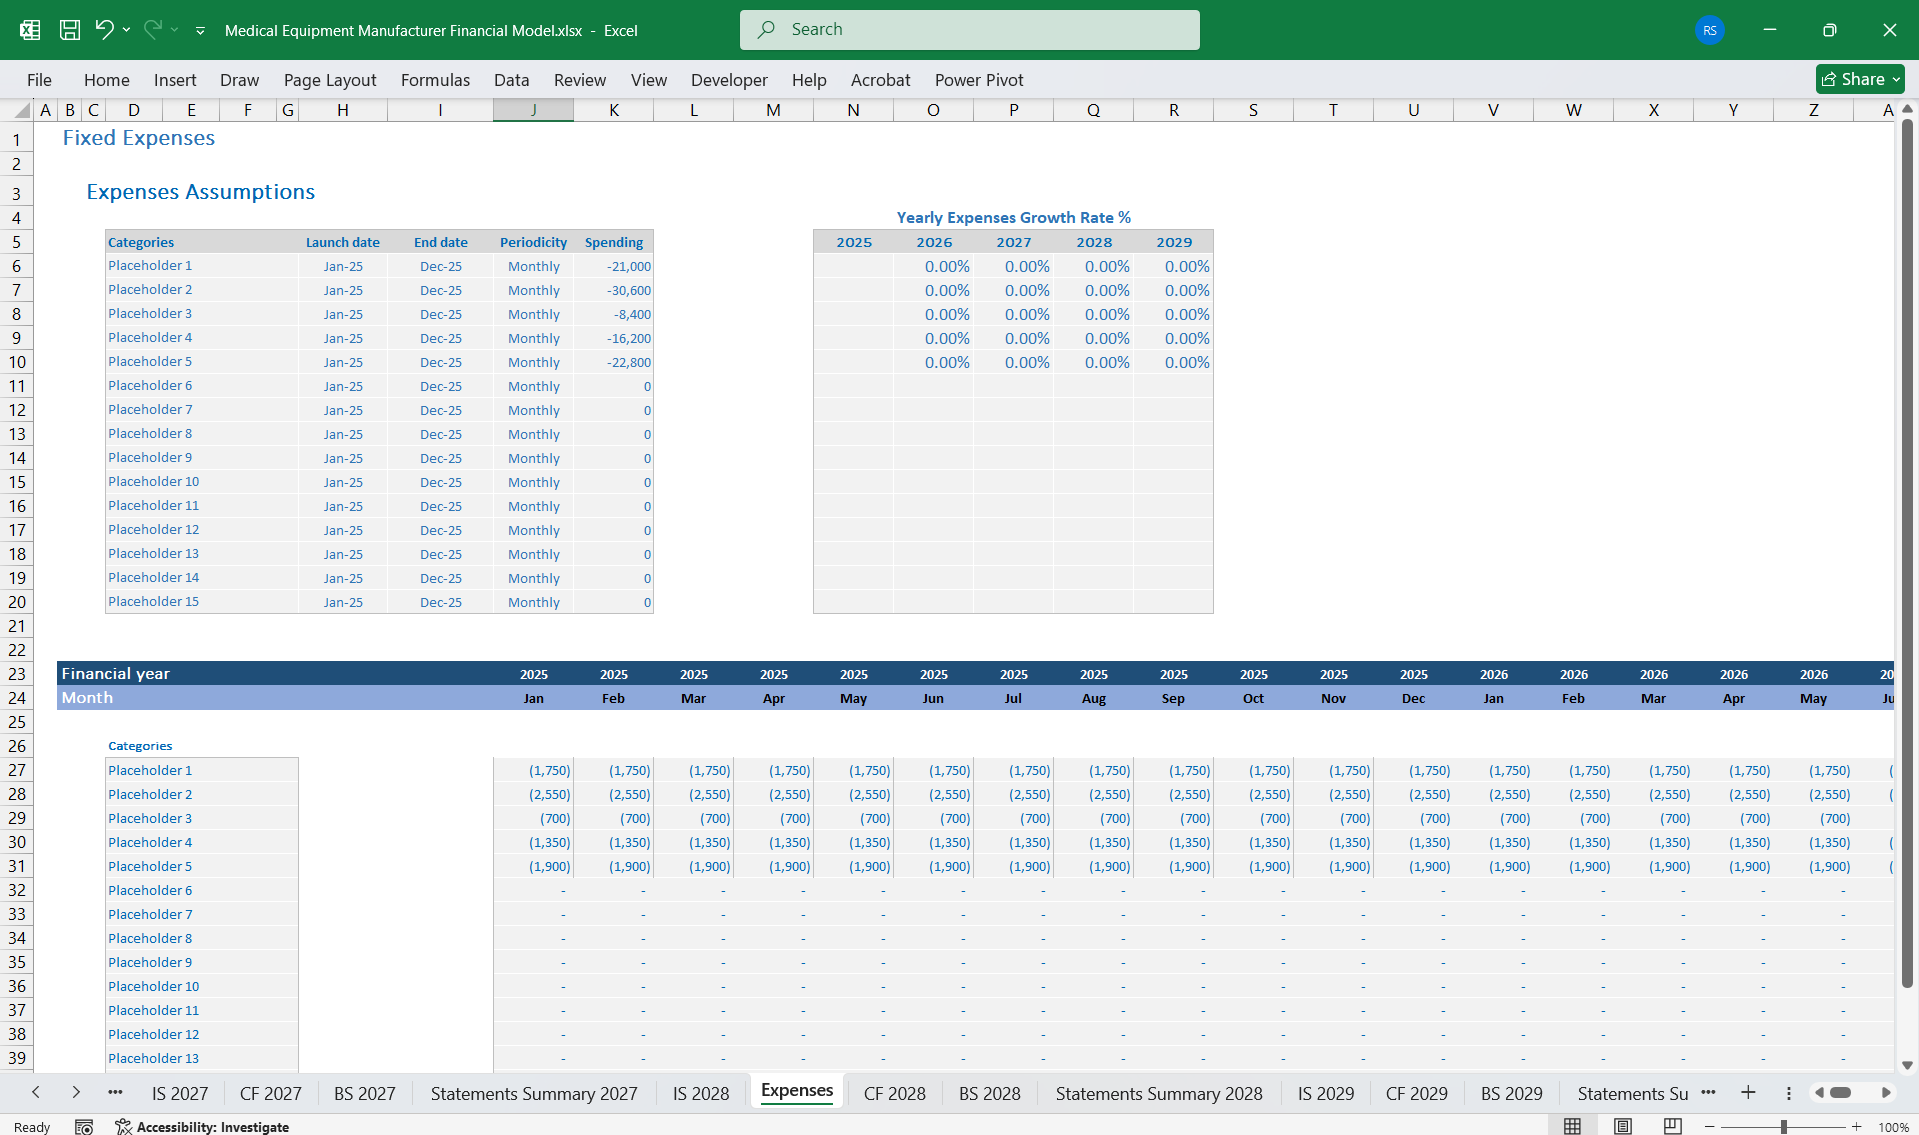
Financial Model for a Medical Equipment Manufacturer These comprehensive financial models detail the financial health and performance of a Medical Equipment Manufacturer, including key elements like the Income Statement, Cash Flow Statement, and Balance Sheet. 80-product line, highlighting revenue generation, scalability, and associated costs.
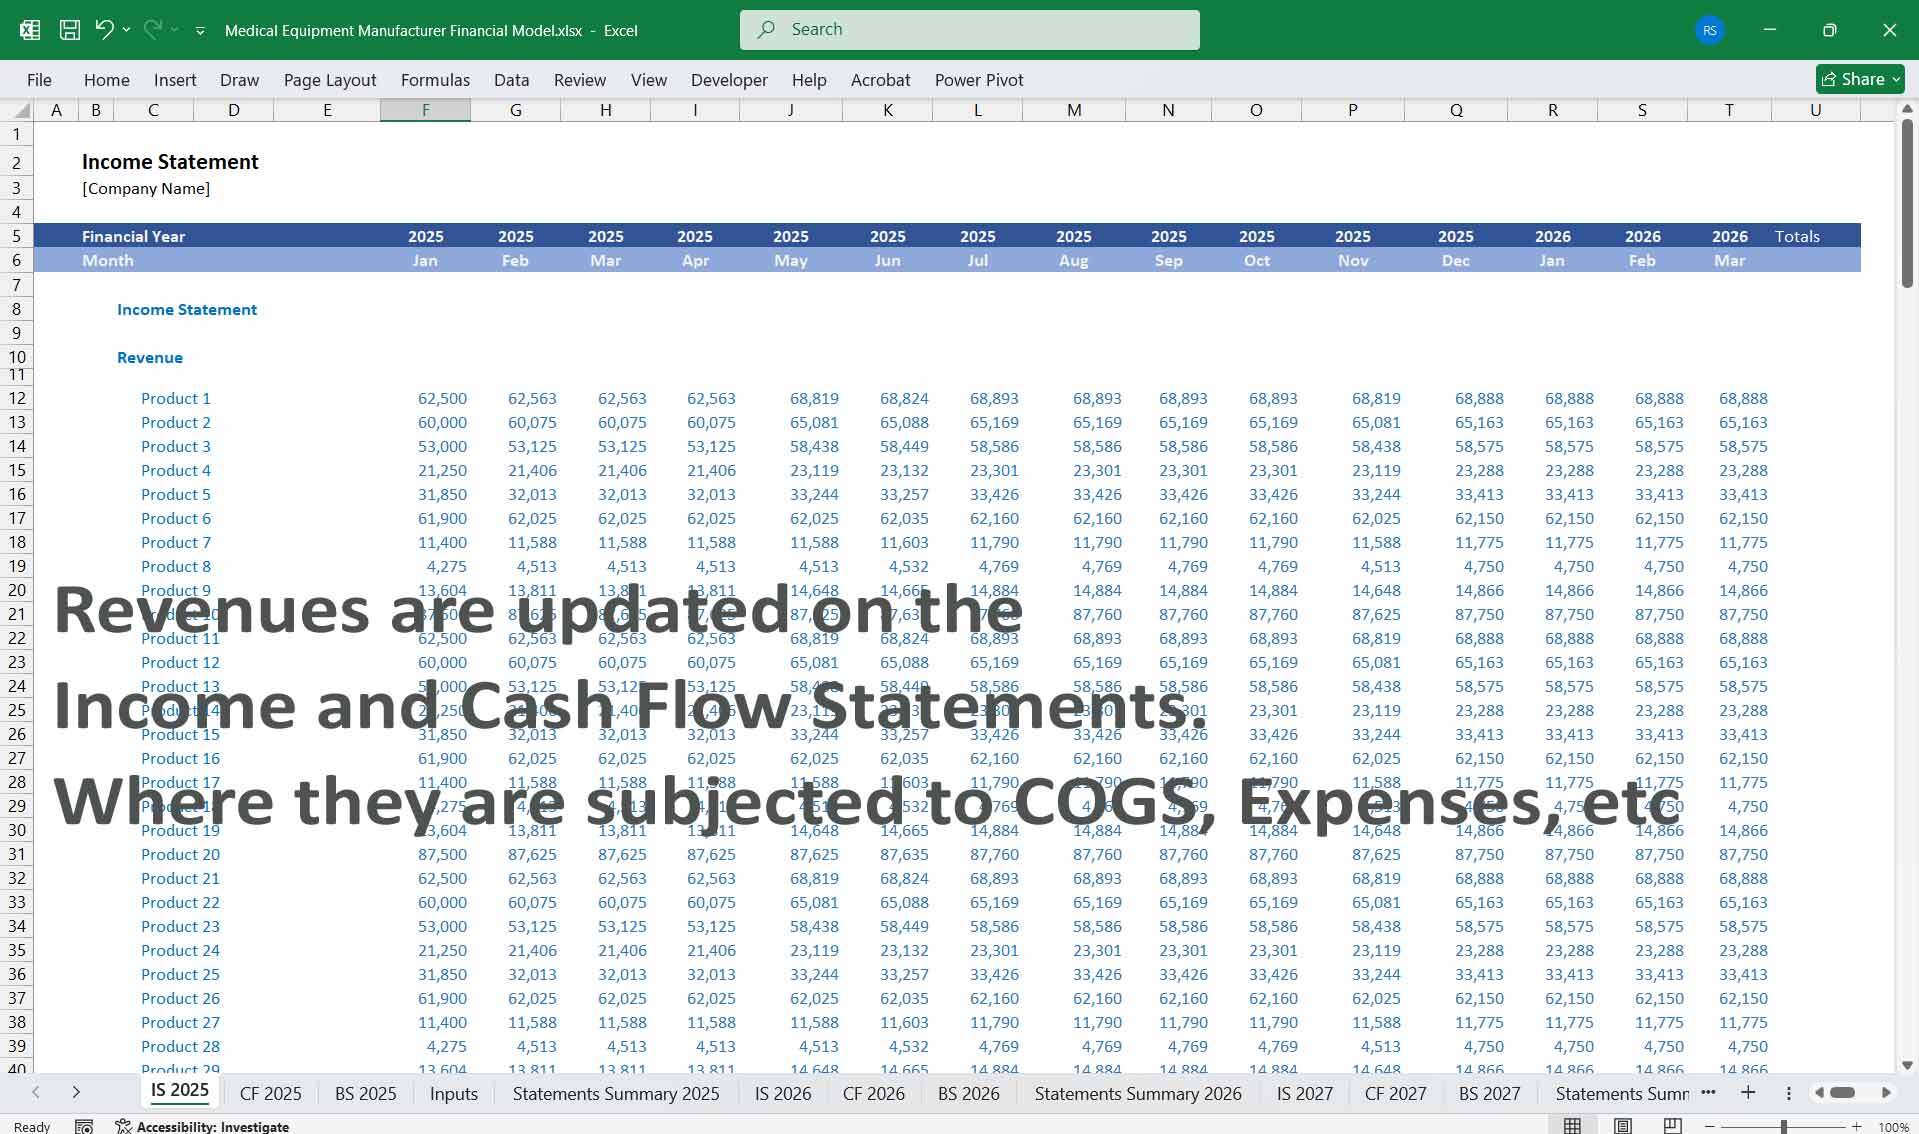
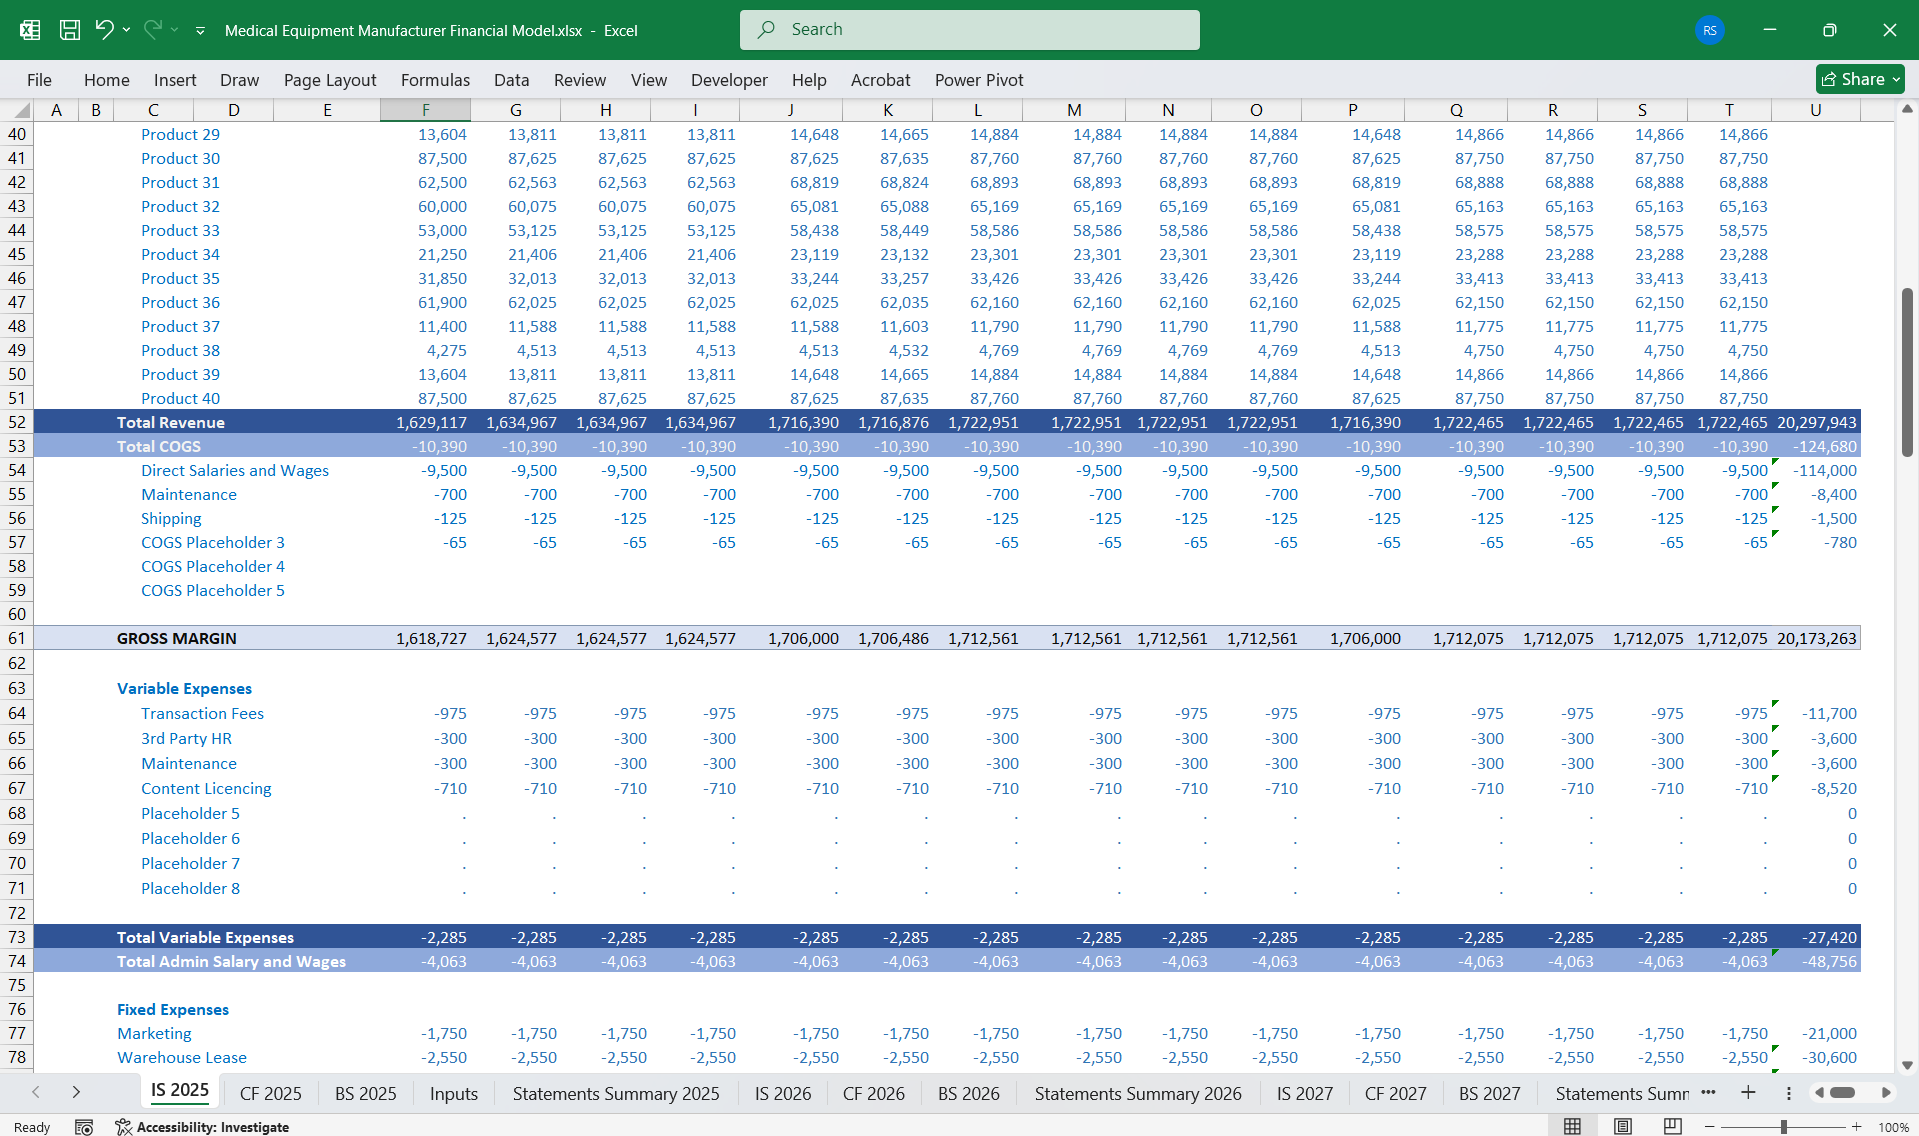
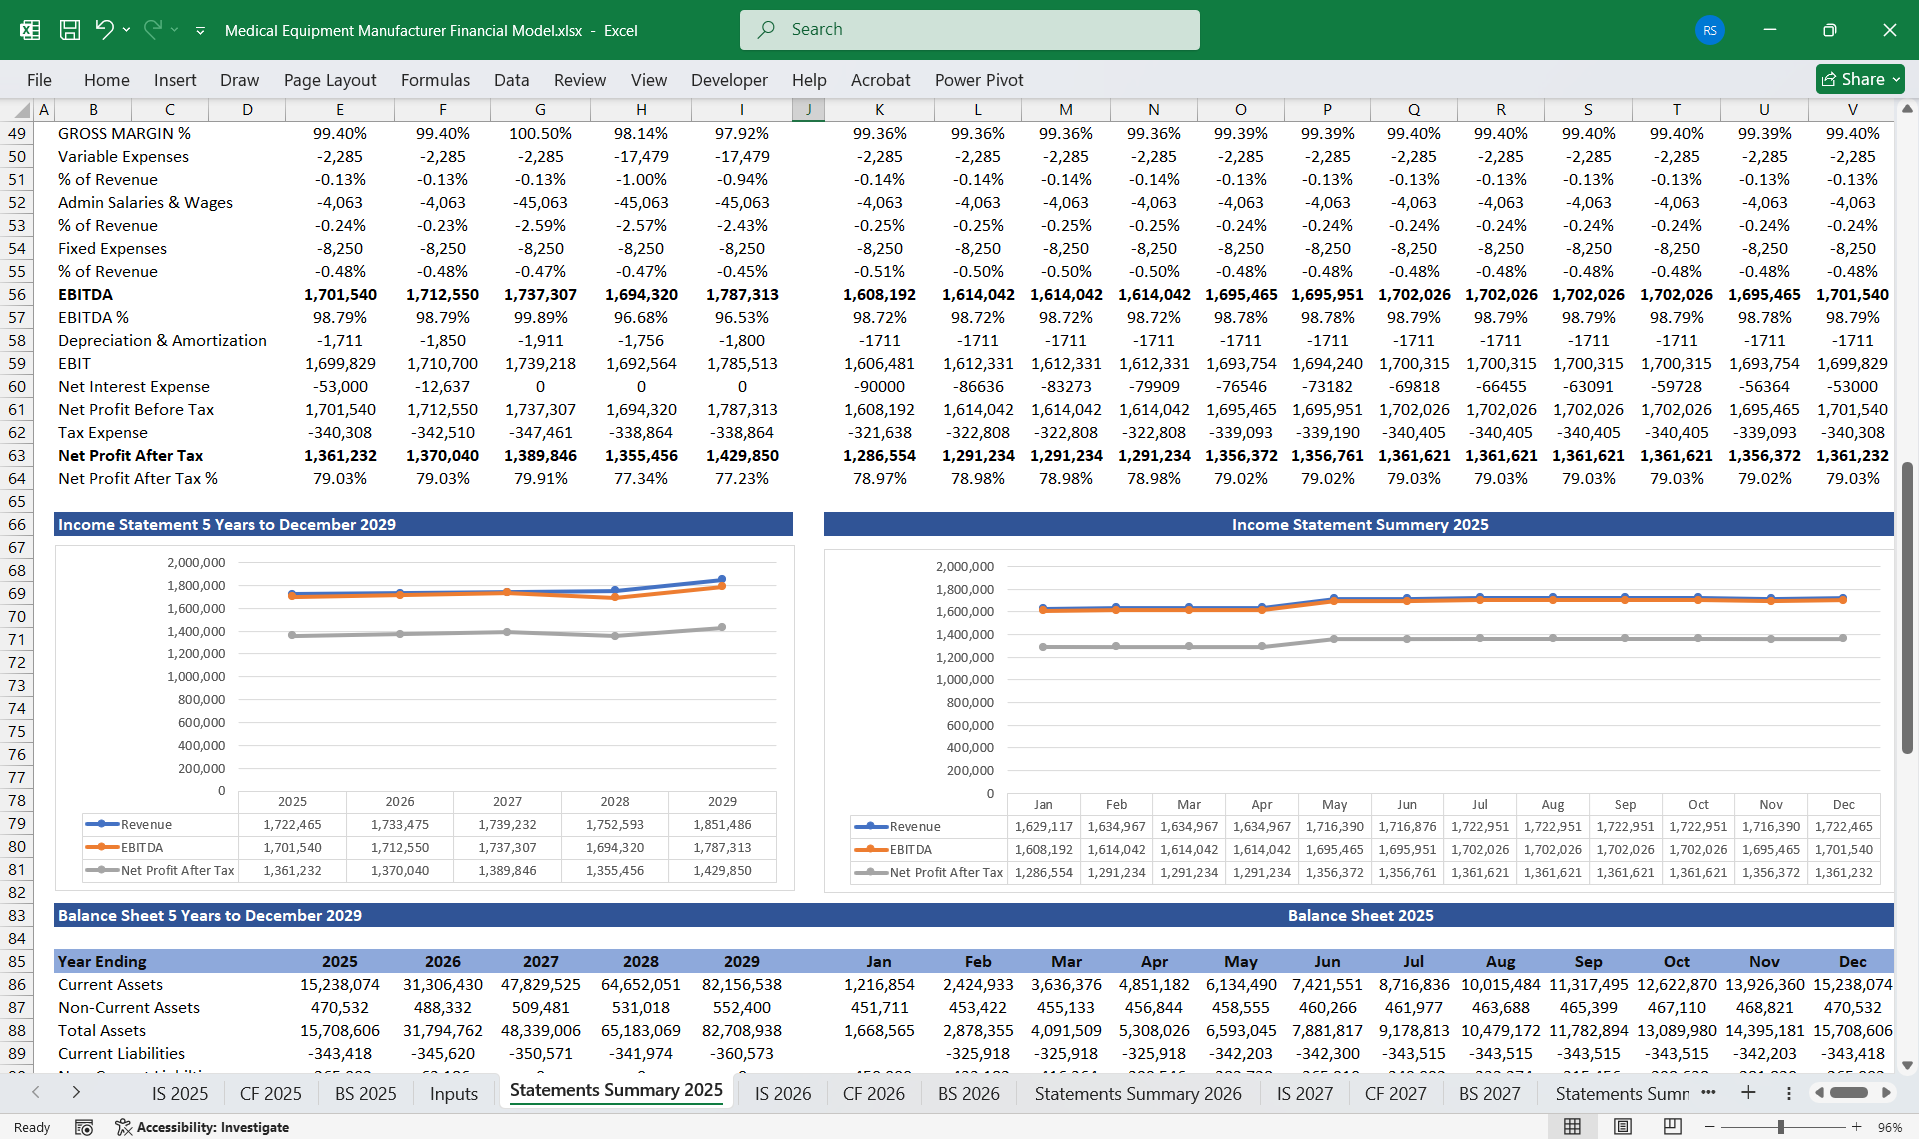
1. Income StatementThe Income Statement outlines the manufacturer’s profitability by capturing revenues and expenses.
Revenue Streams
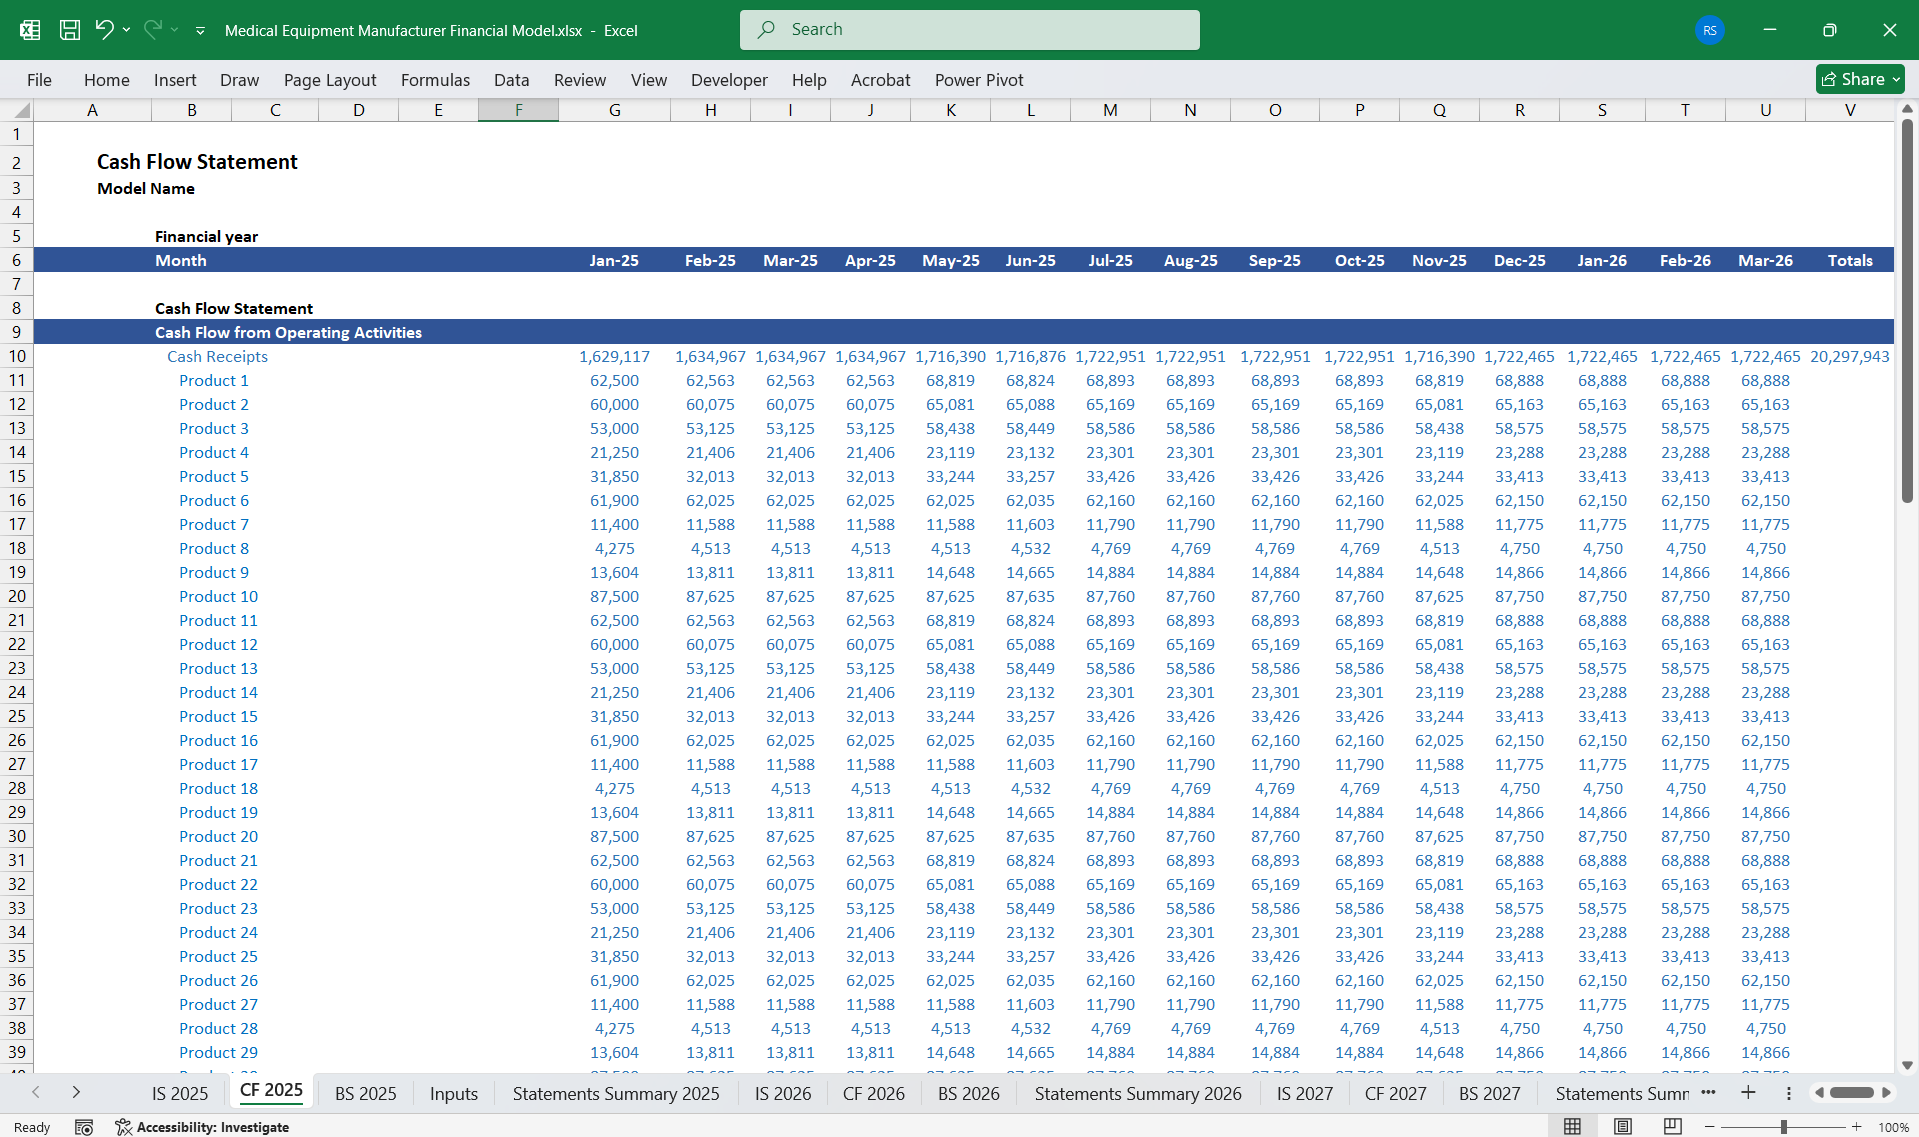
Operating Activities
Assets
Financial Model for a Medical Equipment Manufacturer These comprehensive financial models detail the financial health and performance of a Medical Equipment Manufacturer, including key elements like the Income Statement, Cash Flow Statement, and Balance Sheet. 80-product line, highlighting revenue generation, scalability, and associated costs.
1. Income StatementThe Income Statement outlines the manufacturer’s profitability by capturing revenues and expenses.
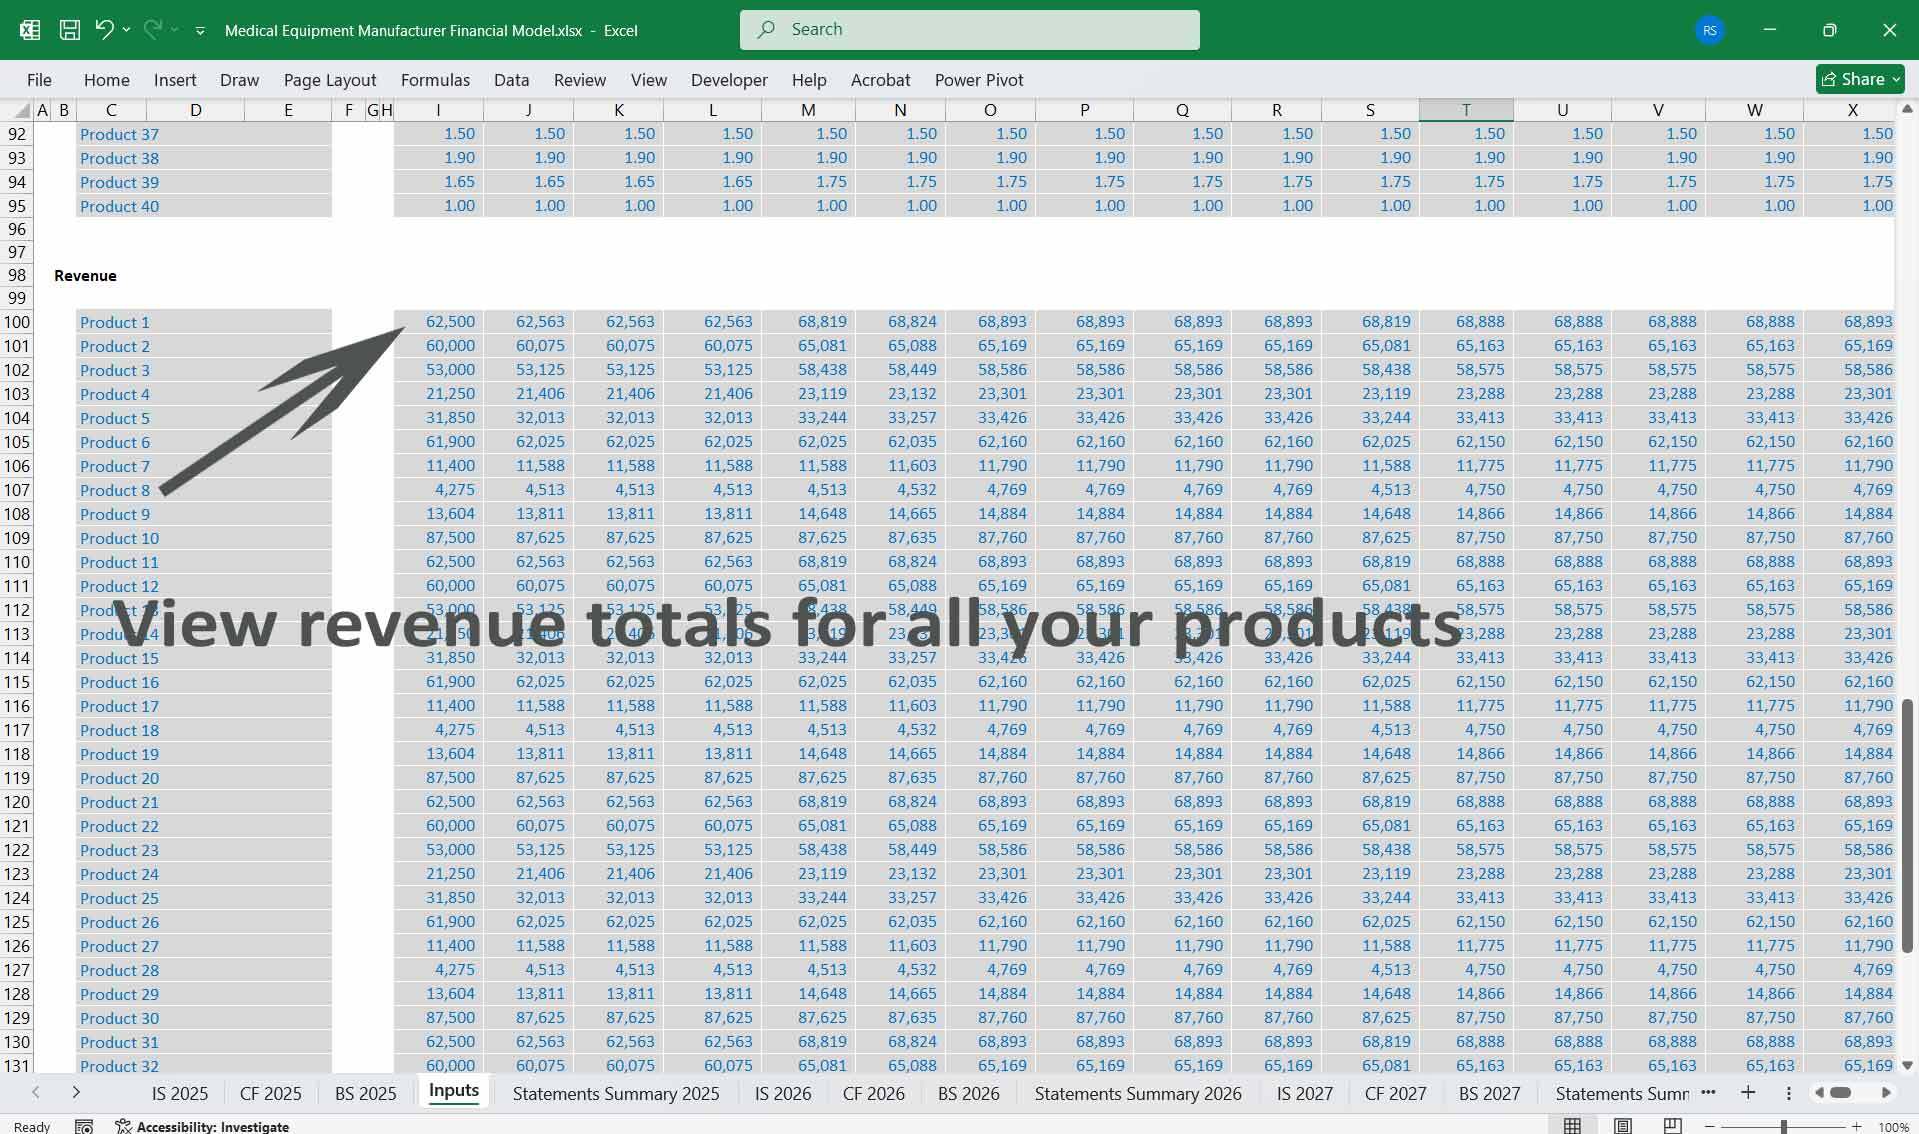
Revenue Streams
- Product Sales Revenue:
- Sale of medical equipment across the product lines.
- Examples: Diagnostic devices, surgical instruments, monitoring systems, and hospital furniture.
- Pricing varies by product complexity and market demand.
- 80-Product Line Scenario: Extra space for high-end and niche devices (e.g., AI-powered monitors, robotic surgical systems).
- Service Revenue:
- Installation, training, and maintenance contracts.
- Parts and Consumables:
- Track revenue from consumables or replacement parts (e.g., filters, sensors, test cartridges).
- Direct Material Costs:
- Raw materials specific to each product line, such as metals, plastics, and electronics.
- Direct Labor Costs:
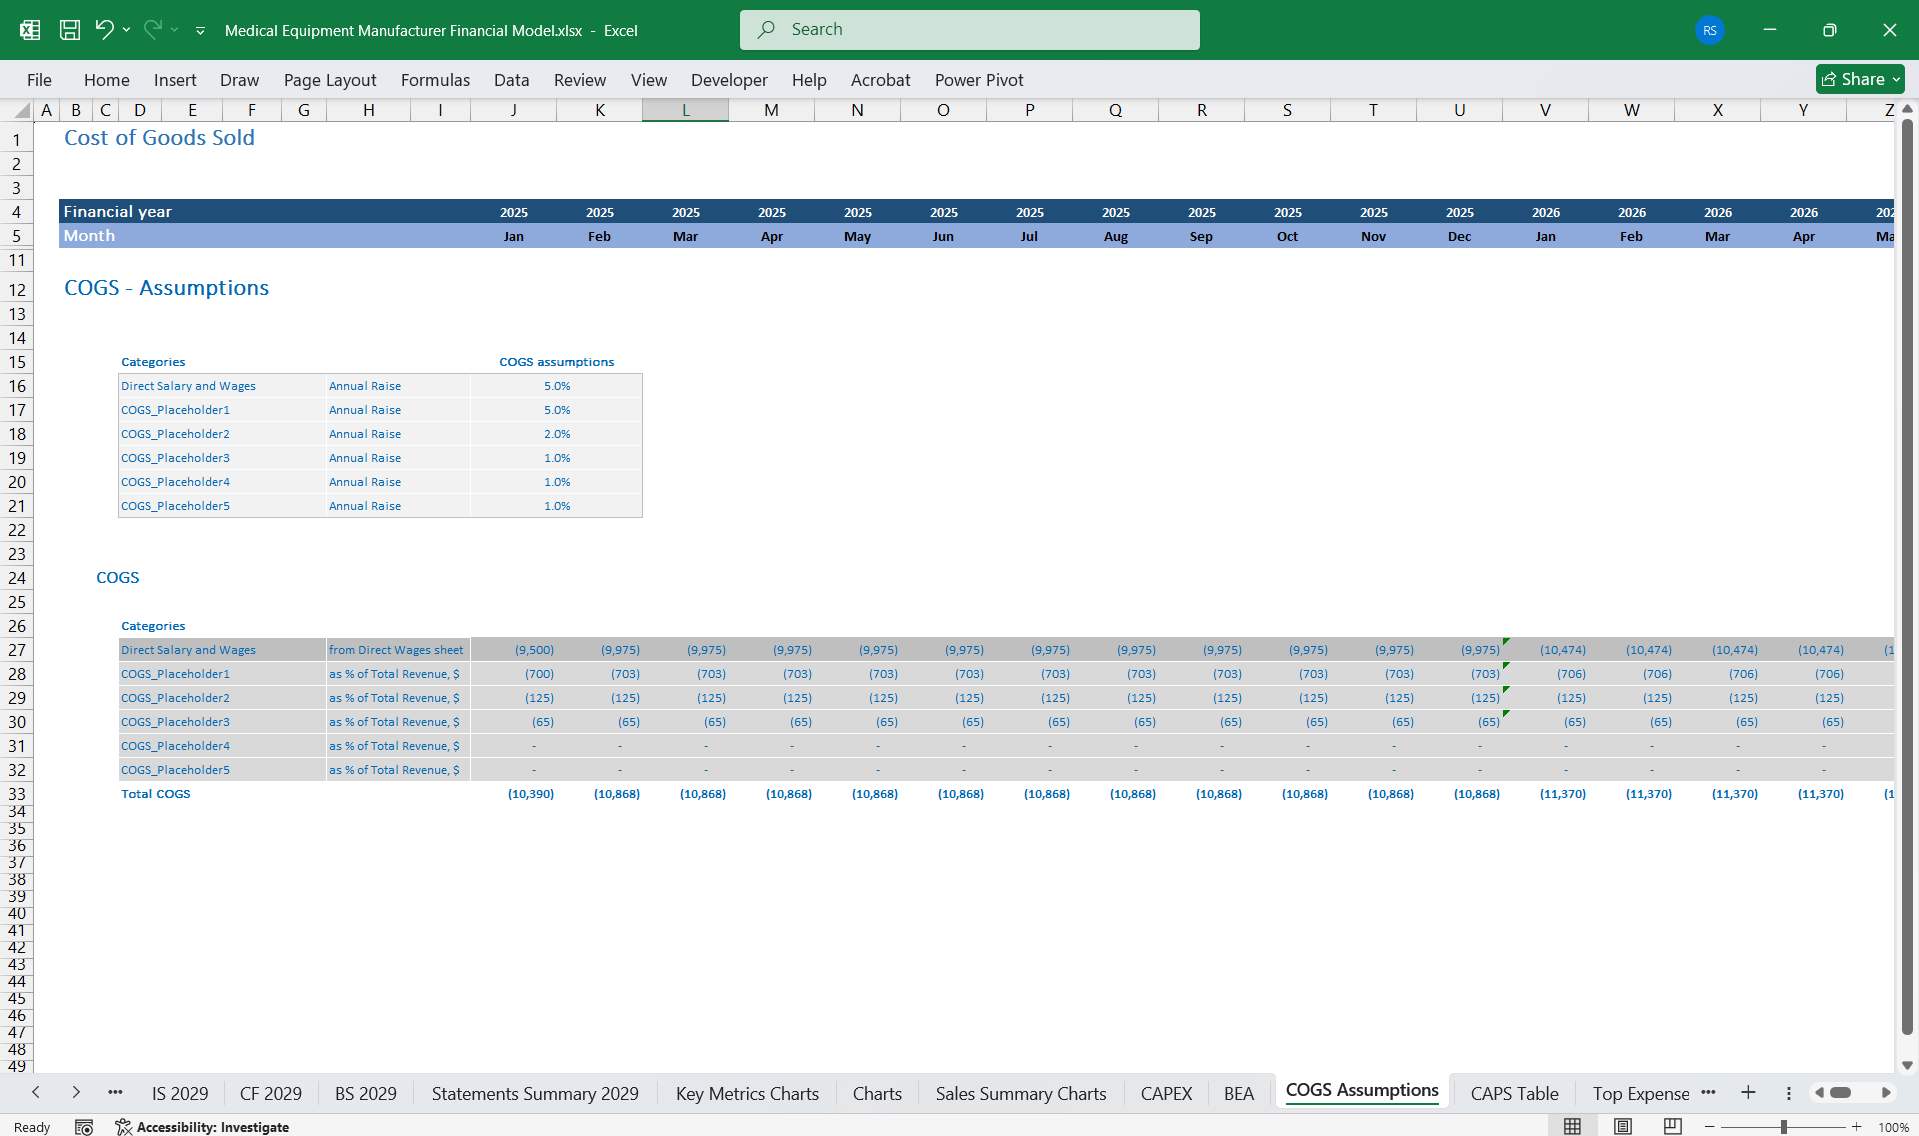
- Assembly line wages and specialized technician costs.
- Factory Overheads:
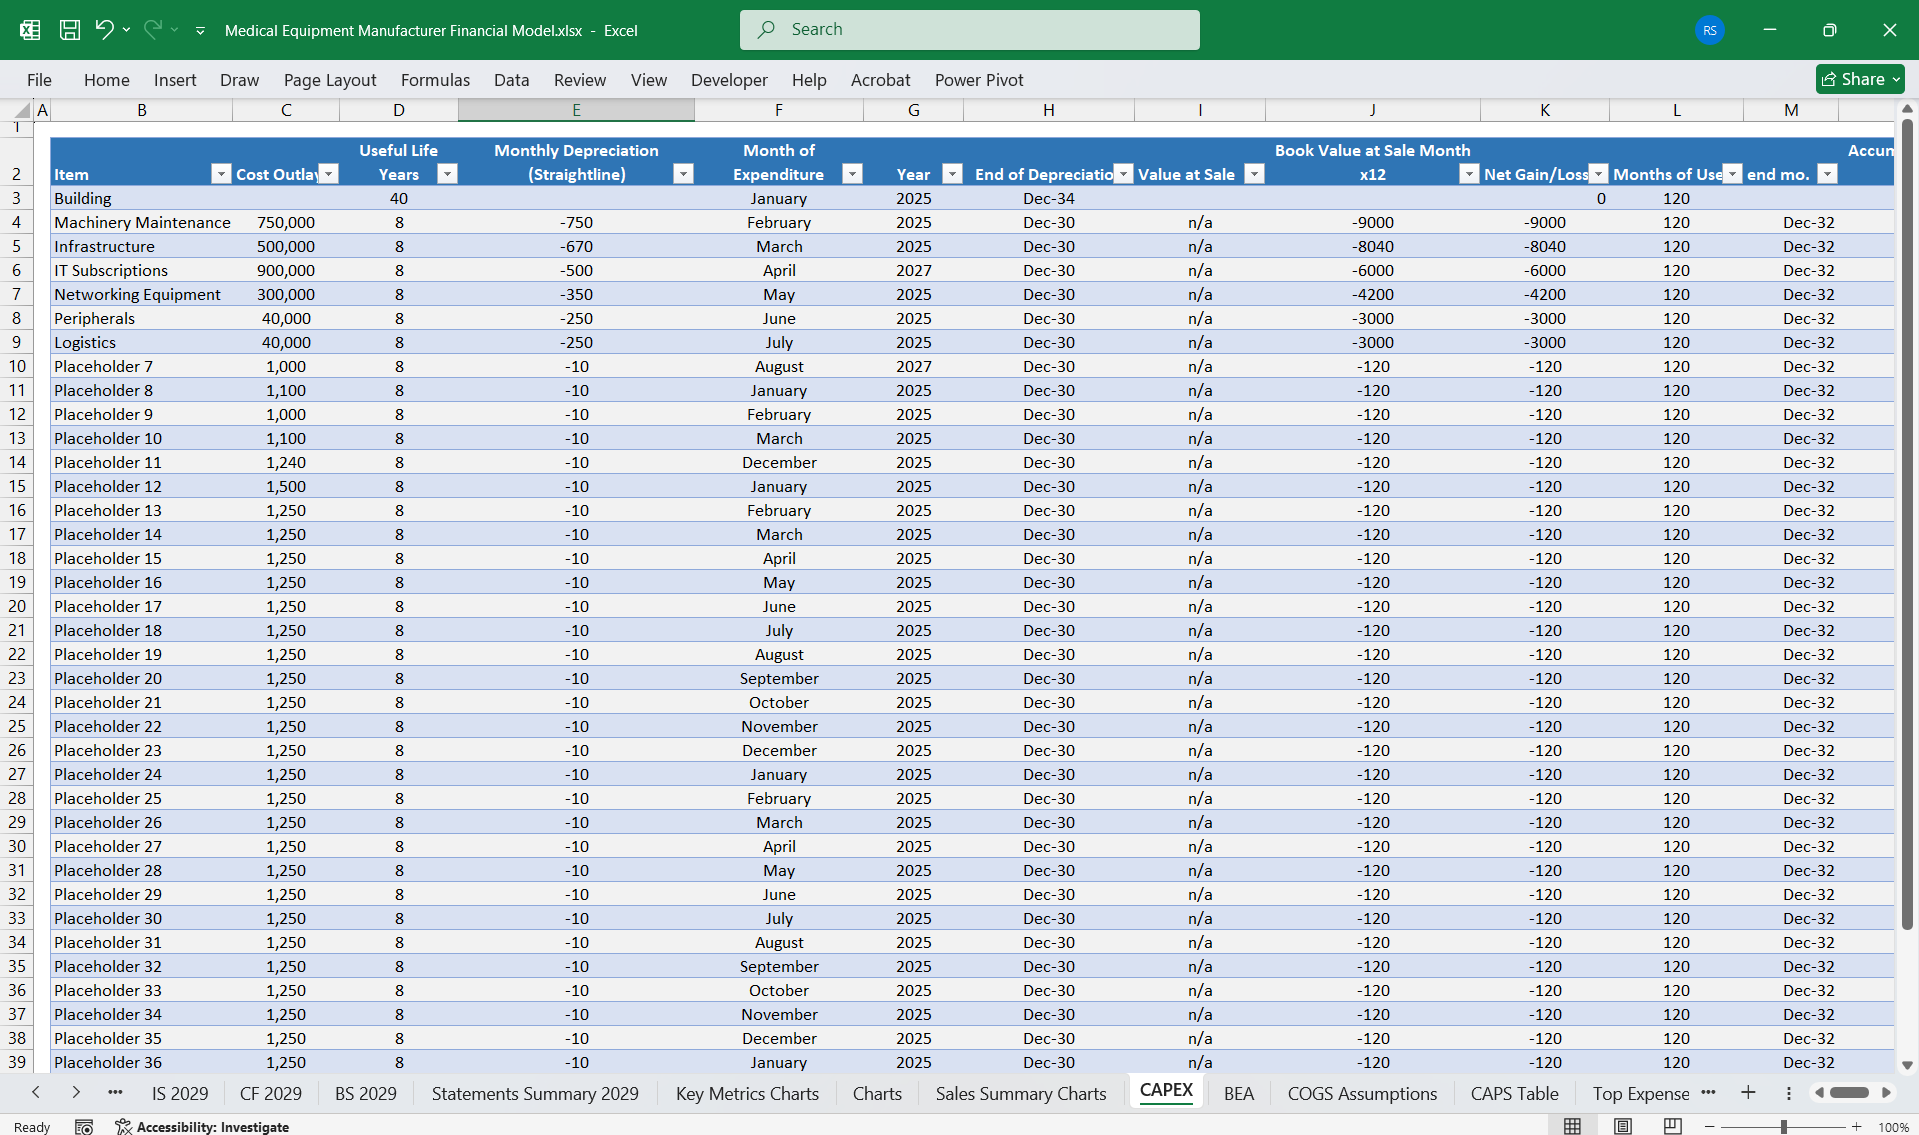
- Depreciation on manufacturing equipment, utilities, and quality assurance.
- Research and Development (R&D):
- New product innovation and design.
- Regulatory compliance costs for certifications (e.g., FDA, CE).
- Sales and Marketing:
- Costs for sales representatives, trade shows, and digital marketing.
- Administrative Expenses:
- Salaries for management and administrative staff.
- Software and office expenses.
- Gross Profit = Revenue – COGS.
- Operating Profit (EBIT) = Gross Profit – Operating Expenses.
- Net Income = EBIT – Taxes – Interest (if any).
Operating Activities
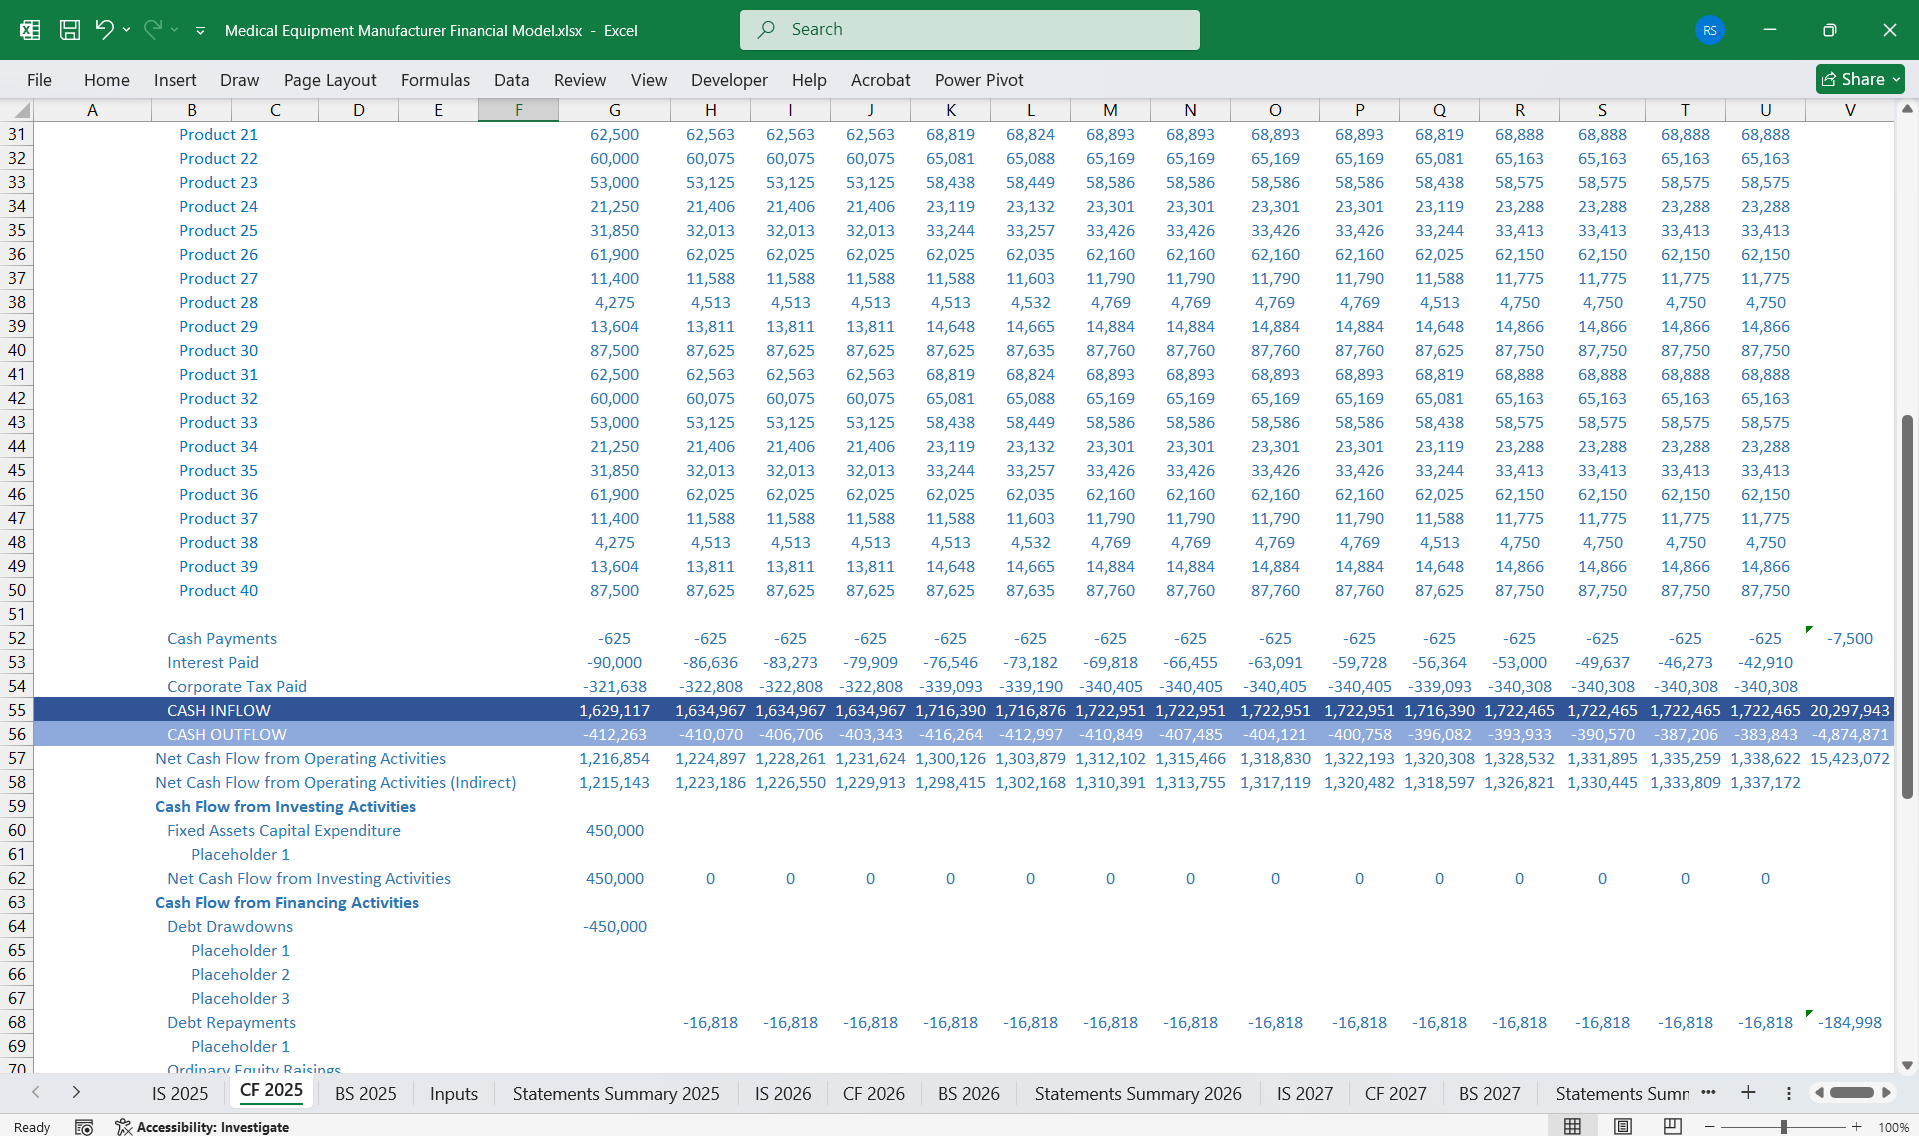
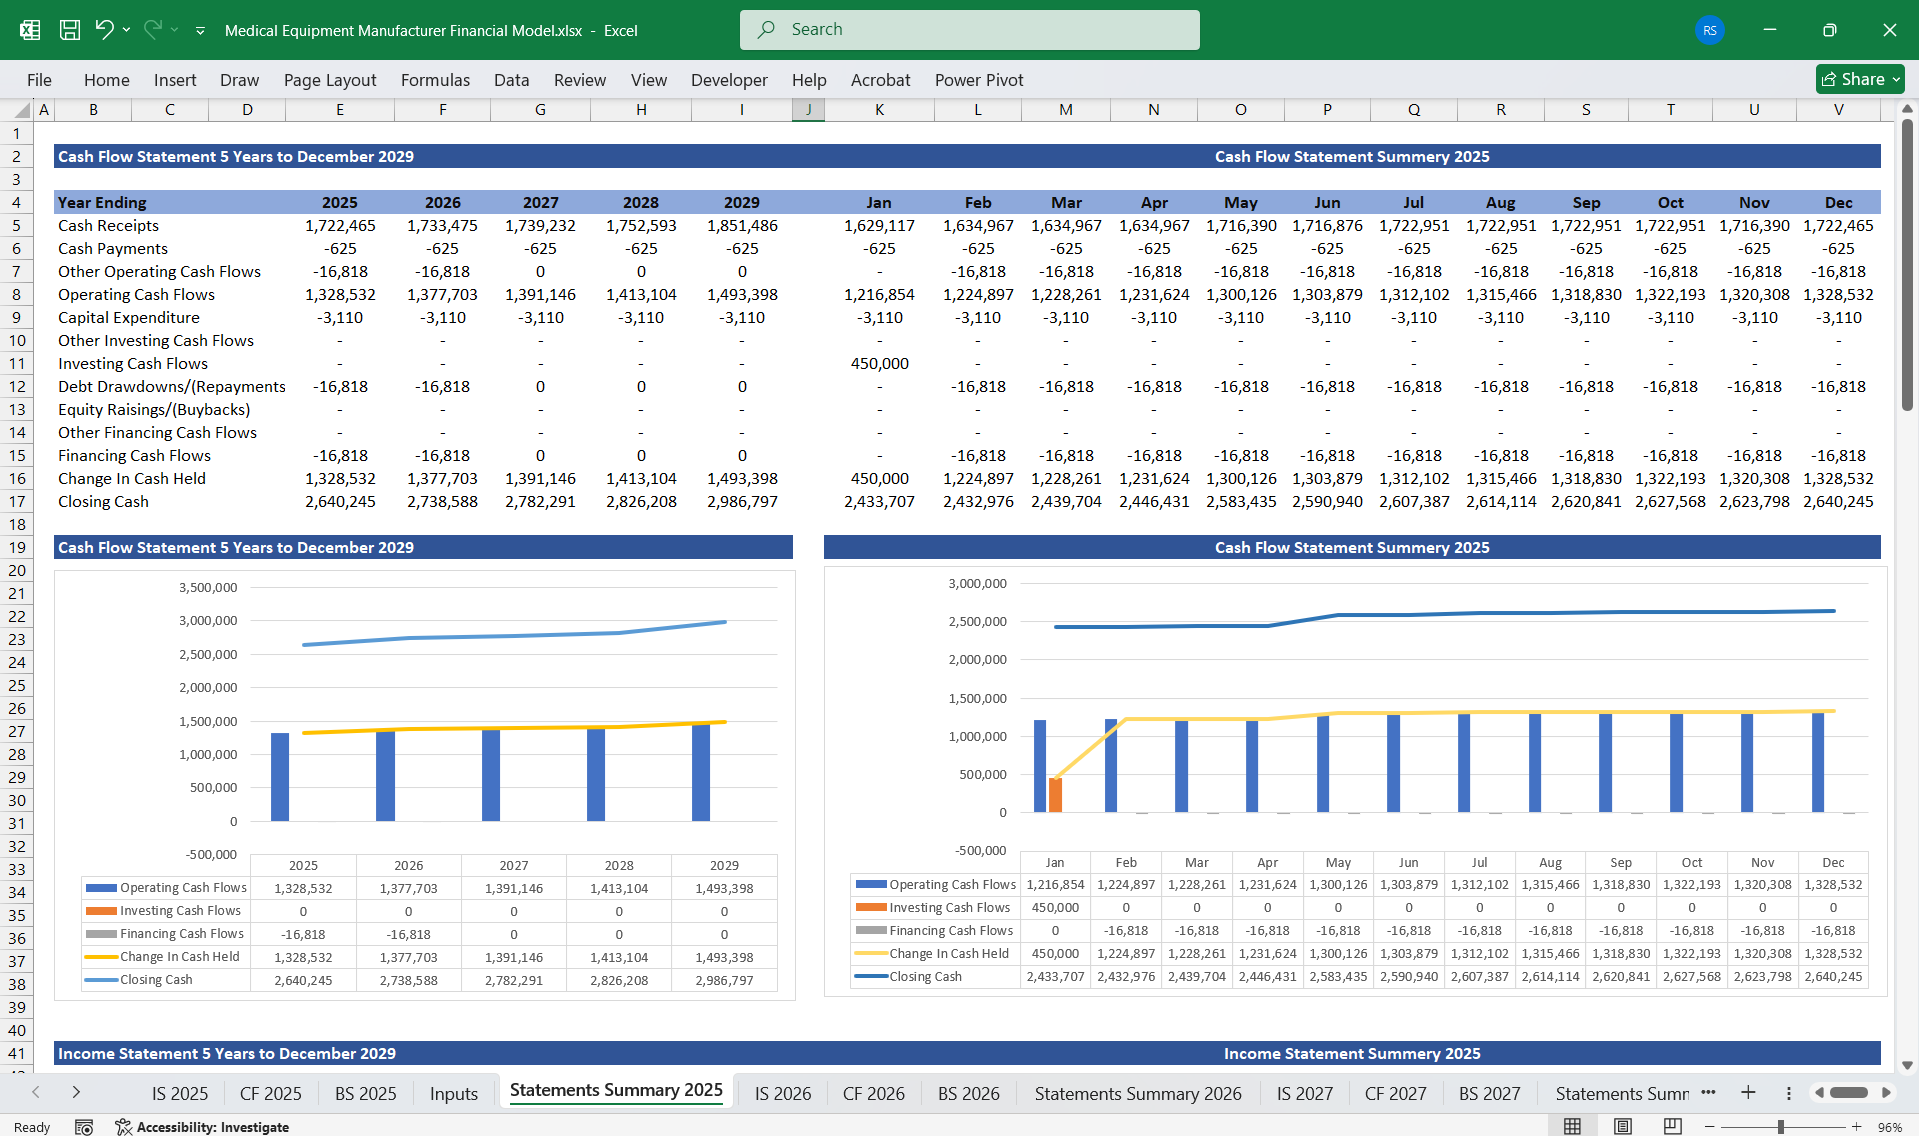
- Inflows:
- Product sales revenue.
- Maintenance contracts and service fees.
- Consumable sales.
- Outflows:
- Payment for raw materials and supplier bills.
- Salaries and factory costs.
- Marketing and R&D expenses.
- Inflows:
- Sale of old equipment or facilities.
- Outflows:
- New machinery and production lines.
- Development of proprietary manufacturing technology (e.g., 3D printing for parts).
- Inflows:
- Debt financing or issuance of equity for new production expansion.
- Outflows:
- Loan repayments.
- Dividend distributions to shareholders.
- Free Cash Flow = Net Operating Cash – Capital Expenditures.
- Operating Cash Flow Coverage Ratio = Operating Cash Flow / Total Debt.
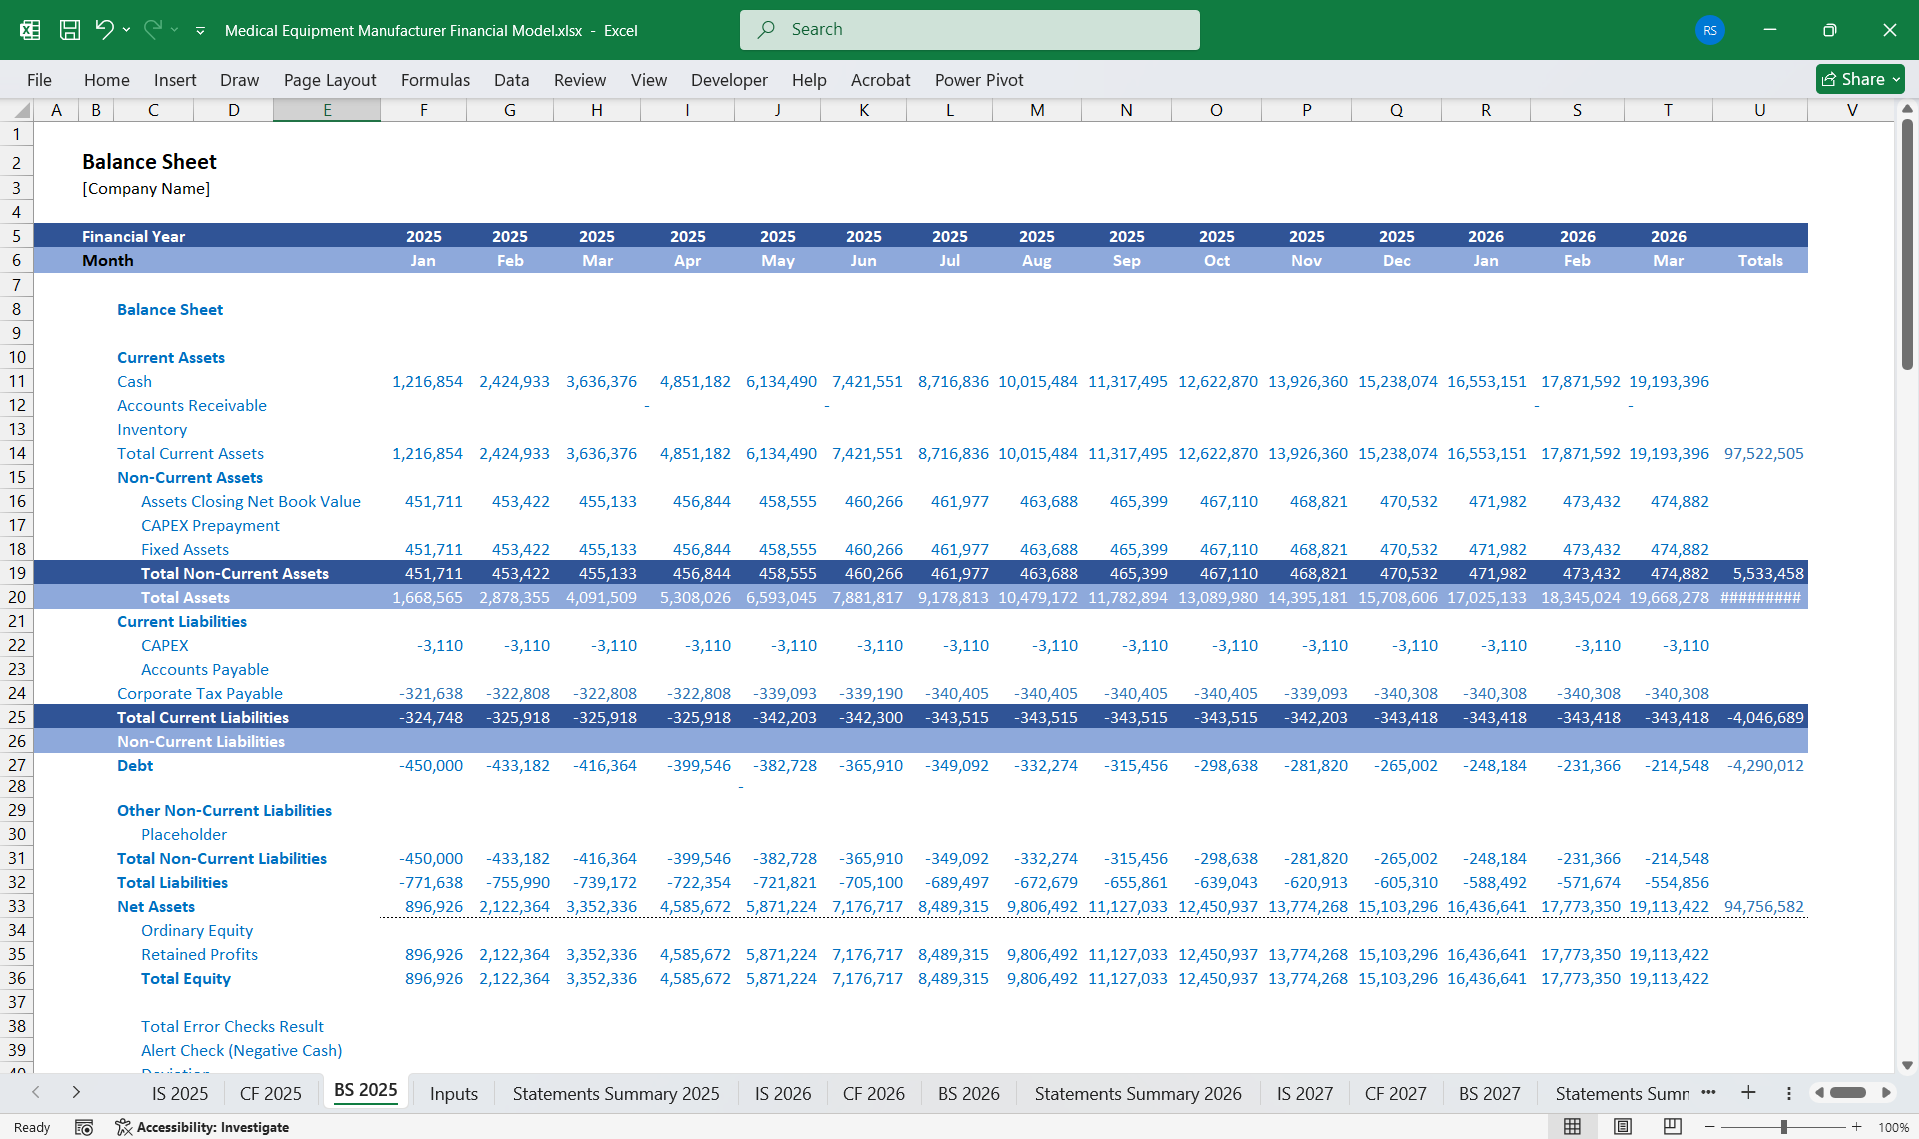
Assets
- Current Assets:
- Cash and cash equivalents.
- Accounts receivable (from hospital or distributor purchases).
- Inventory of raw materials, work-in-progress, and finished goods.
- Non-Current Assets:
- Manufacturing equipment and facilities.
- Intangible assets (patents, proprietary designs, trademarks).
- Current Liabilities:
- Accounts payable (due to suppliers).
- Accrued expenses (wages, utilities).
- Deferred revenue from advance payments.
- Non-Current Liabilities:
- Long-term loans or bonds issued for expansion.
- Retained earnings for reinvestment.
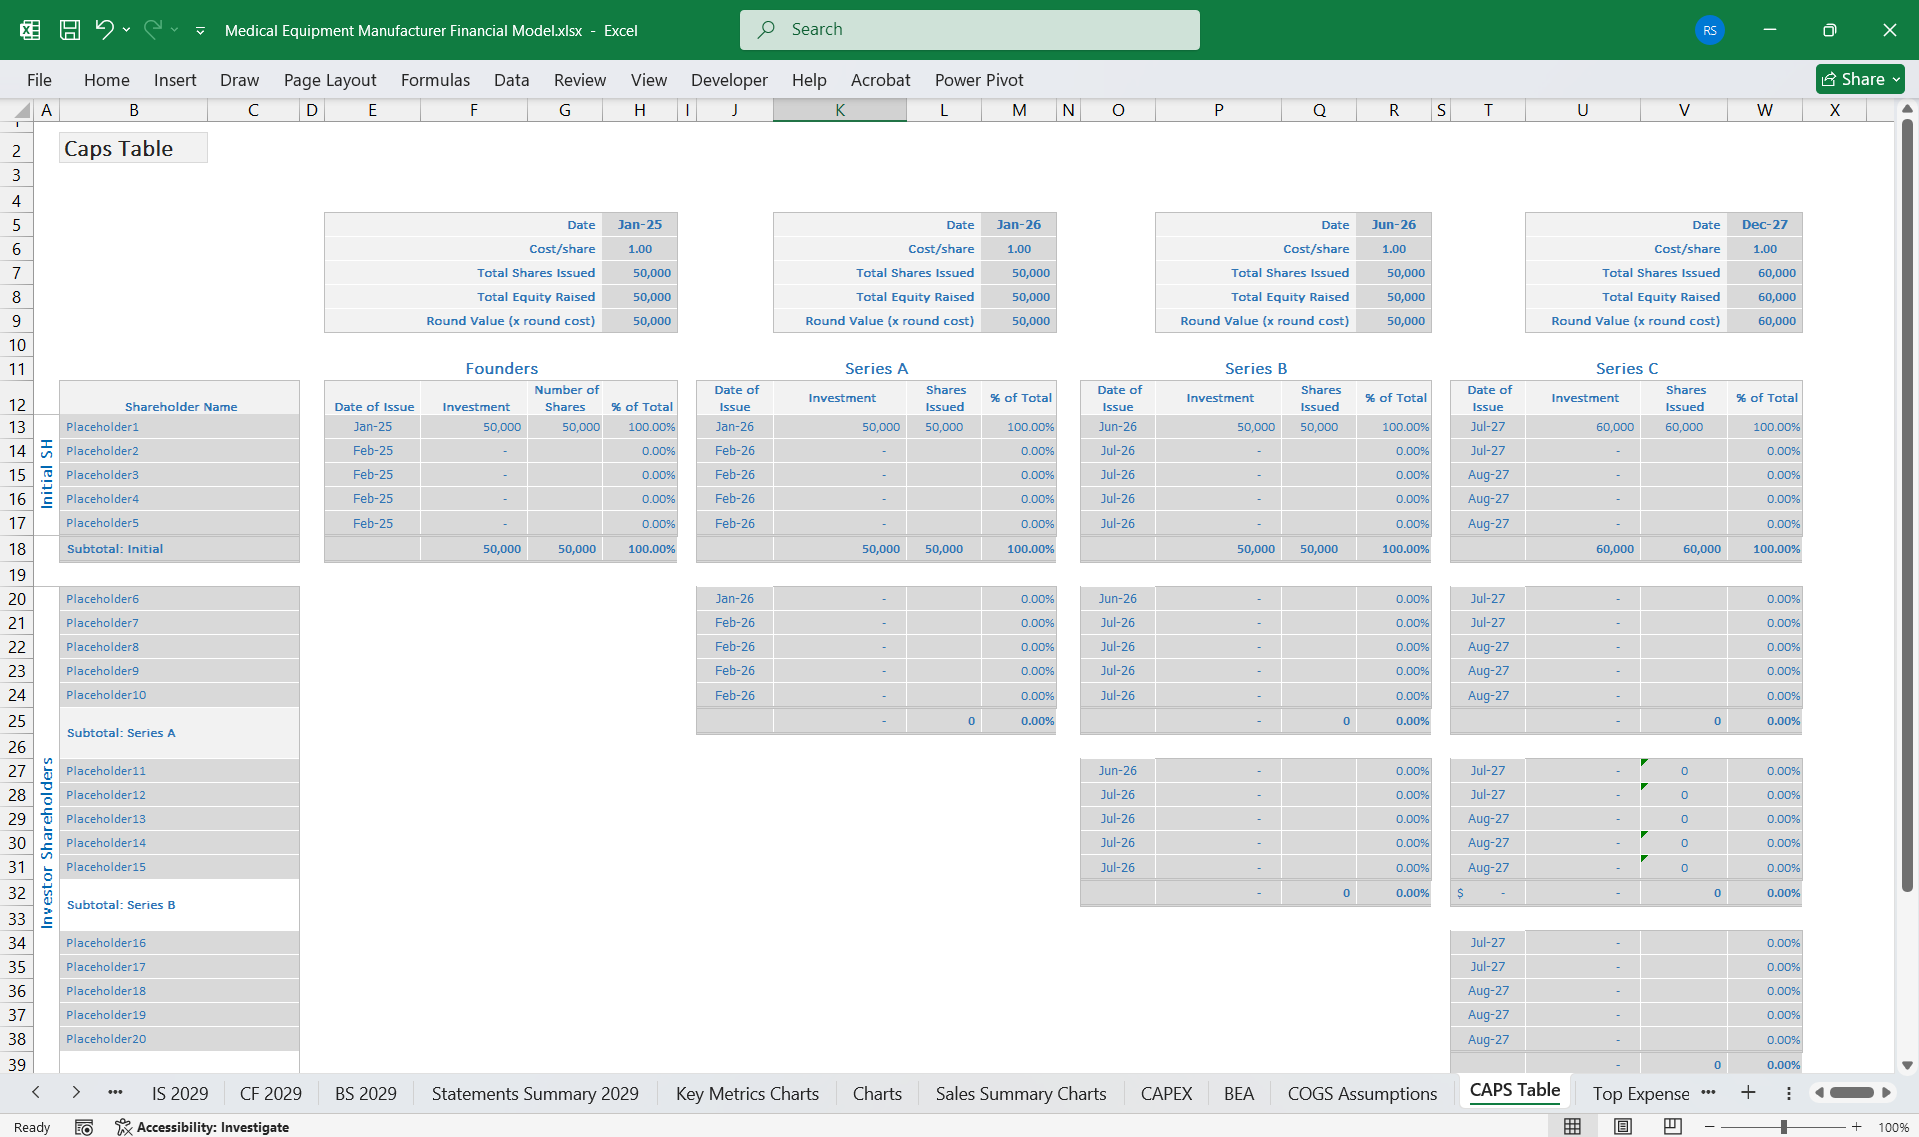
- Shareholder equity for external investors.
- Current Ratio = Current Assets / Current Liabilities.
- Debt-to-Equity Ratio = Total Liabilities / Shareholder Equity.
- Revenue Generation:
- Core product lines from the 80-line scenario, supplemented by niche, high-margin devices (e.g., robotic systems, AI-integrated monitors).
- Premium service revenue (customization, high-frequency maintenance).
- Significant growth in consumables revenue due to expanded product use.
- Cost Management:
- Higher R&D and regulatory costs for specialized equipment.
- Larger overhead due to increased complexity in manufacturing and distribution.
- Target Audience:
- Large hospital chains, research institutions, and international distributors.
- Margin Projections:
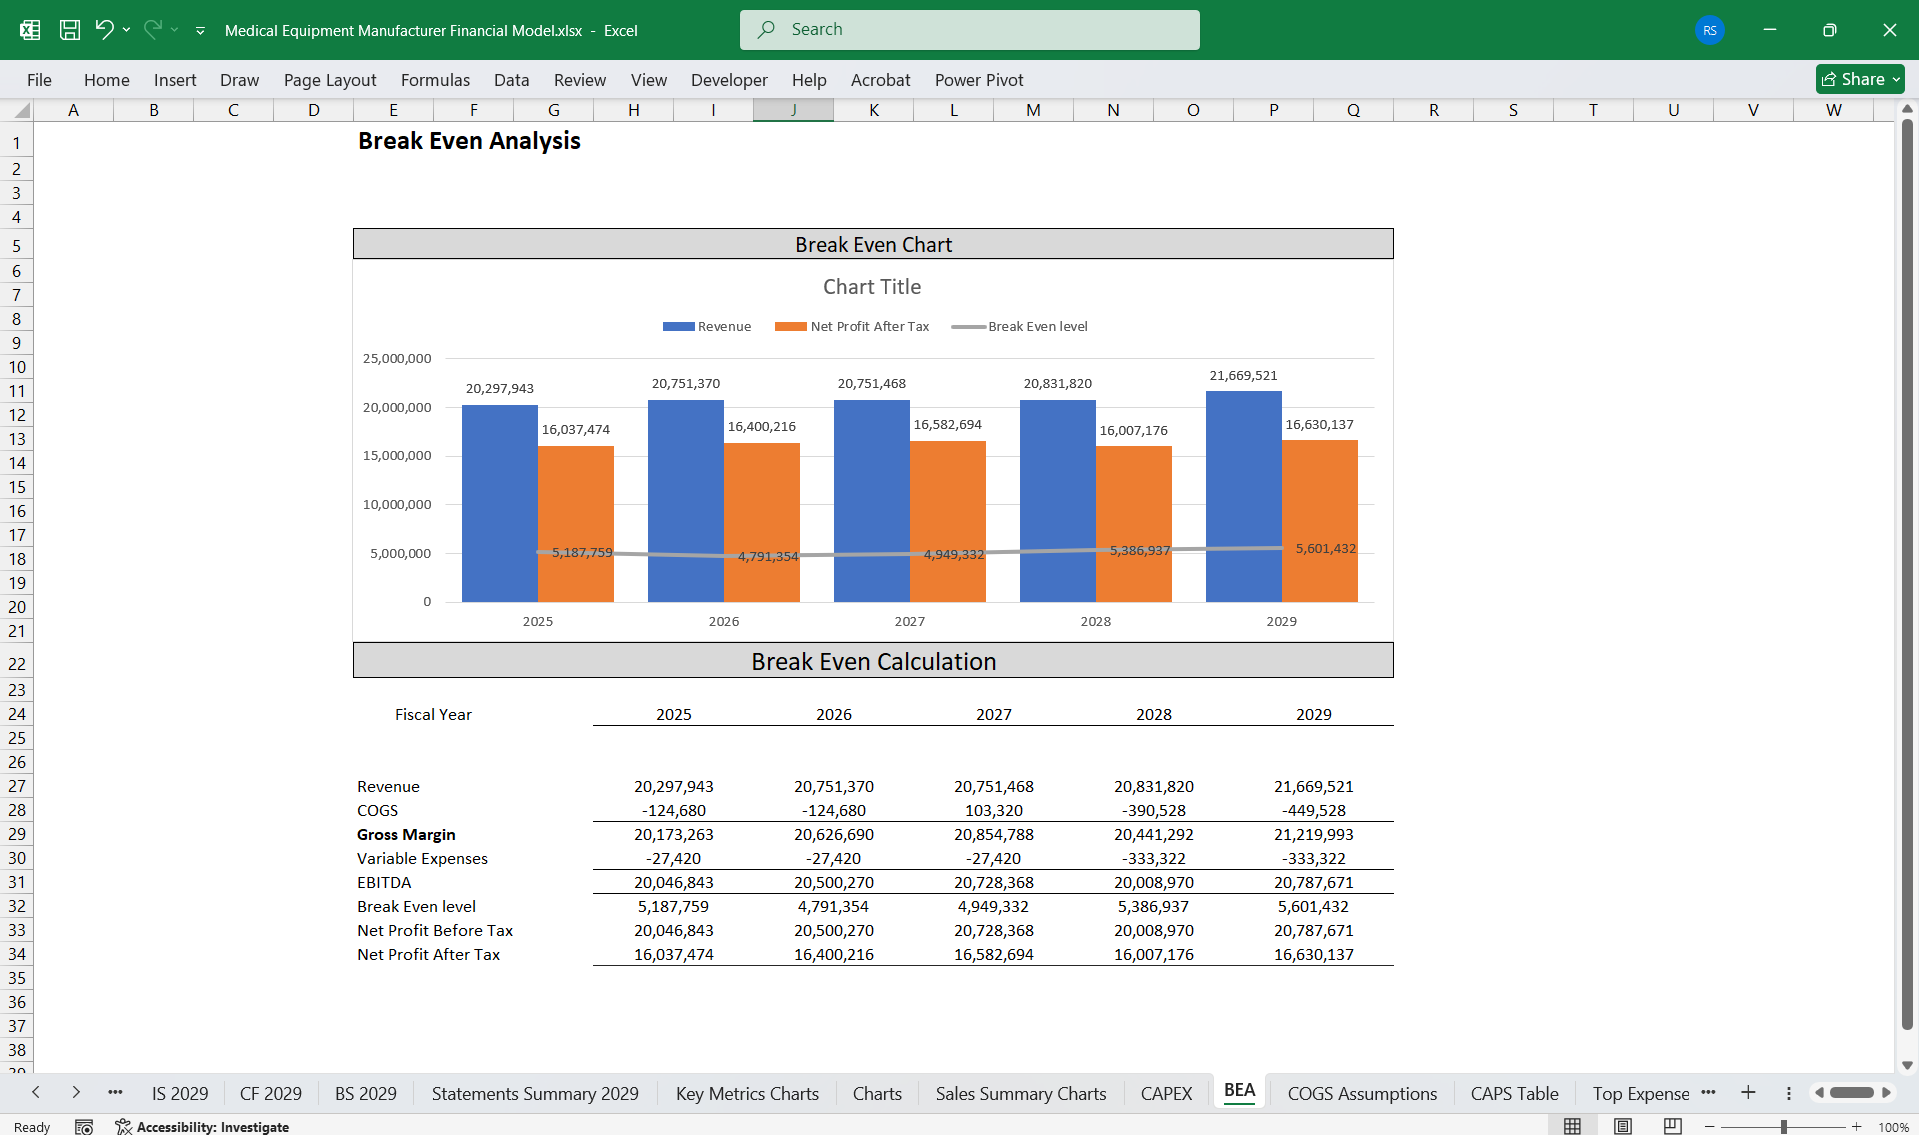
- Gross Margin: ~45-60%, driven by premium pricing.
- Net Margin: ~15-20% due to economies of scale and premium pricing offsetting higher expenses.
- Production Metrics:
- Cost-per-unit by product line.
- Manufacturing efficiency: Output vs. capacity utilization.
- Sales Metrics:
- Revenue breakdown: Standard vs. premium lines.
- Market share and segment penetration.
- Profitability Metrics:
- Gross margin by product line.
- R&D efficiency: Revenue from products launched in the last 5 years.
- Scalability Metrics:
- Revenue per new product line added.
- Operating leverage: Operating Expense Change / Revenue Change.
This Best Practice includes
1 Excel Financial Model
Further information
Provides thorough oversight, tracking, and reporting of Medical Equipment Manufacturer finances, including updates on budget utilisation and projections
