
Originally published: 31/01/2025 23:03
Publication number: ELQ-88755-1
View all versions & Certificate
Publication number: ELQ-88755-1
View all versions & Certificate

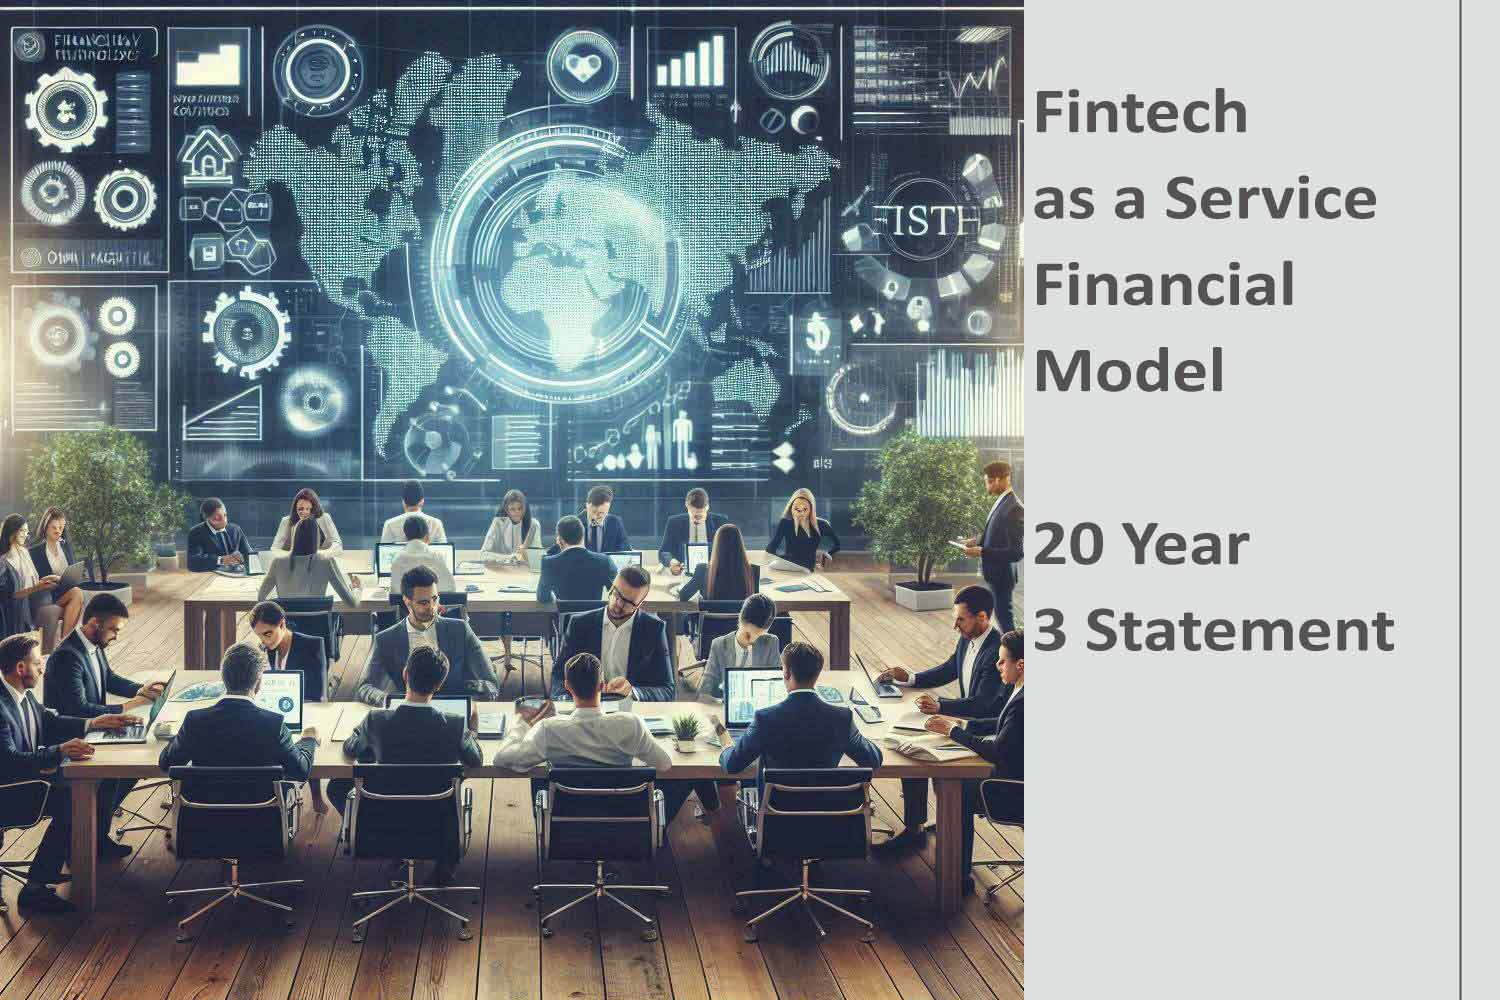
Fintech-as-a-Service (FaaS) Company Financial Model 20 Years 3 Statement
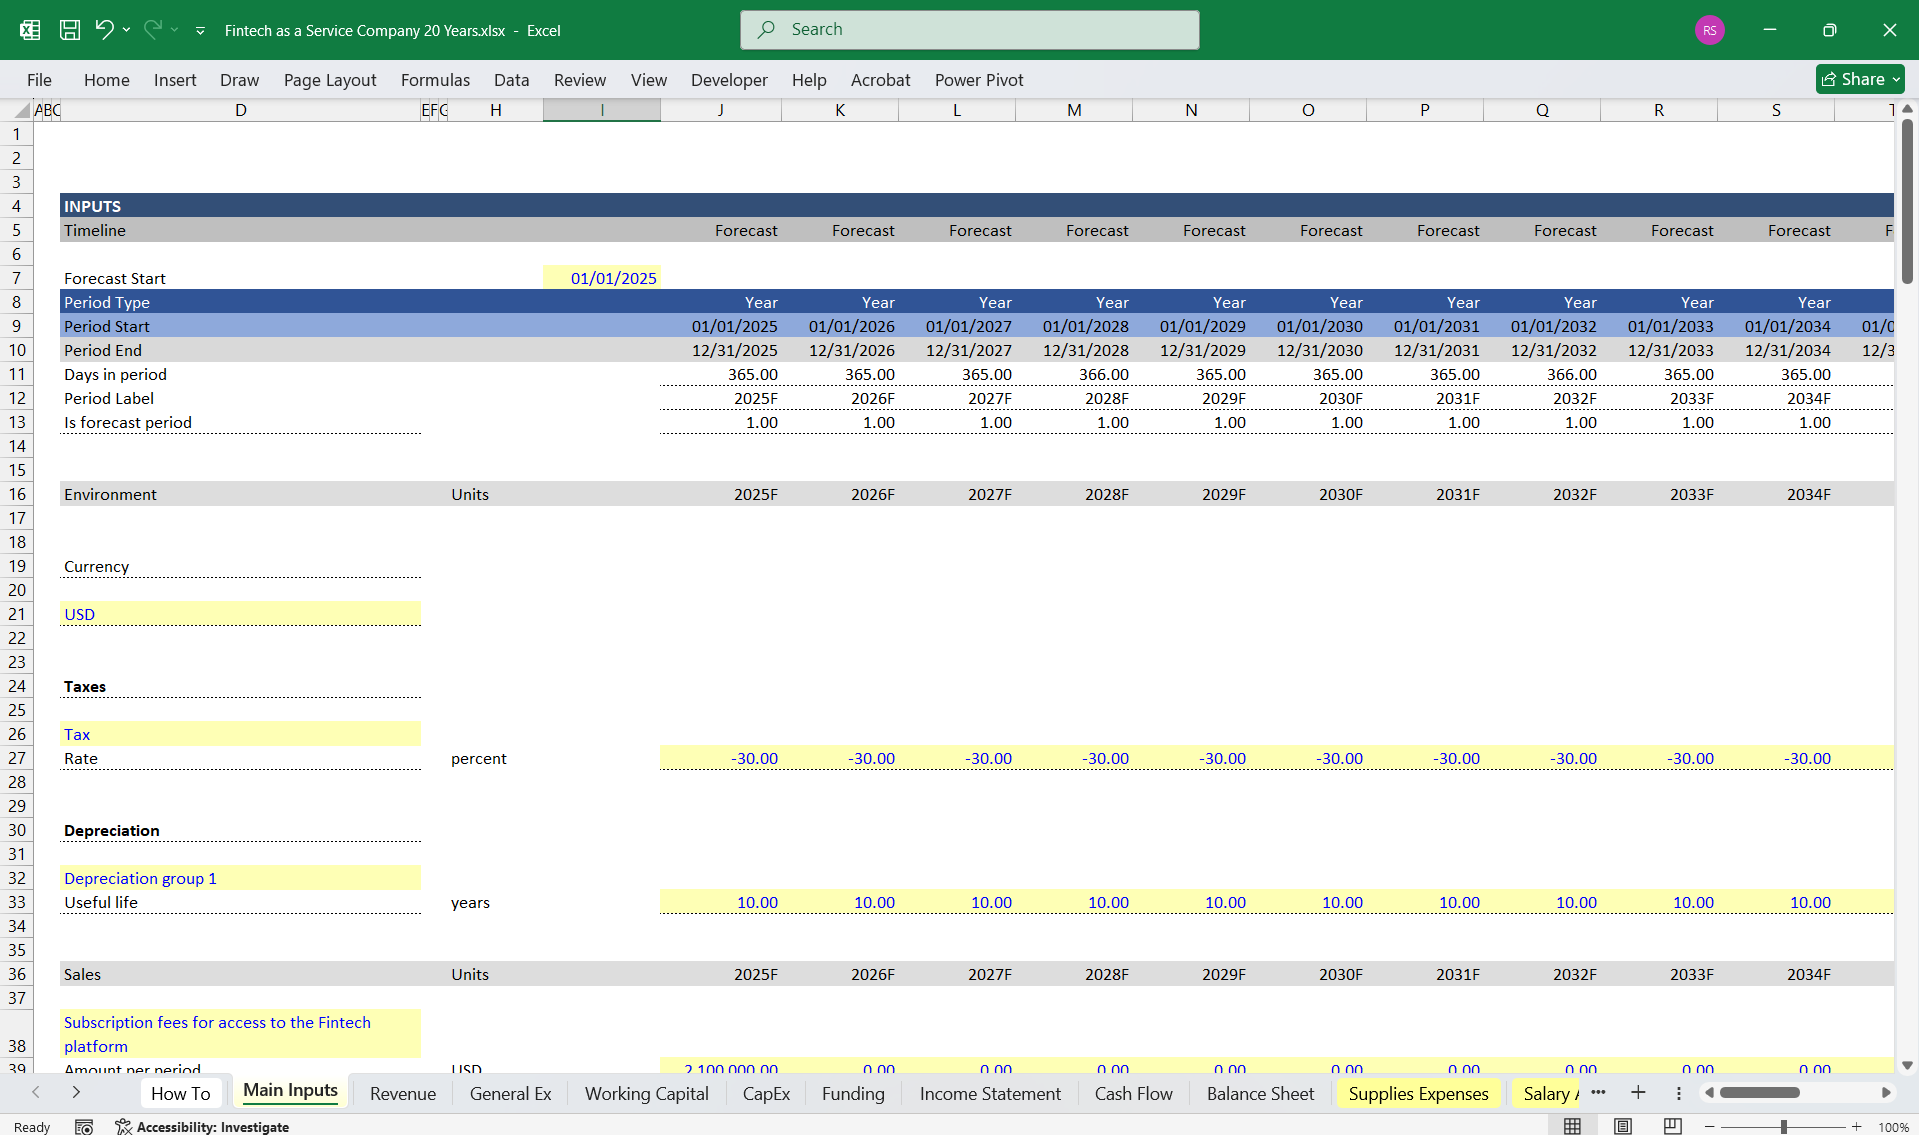
A comprehensive editable 20-year 3-statement, MS Excel spreadsheet for tracking a Fintech-as-a Service (FaaS) Company finances.
 by AllFinancialModels
AllFinancialModels offer a curated selection of high-quality yet financial model templates designed to support a wide range of business needs.Follow
fintechfaasfintech as a servicesoftware as a servicesaasspreadsheettemplateexcelfinancial modelfinance
Description
20-Year 3-Statement Financial Model for a Fintech as a Service (FaaS) Company.
1. Income StatementRevenue Streams: (All fully Editable)
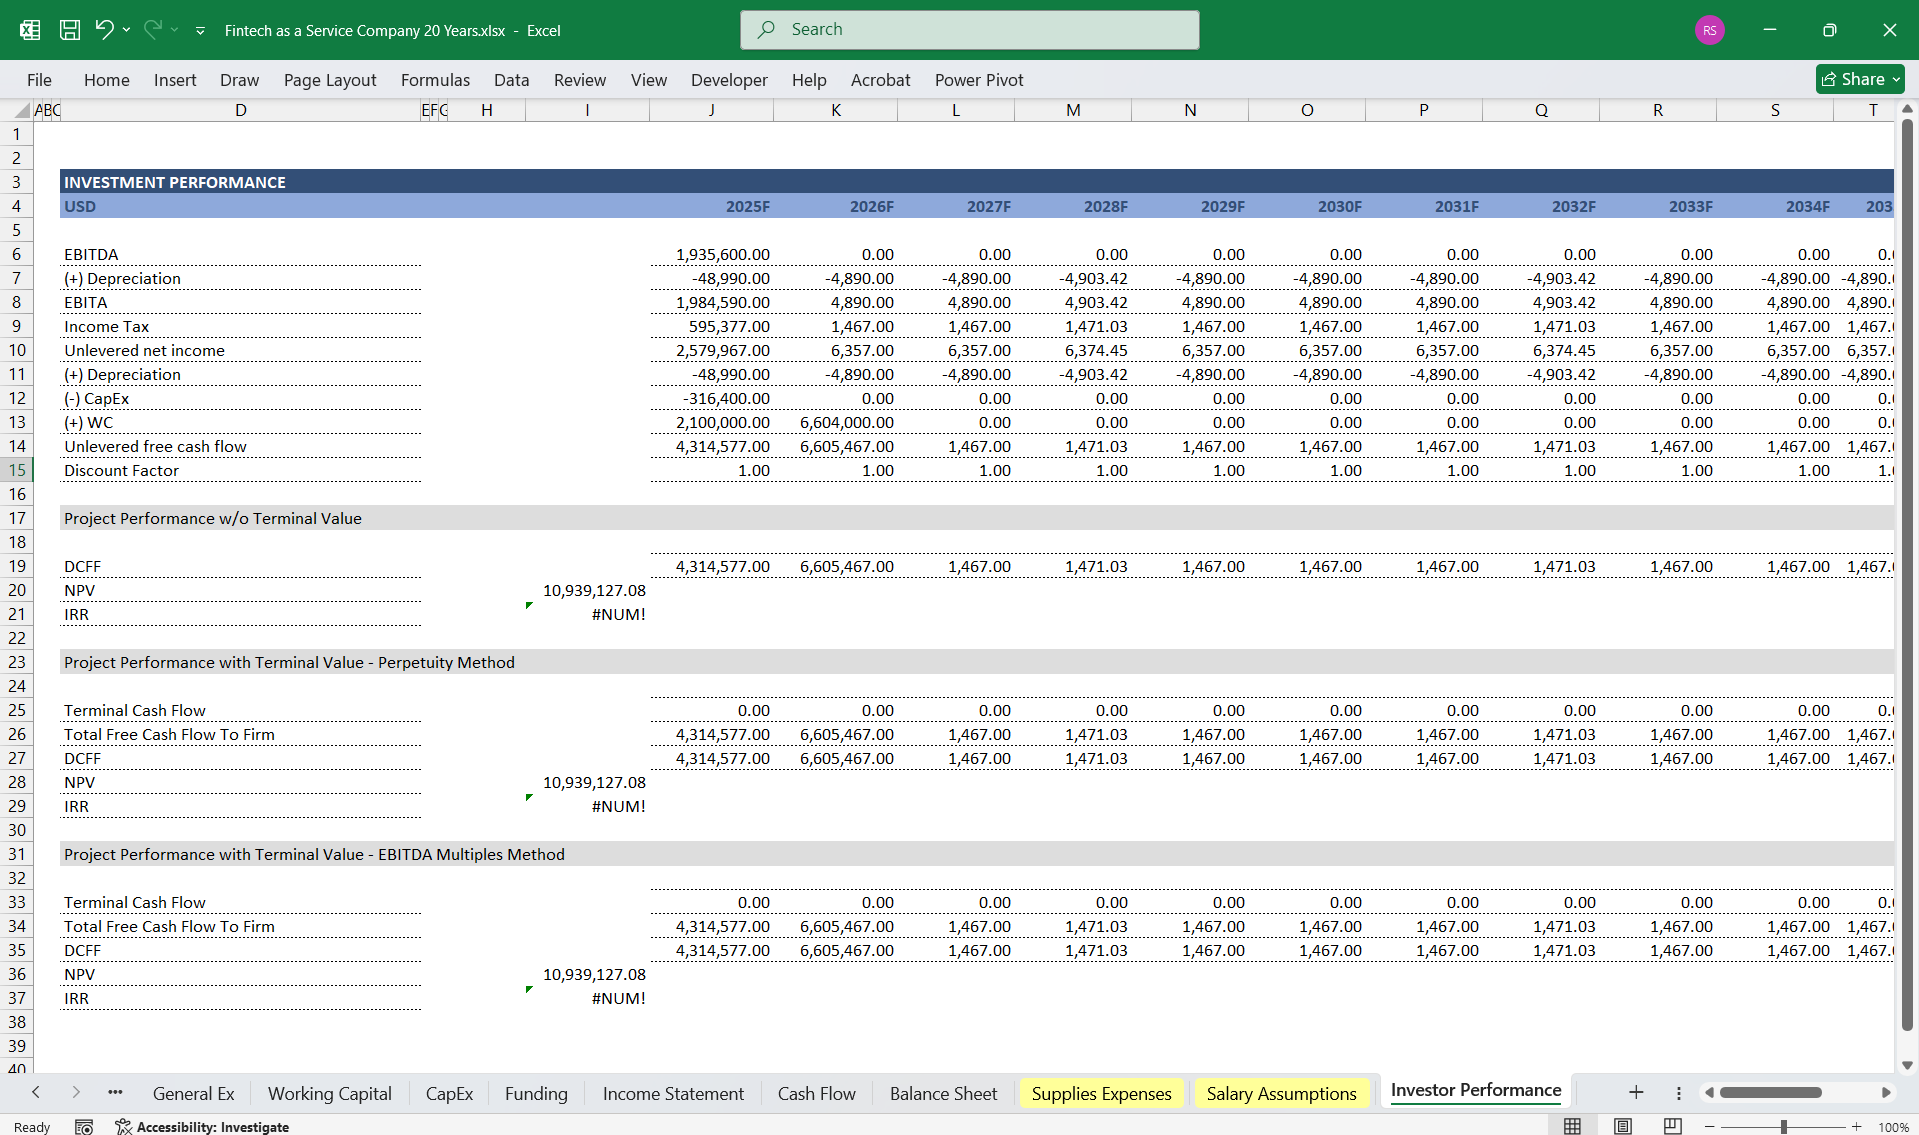
This detailed three-statement model provides a comprehensive 20-year financial projection for a Fintech as a Service company. It integrates various revenue streams and cost structures to support long-term financial planning and valuation.
20-Year 3-Statement Financial Model for a Fintech as a Service (FaaS) Company.
1. Income StatementRevenue Streams: (All fully Editable)
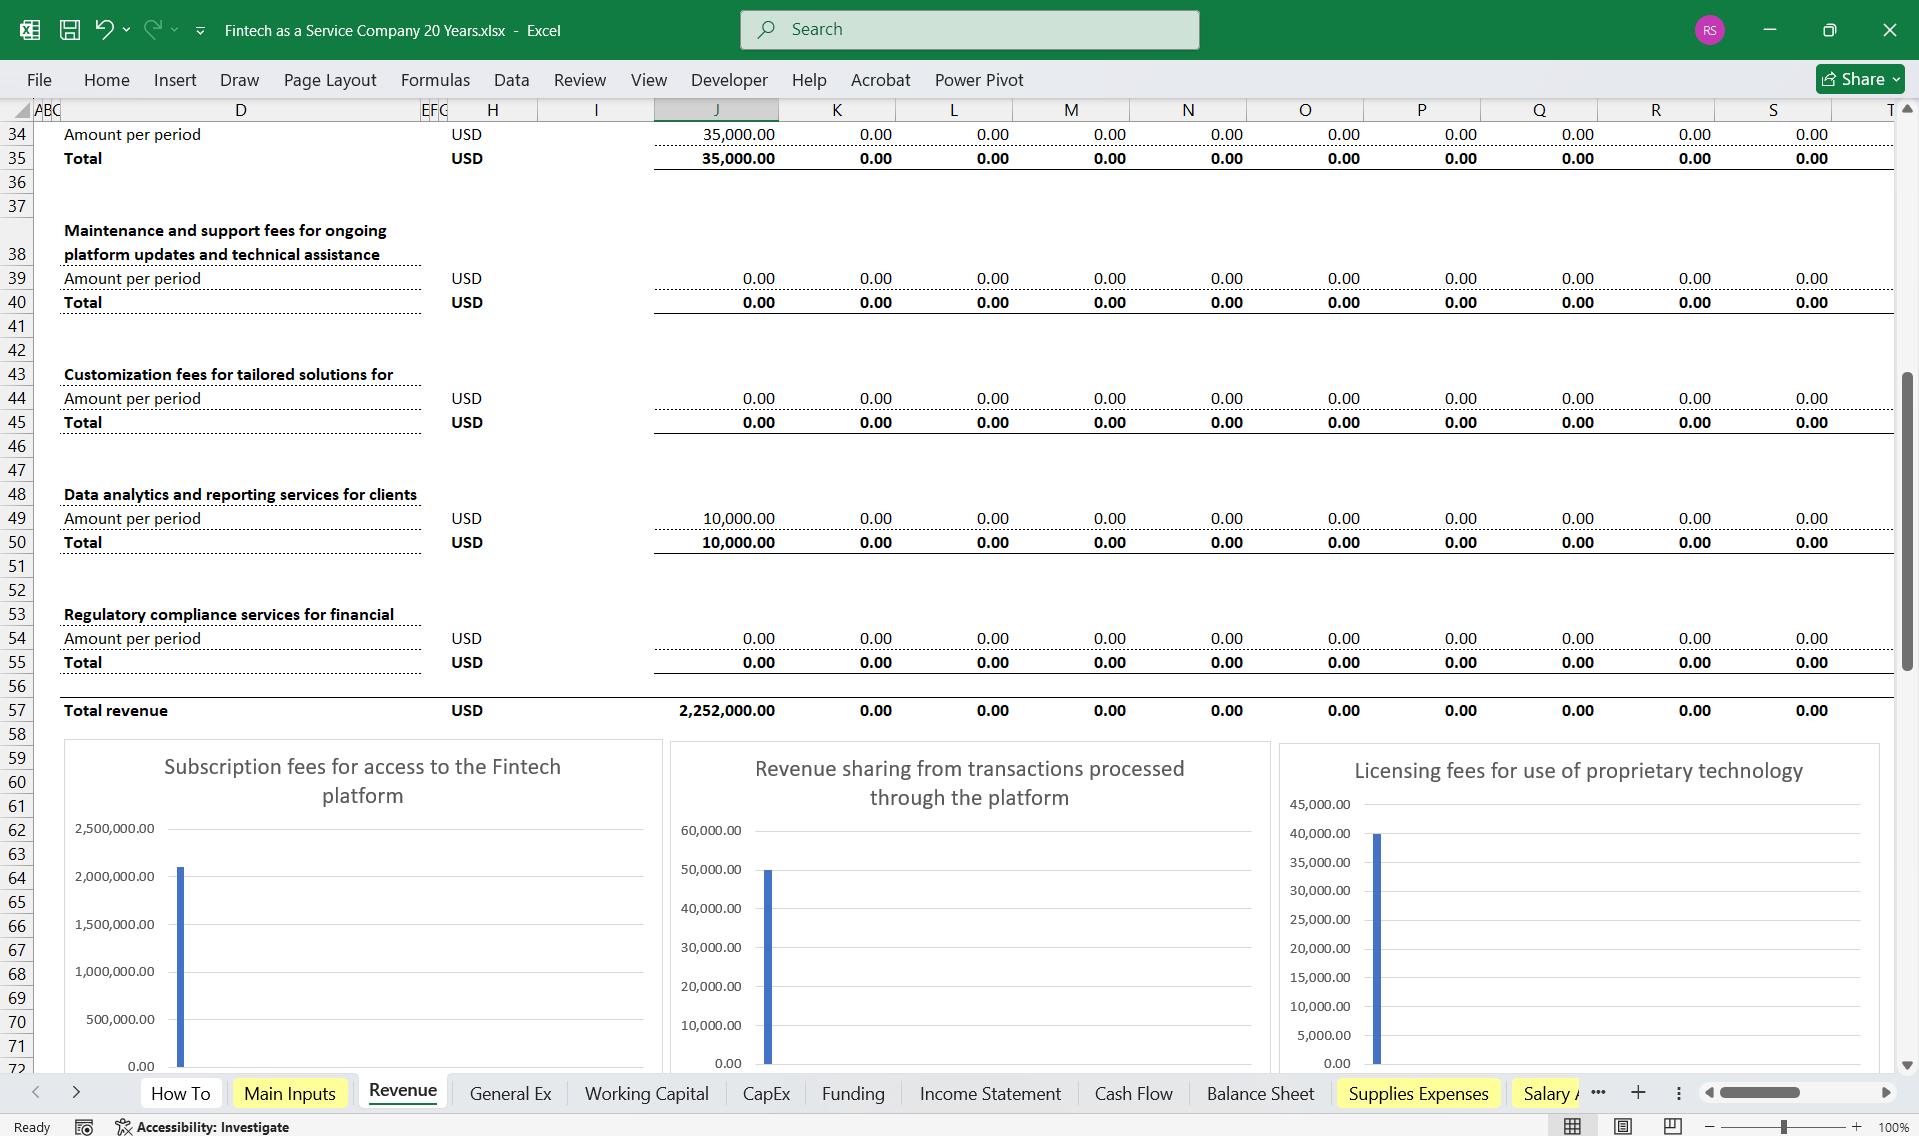
- Subscription Fees – Recurring revenue from clients subscribing to access the Fintech platform.
- Revenue Sharing – Percentage of transaction fees generated from payments processed through the platform.
- Licensing Fees – Charges for external entities utilizing proprietary technology.
- Consulting & Integration Services – Revenue from implementation, advisory, and integration work for clients.
- API Usage Fees – Charges based on API calls by third-party developers.
- Training & Onboarding Fees – One-time charges for onboarding new clients.
- Maintenance & Support Fees – Recurring revenue from ongoing platform updates and technical support.
- Customization Fees – One-time revenue from customized client solutions.
- Data Analytics & Reporting Services – Charges for advanced data insights provided to clients.
- Regulatory Compliance Services – Revenue from regulatory compliance support for financial institutions.
- Cost of Goods Sold (COGS) – Hosting costs, third-party service fees, transaction costs.
- Research & Development (R&D) – Investments in platform enhancements and innovation.
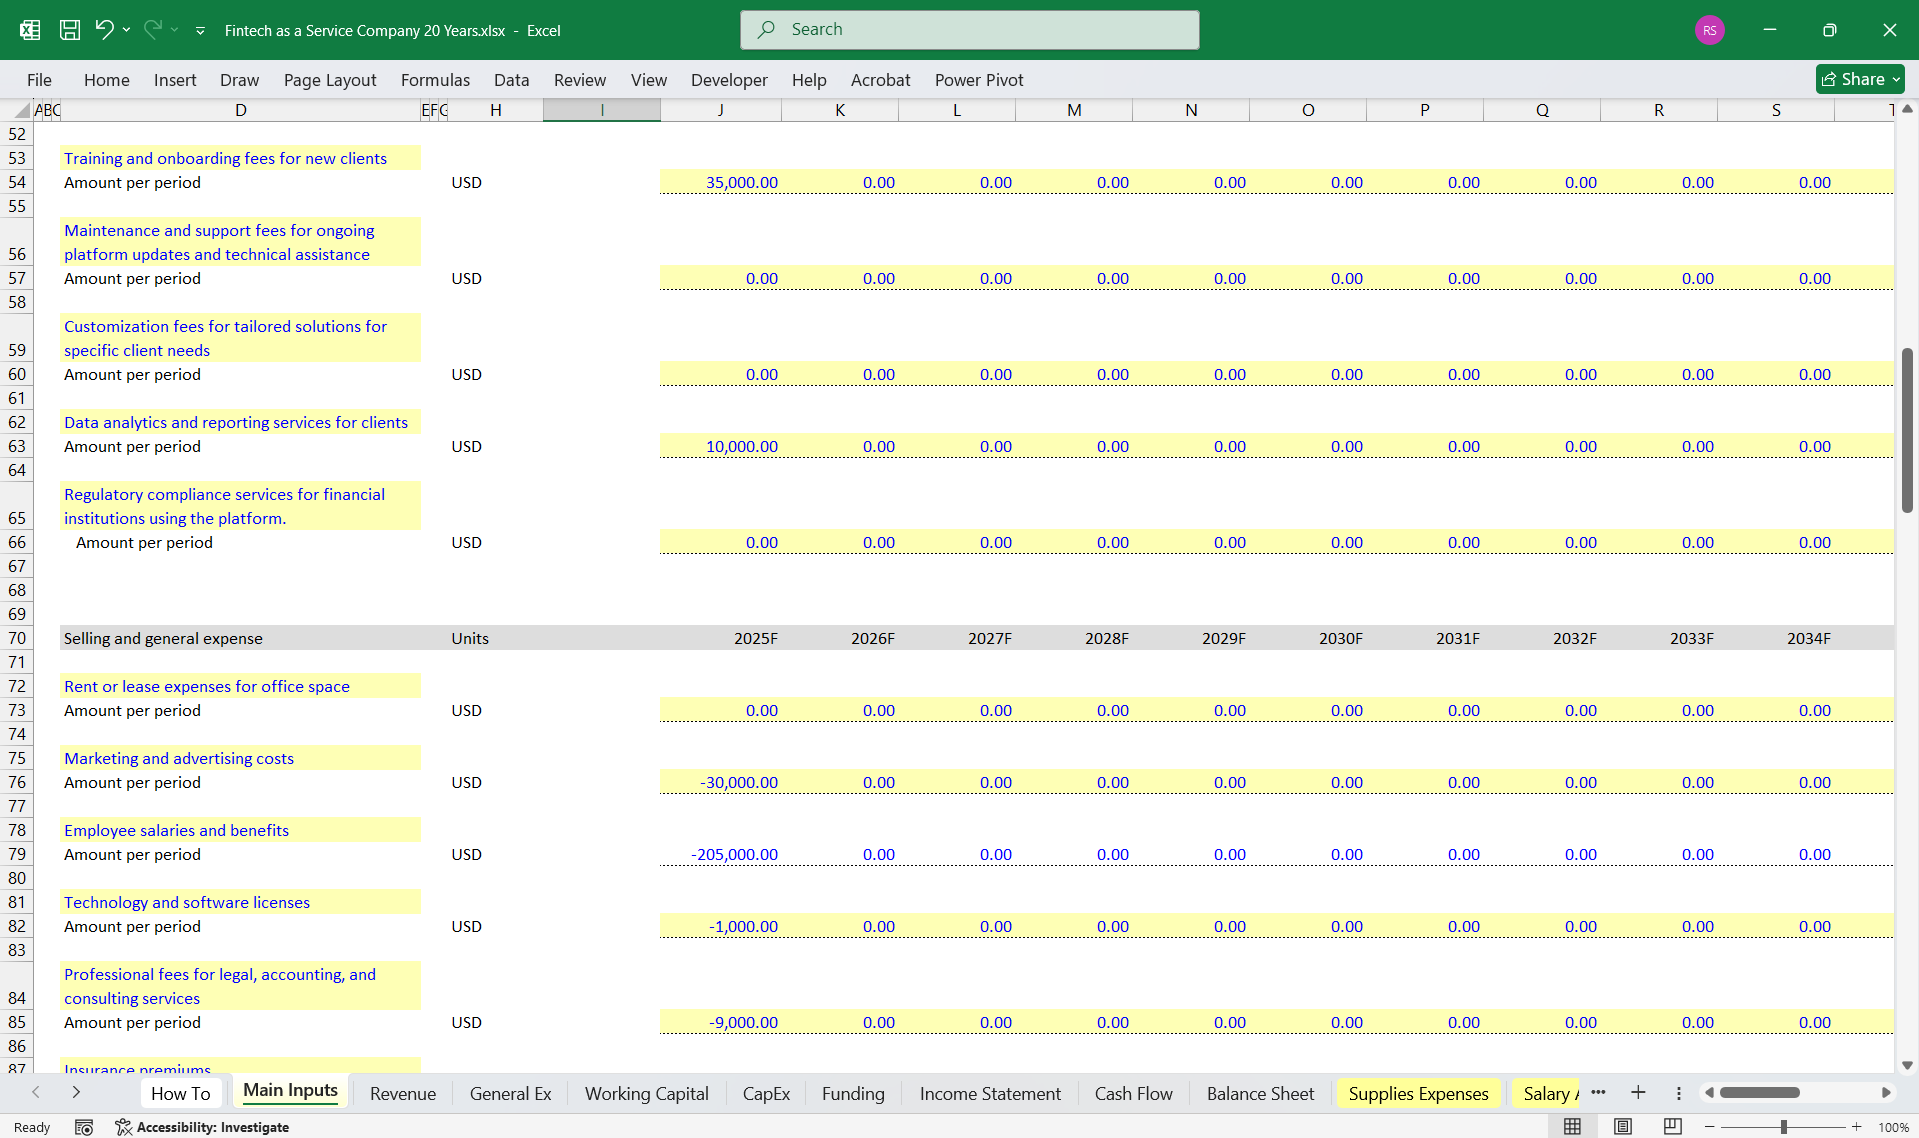
- Sales & Marketing – Customer acquisition, partnerships, and branding.
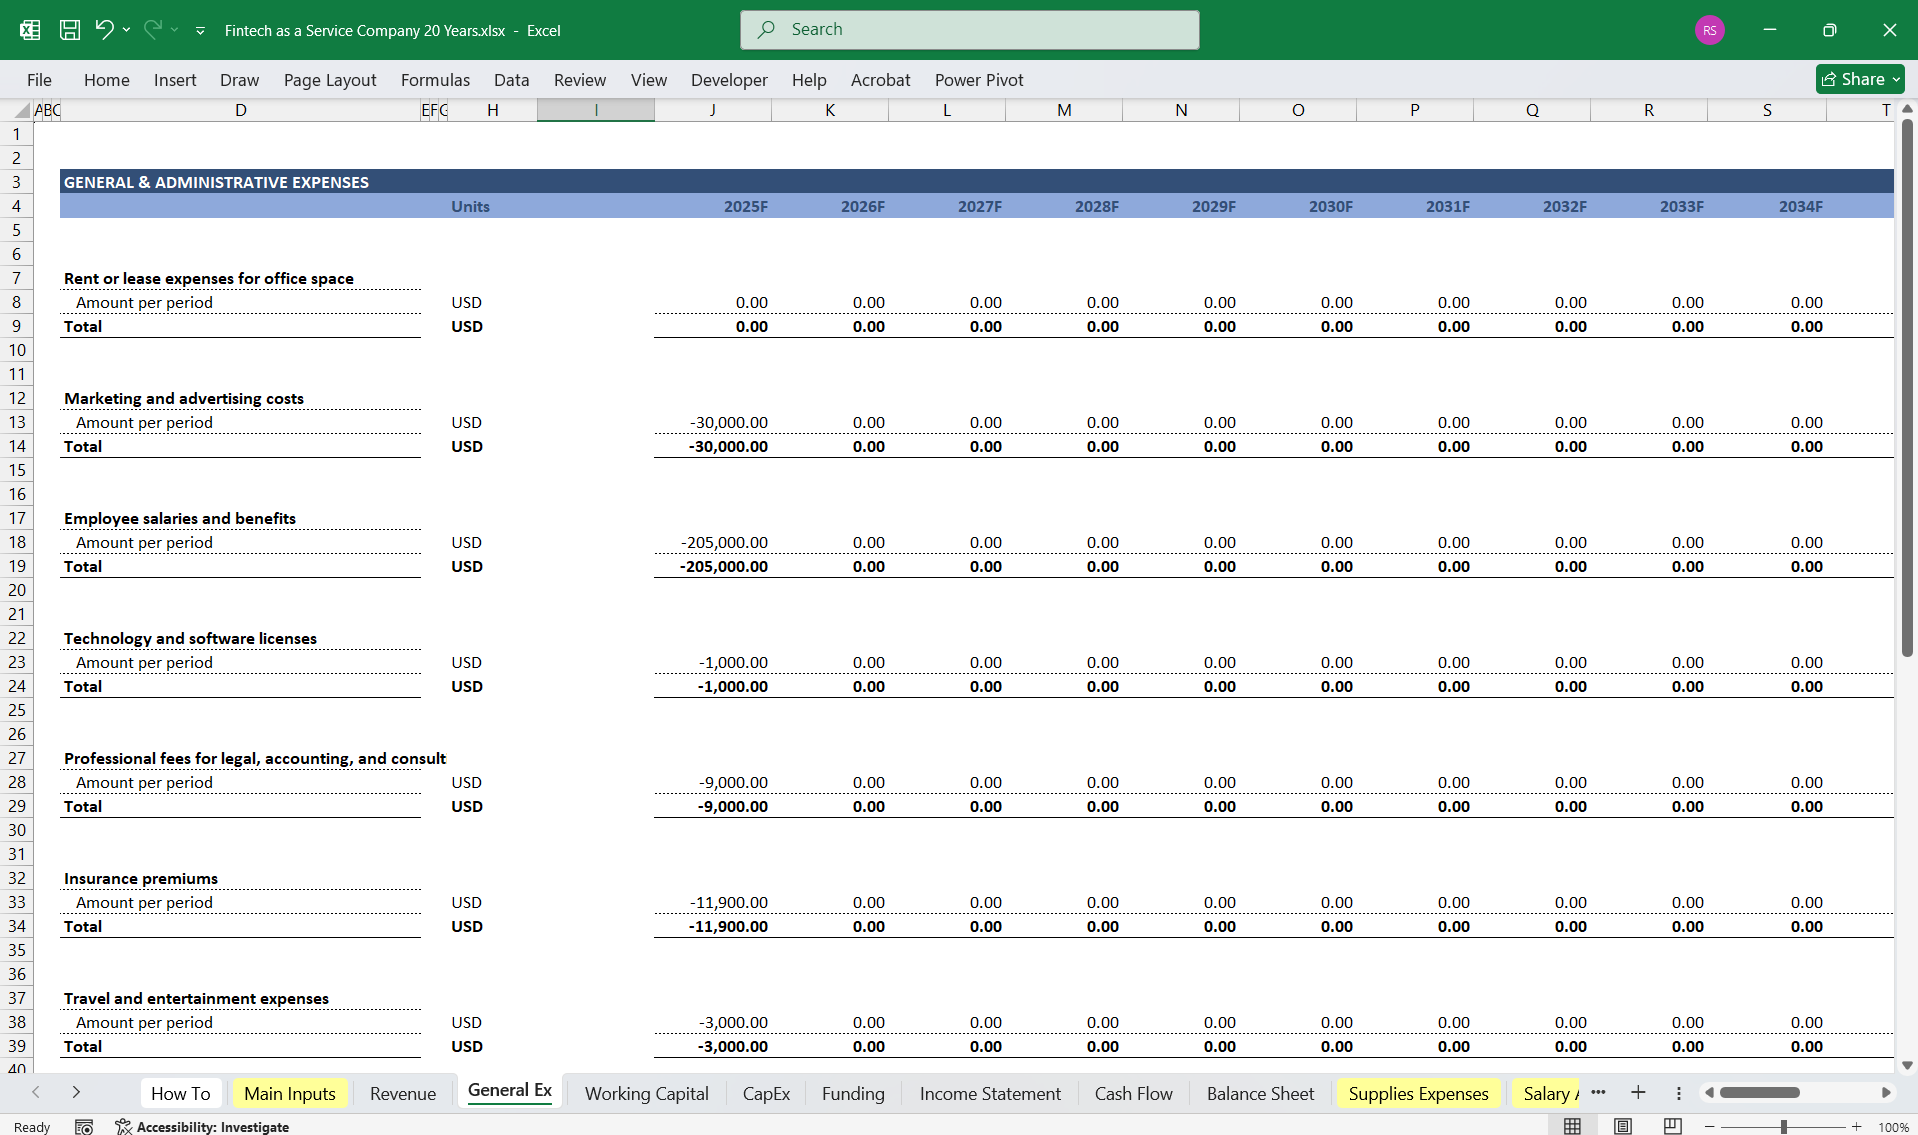
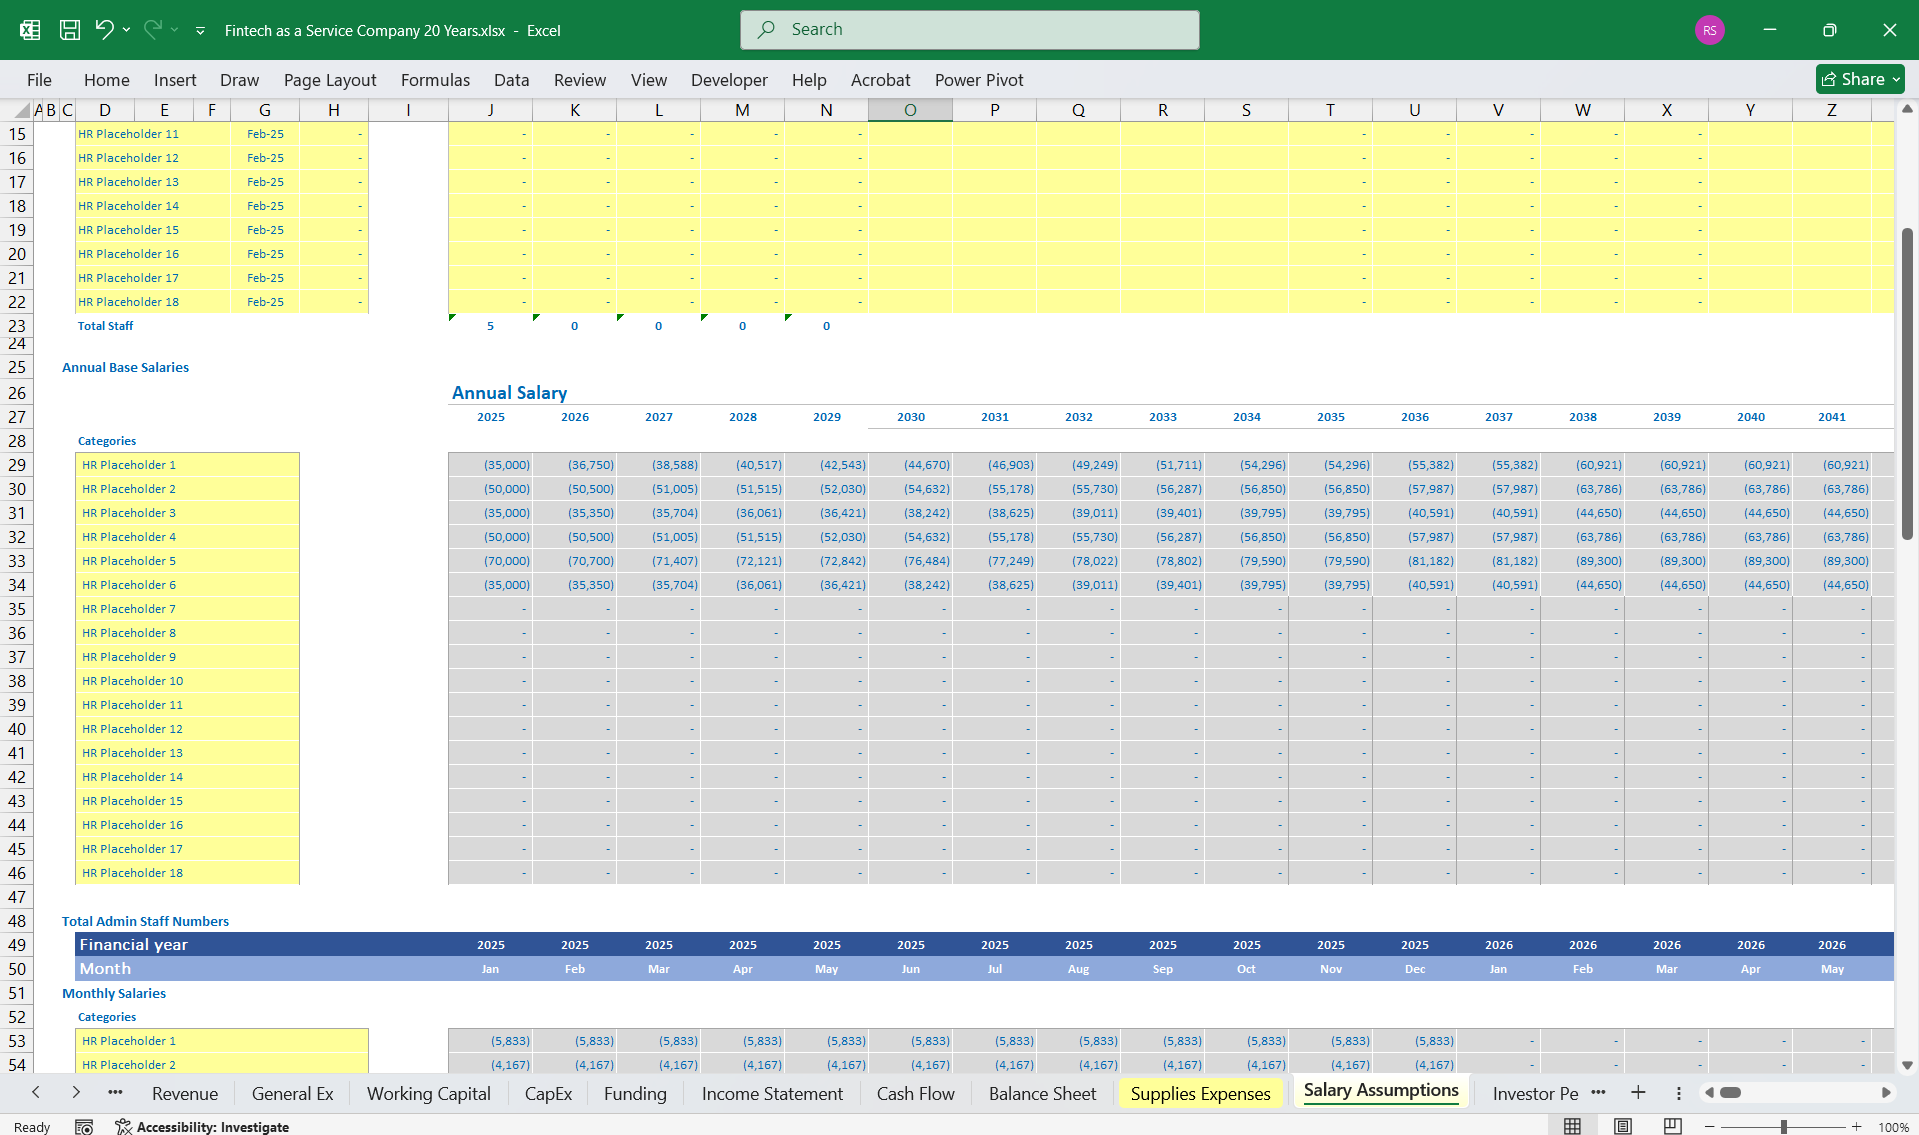
- General & Administrative (G&A) – Employee salaries, office expenses, legal, compliance.
- Depreciation & Amortization – Asset depreciation, amortization of software development costs.
- Customer Support & Success – Staff costs for assisting and retaining clients.
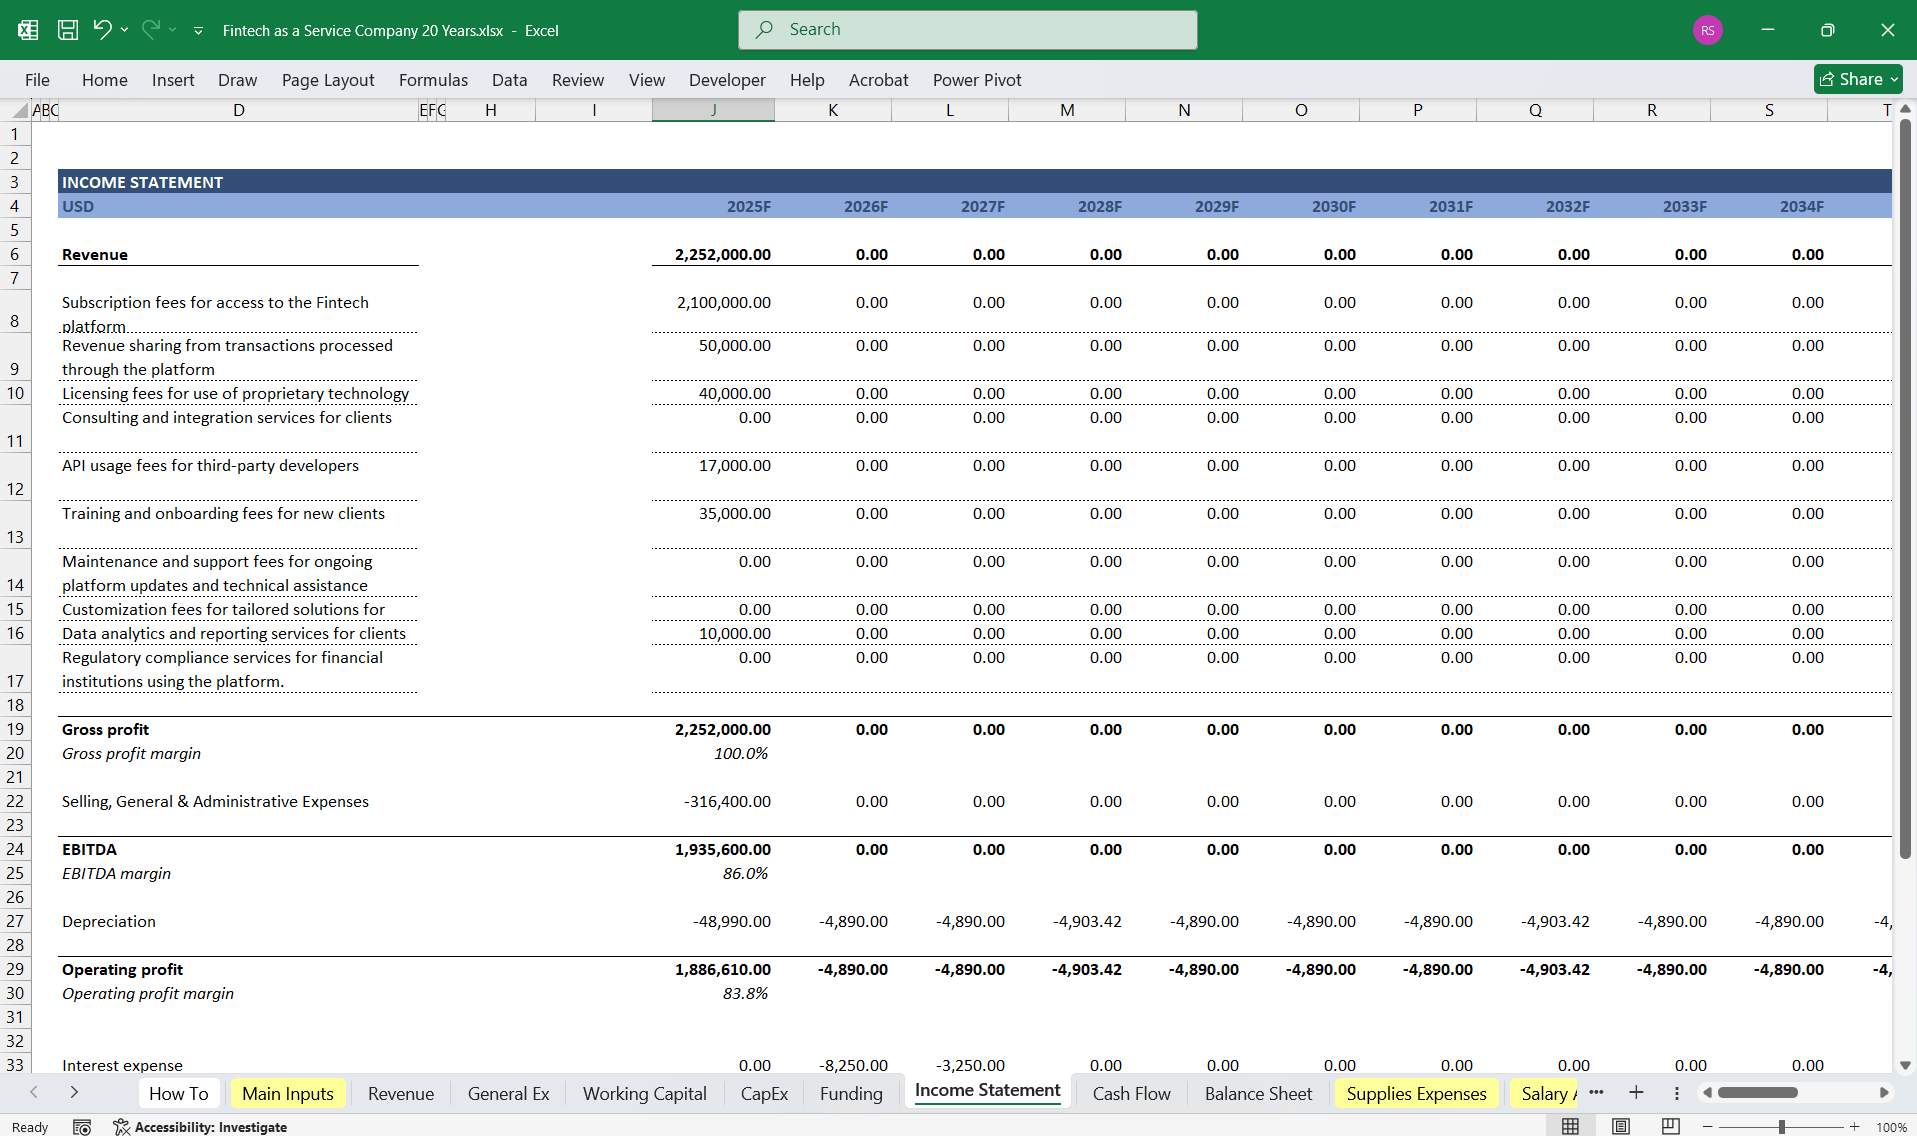
- Gross Profit = Revenue - COGS
- Operating Profit = Gross Profit - Operating Expenses
- Net Profit = Operating Profit - Interest - Taxes
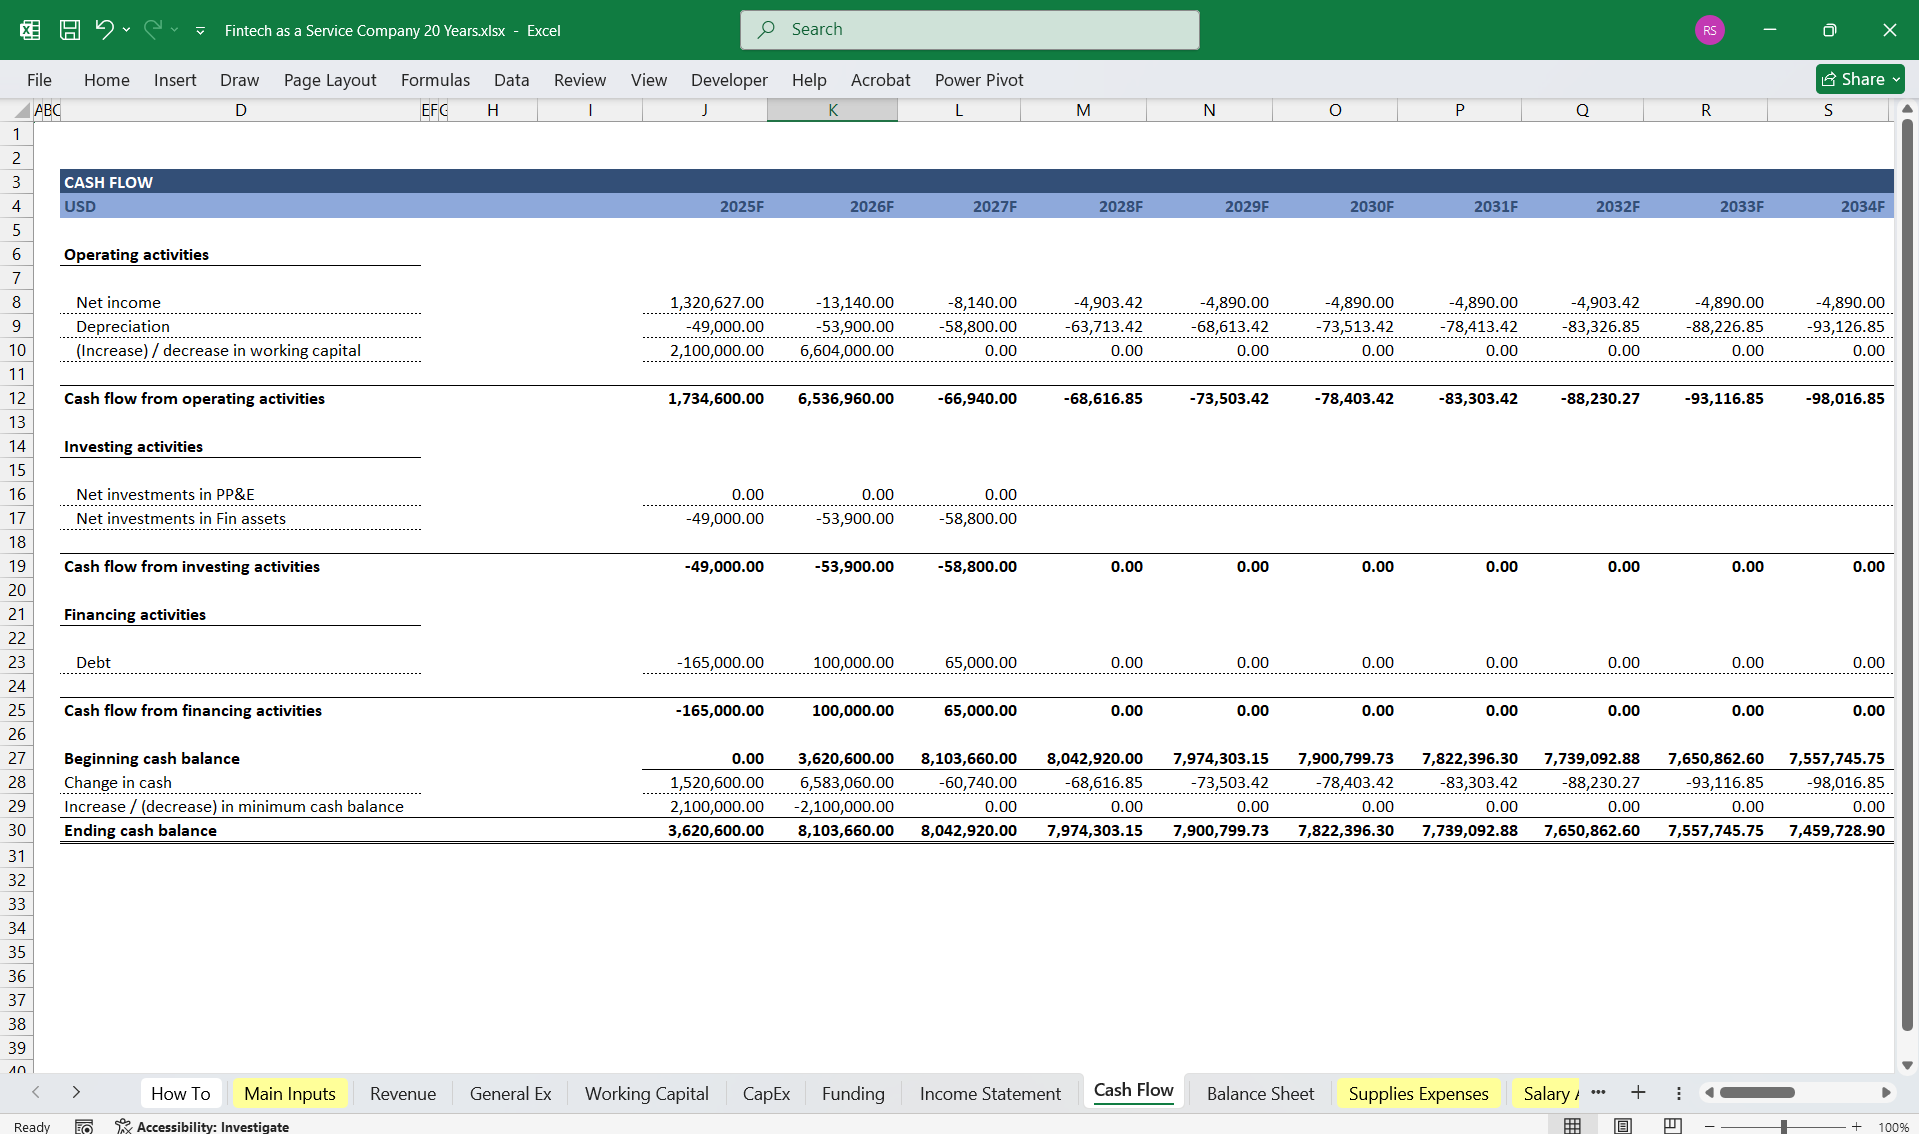
- Net Income – Carried forward from the income statement.
- Adjustments for Non-Cash Items – Depreciation & amortization, stock-based compensation.
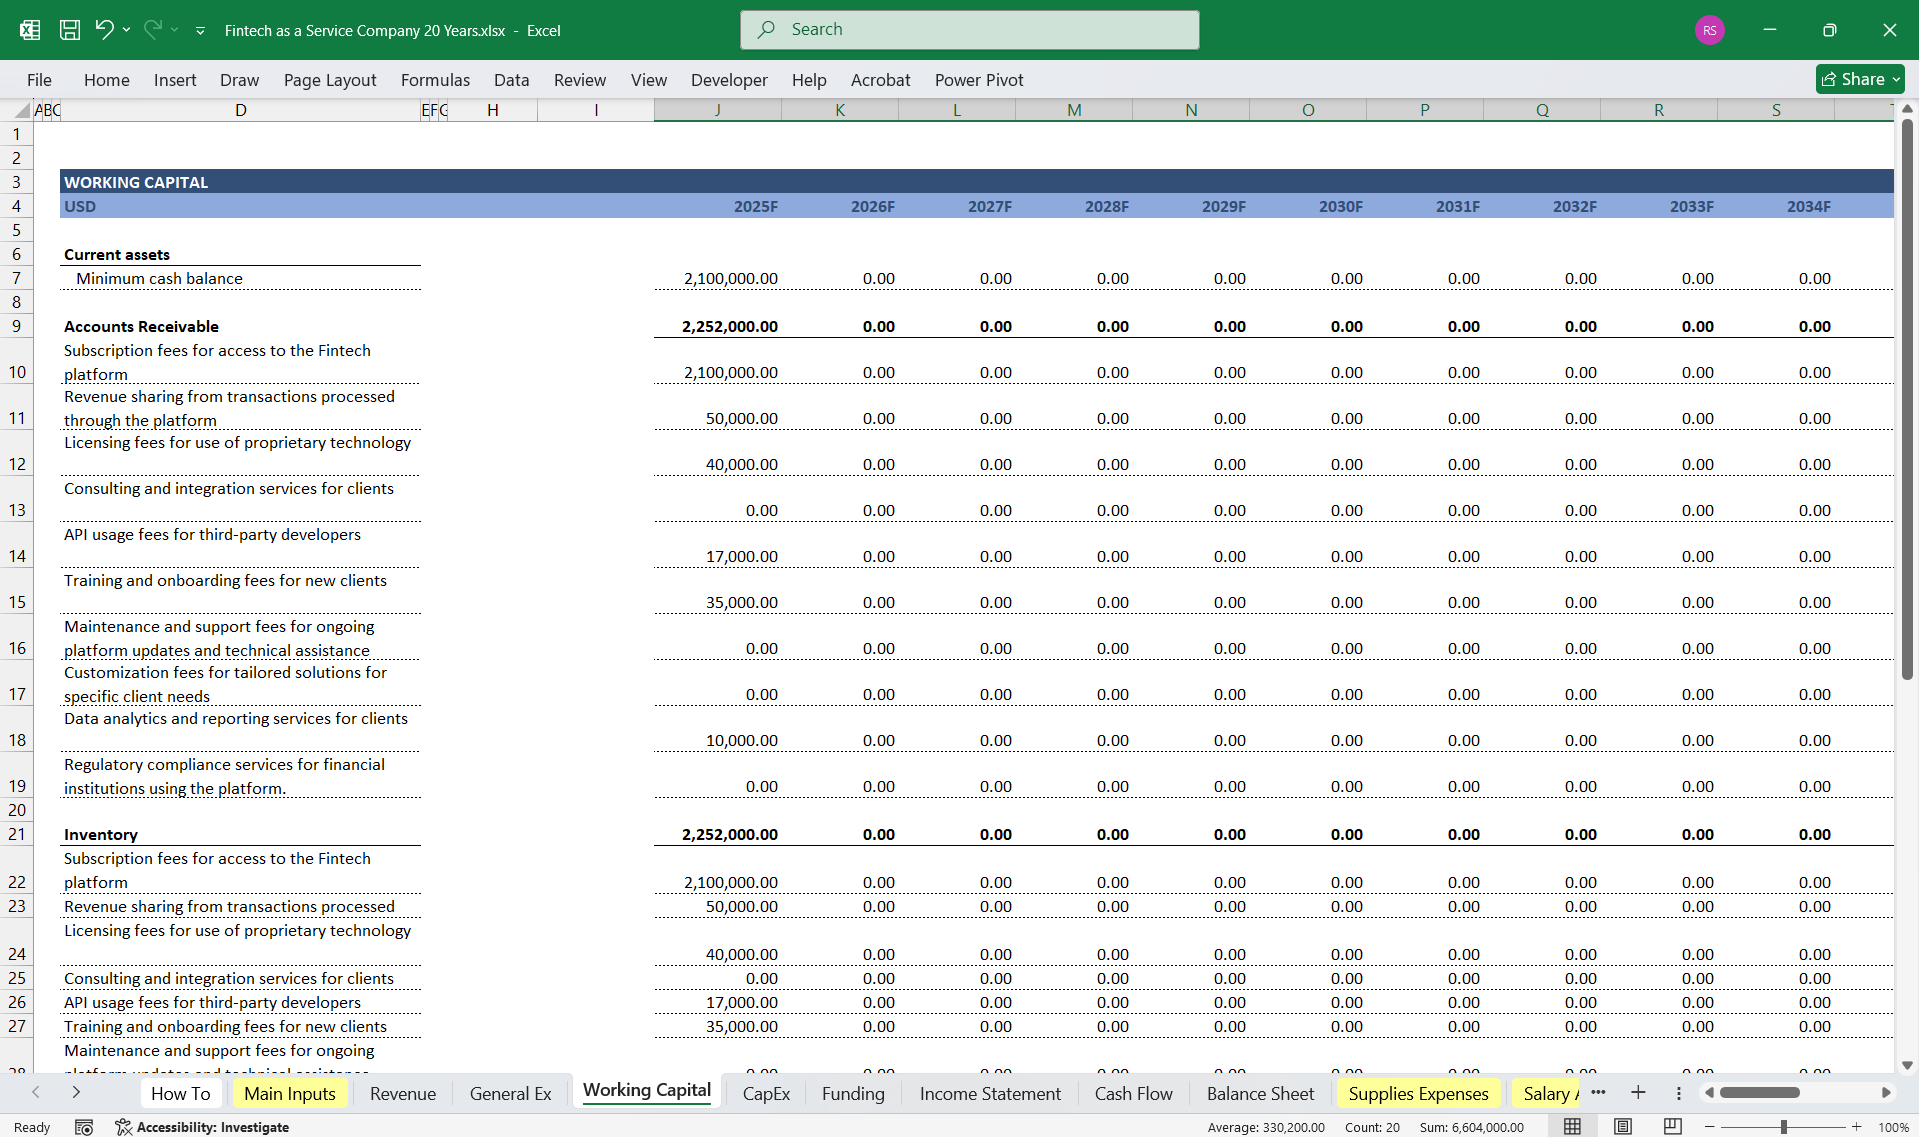
- Changes in Working Capital:
- Accounts Receivable – Adjustments for client payments.
- Accounts Payable – Adjustments for vendor and partner payments.
- Deferred Revenue – Prepaid subscription fees and service contracts.
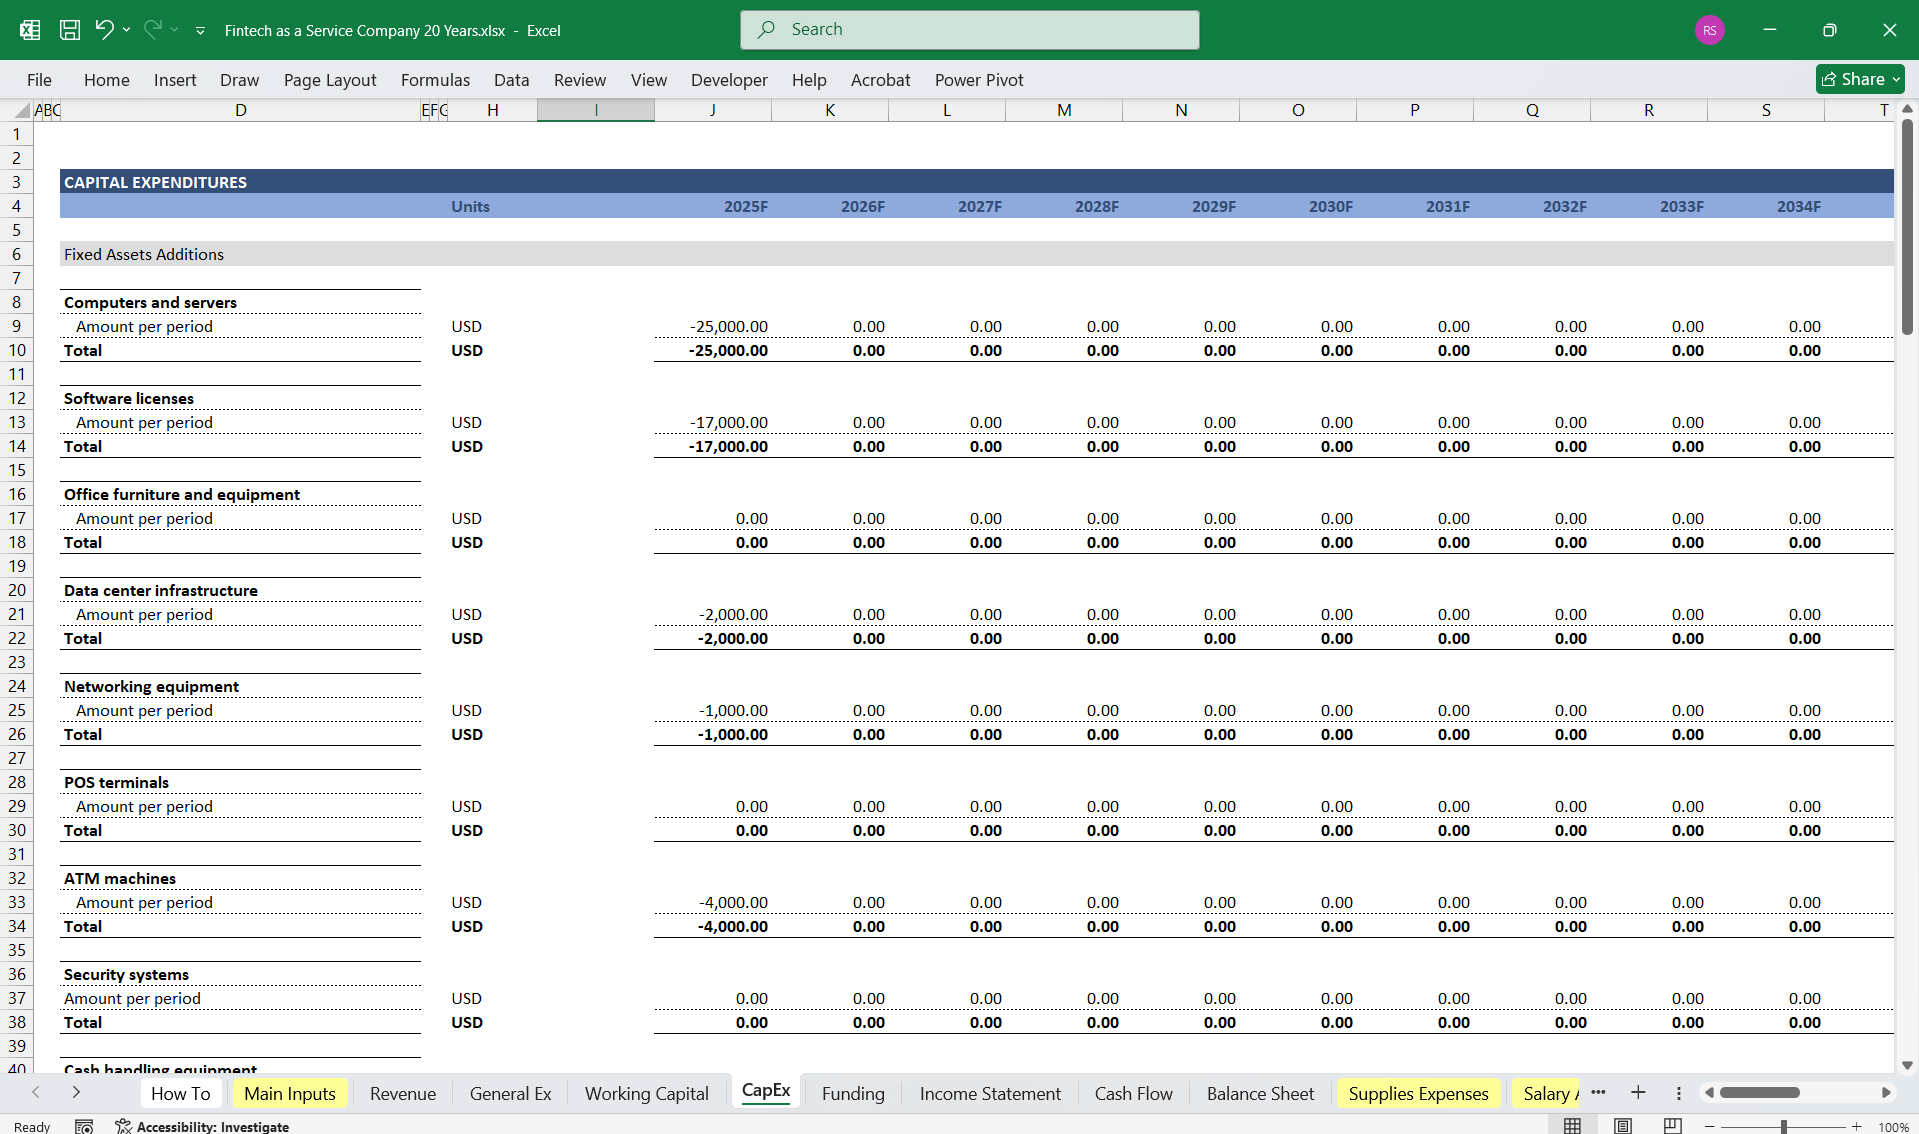
- Capital Expenditures (CapEx) – Infrastructure investment, servers, and software development.
- Acquisitions & Investments – Strategic purchases or investments in technology or partnerships.
- R&D Investments – New feature development and enhancements.
- Equity Issuance – Fundraising rounds (Seed, Series A, B, etc.).
- Debt Financing – Loan proceeds and repayments.
- Dividends & Buybacks – Cash used to return value to shareholders.
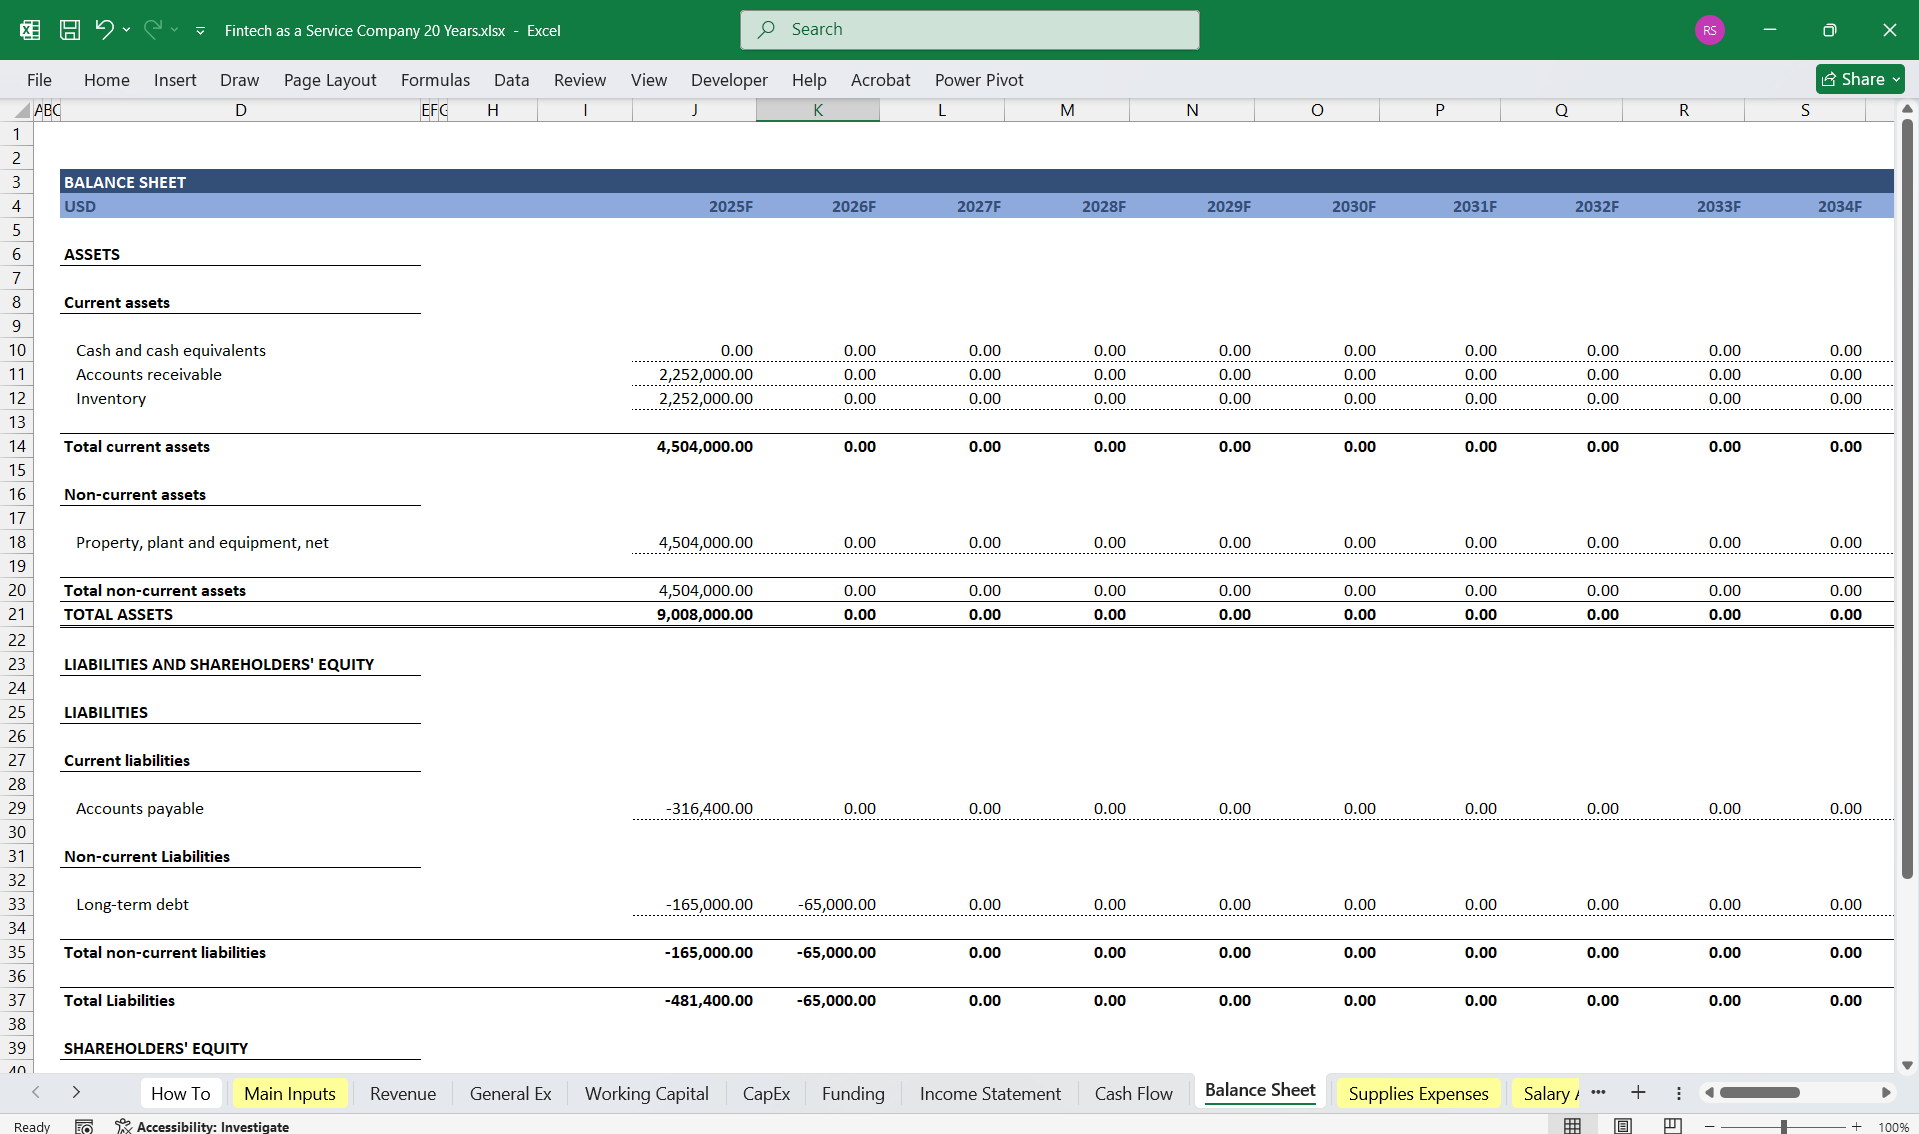
- Current Assets:
- Cash & Cash Equivalents – Available liquidity.
- Accounts Receivable – Pending payments from clients.
- Prepaid Expenses – Costs paid in advance for future services.
- Long-Term Assets:
- Property, Plant & Equipment (PP&E) – Infrastructure, servers, and technology investments.
- Intangible Assets – Software and patents.
- Goodwill – Value from acquisitions.
- Current Liabilities:
- Accounts Payable – Amounts owed to vendors.
- Deferred Revenue – Prepaid services yet to be delivered.
- Short-Term Debt – Loans due within a year.
- Long-Term Liabilities:
- Long-Term Debt – Outstanding loans beyond one year.
- Other Long-Term Liabilities – Pension obligations, lease liabilities.
- Common Stock & Additional Paid-In Capital – Equity financing.
- Retained Earnings – Profits reinvested in the business.
- Treasury Stock – Stock repurchases.
- Revenue Growth:
- High initial growth (~50% CAGR for the first 5 years), stabilizing to ~10-15% annually.
- Operating Margins:
- Improving efficiency as the company scales, targeting 30-40% EBITDA margins.
- Customer Churn Rate:
- Assumed 5-10% annually, offset by new client acquisitions.
- Capital Expenditure (CapEx):
- 15-20% of revenue in early years, reducing as infrastructure stabilizes.
- R&D Spend:
- 20-30% of revenue in early years, declining to ~10% over time.
- Working Capital Management:
- Assumed improvement in DSO (Days Sales Outstanding) and DPO (Days Payable Outstanding) over time.
This detailed three-statement model provides a comprehensive 20-year financial projection for a Fintech as a Service company. It integrates various revenue streams and cost structures to support long-term financial planning and valuation.
This Best Practice includes
1 Excel Financial Model
Further information
Provides thorough oversight, tracking, and reporting of Fintech-as-a-Service finances, including updates on budget utilisation and projections.
