
EasePro: Actual vs Budget High Level YTD
Originally published: 19/08/2026 16:36
Publication number: ELQ-21655-1
View all versions & Certificate
certified

EasePro: Actual vs Budget High Level YTD

Budget vs Actual Financial Performance Dashboard & P&L Analysis - A practical Excel template for Small, Medium business owners and accountants

Description
Turn your monthly PnL data into a clear management performance view with this Excel Budget vs Actual Financial Performance Dashboard and P&L Analysis Model. 

Most businesses do not struggle because they lack financial data.
They struggle because the data is sitting in different reports, different account labels, and different monthly files — and by the time someone prepares a useful view, the month is already gone.
This Excel Budget vs Actuals Template was built for exactly that problem. 

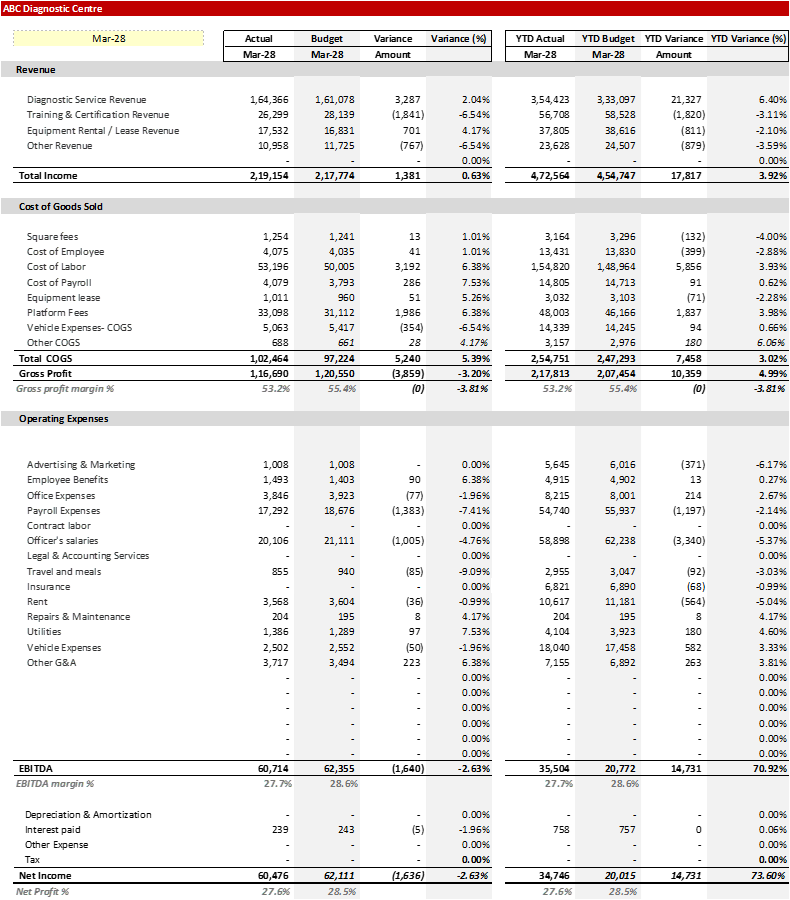
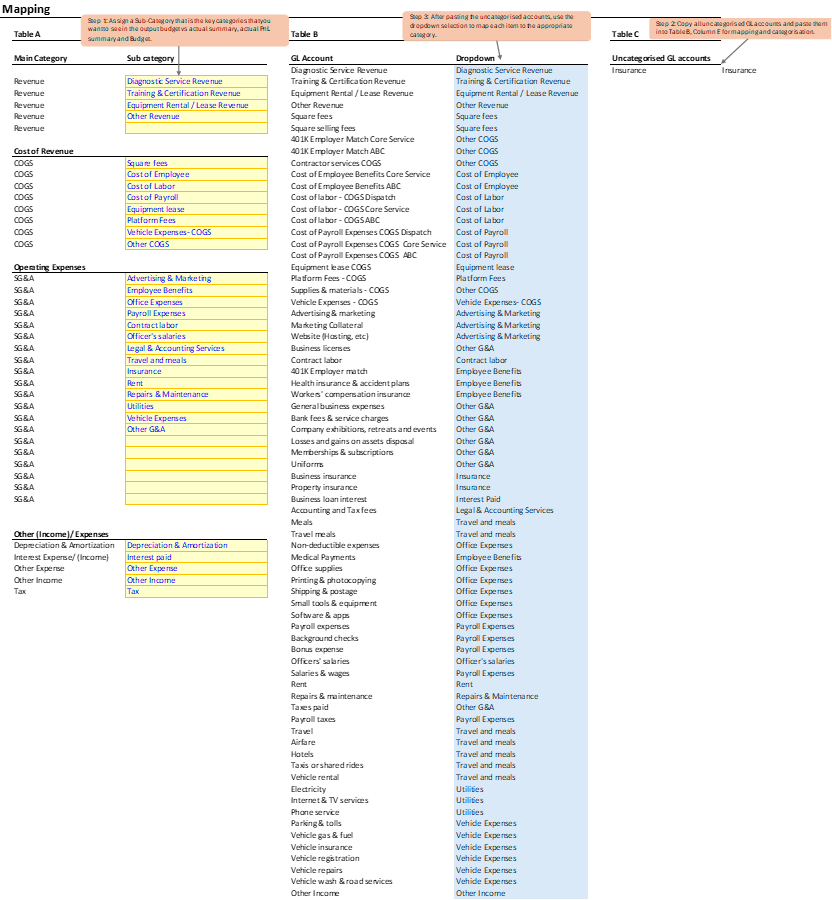
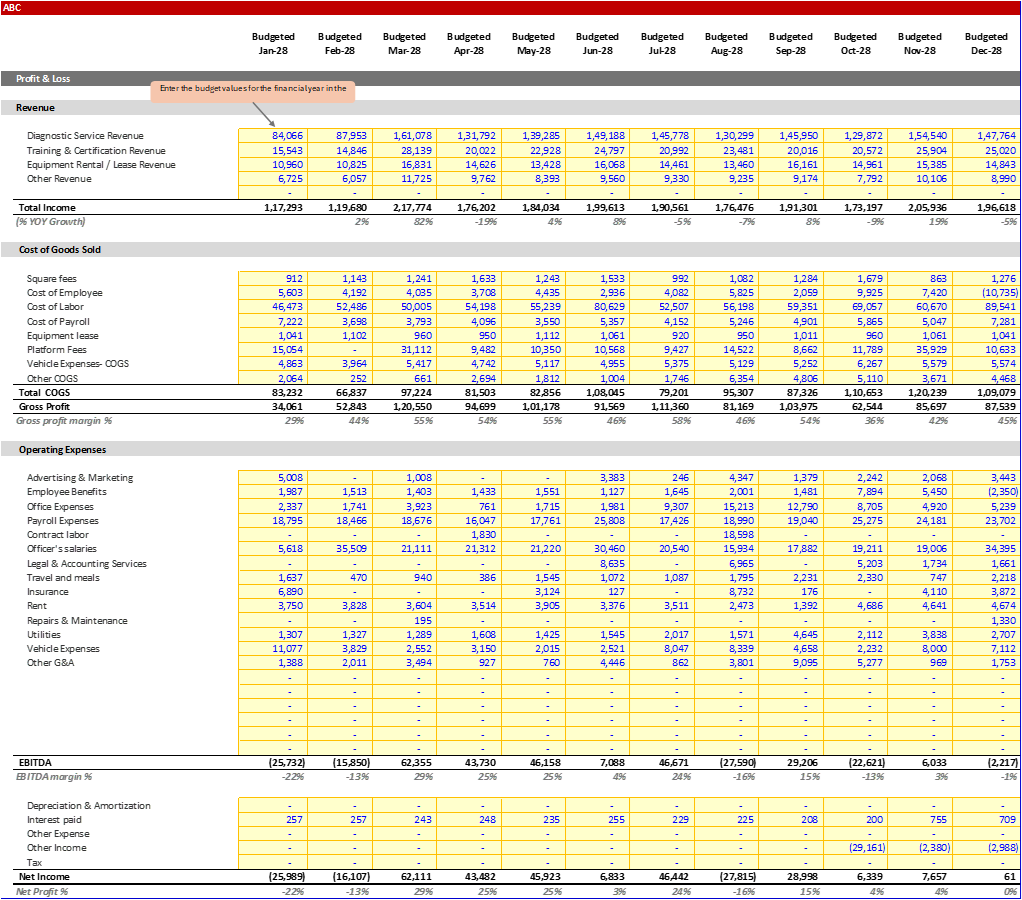
You can paste your monthly P&L data, add budget numbers, map account lines into proper financial categories, and review performance across Revenue, Cost of Goods Sold, Gross Profit, Operating Expenses, EBITDA and Net Income.

The model calculates monthly and year-to-date budget variances, along with key profitability metrics such as Gross Profit Margin, EBITDA Margin, and Net Profit Margin.

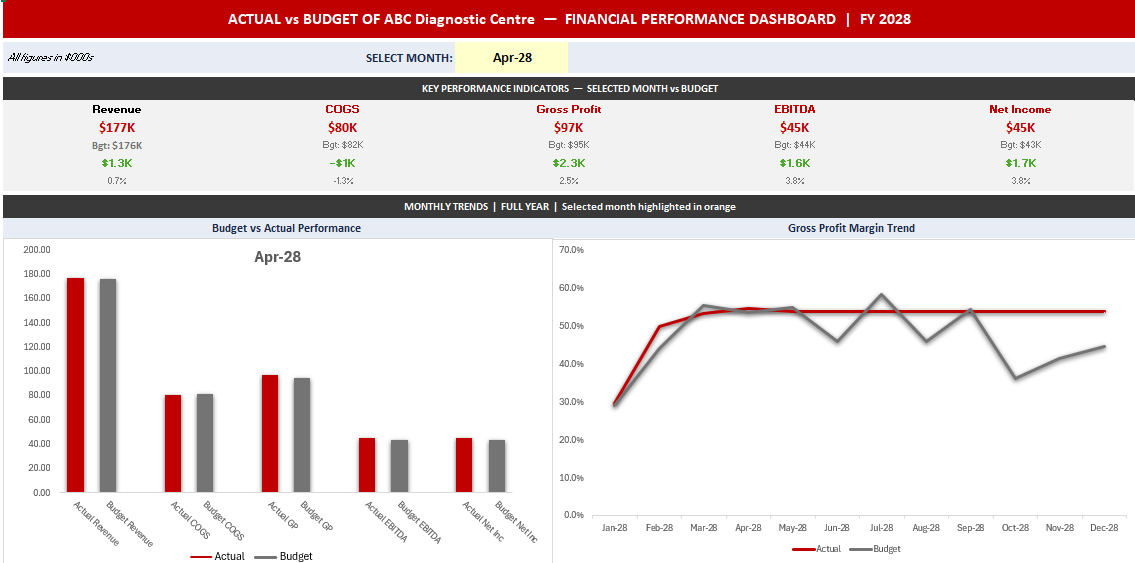
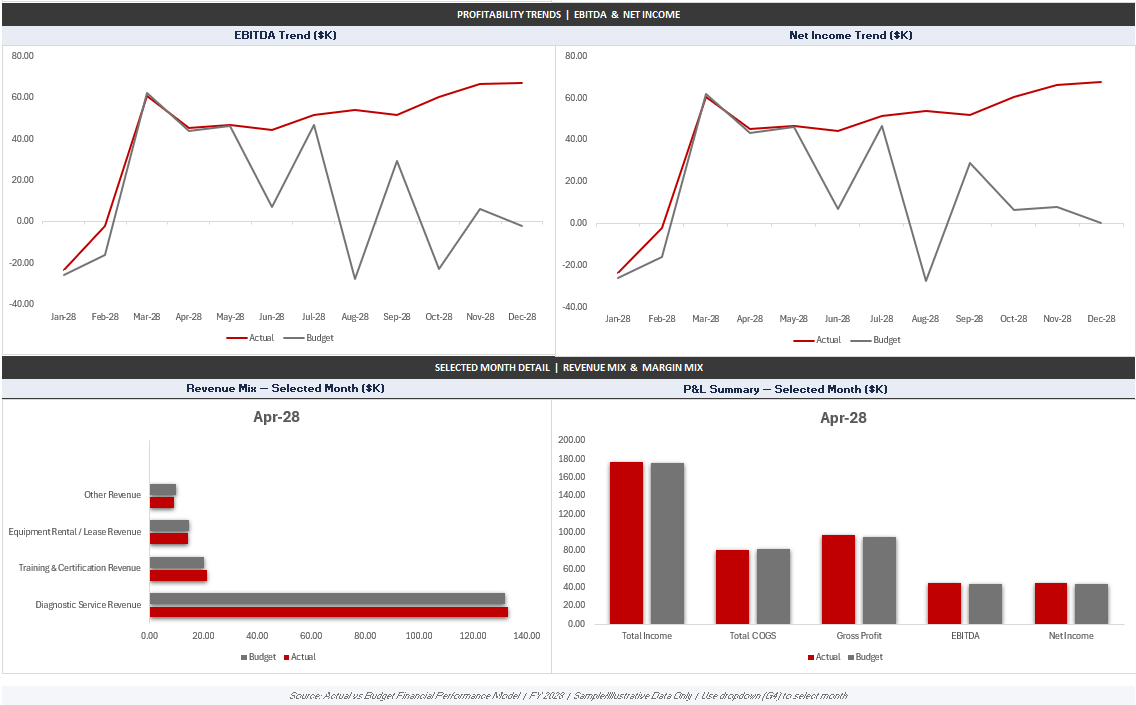
The dashboard is designed for monthly management reporting and finance review meetings. You can select a month and immediately see actual vs budget performance, profitability trends, revenue mix, and P&L summary comparisons.

If your accounting system gives you reports but not clear management insight, this template helps bridge that gap.

What the Template Helps You Do
  • Compare actual results against budget
  • Review monthly and YTD variance
  • Analyze Revenue, COGS, Gross Profit, EBITDA, and Net Income
  • Track Gross Profit Margin, EBITDA Margin, and Net Profit Margin
  • Map uncategorized P&L accounts into proper financial categories
  • Build a cleaner monthly reporting rhythm
  • Present financial performance in a simple dashboard format
  • Identify where performance is better or worse than expected

Best For
  • Small and mid-sized businesses
  • Consulting firms preparing client reporting packs
  • Companies that need a simple budget vs actuals reporting model in Excel

This Best Practice includes
Excel financial performance dashboard with budget vs actual P&L, monthly trends, YTD variance and profitability analysis

EasePro Consulting - Anchal Singhal offers you this Best Practice for free!

download for free

Add to bookmarks

Discuss

Further information

Provide a structured Excel framework for comparing actual financial performance against budget and analyzing monthly and year-to-date P&L variances. The objective is to help management quickly identify changes in revenue, costs, margins, EBITDA and net income and use the results for better financial decision-making.

Best suited for businesses that maintain monthly P&L data and want to compare actual results with budget. It is particularly useful for small & medium businesses owners and finance teams conducting monthly financial reviews, management reporting, budget variance analysis, profitability analysis and YTD performance tracking.

Less suitable for businesses requiring a cash flow forecast, balance sheet analysis, daily financial reporting, detailed customer or product profitability or a fully integrated accounting system. The model is designed primarily for monthly P&L performance analysis, budget vs actual comparison, variance analysis and management reporting.


0.0 / 5 (0 votes)

please wait...